. 2018 Jan 19:7:e31805.
doi: 10.7554/eLife.31805.

A single, continuous metric to define tiered serum neutralization potency against HIV

Affiliations

A single, continuous metric to define tiered serum neutralization potency against HIV

Peter Hraber et al. Elife. .

Abstract

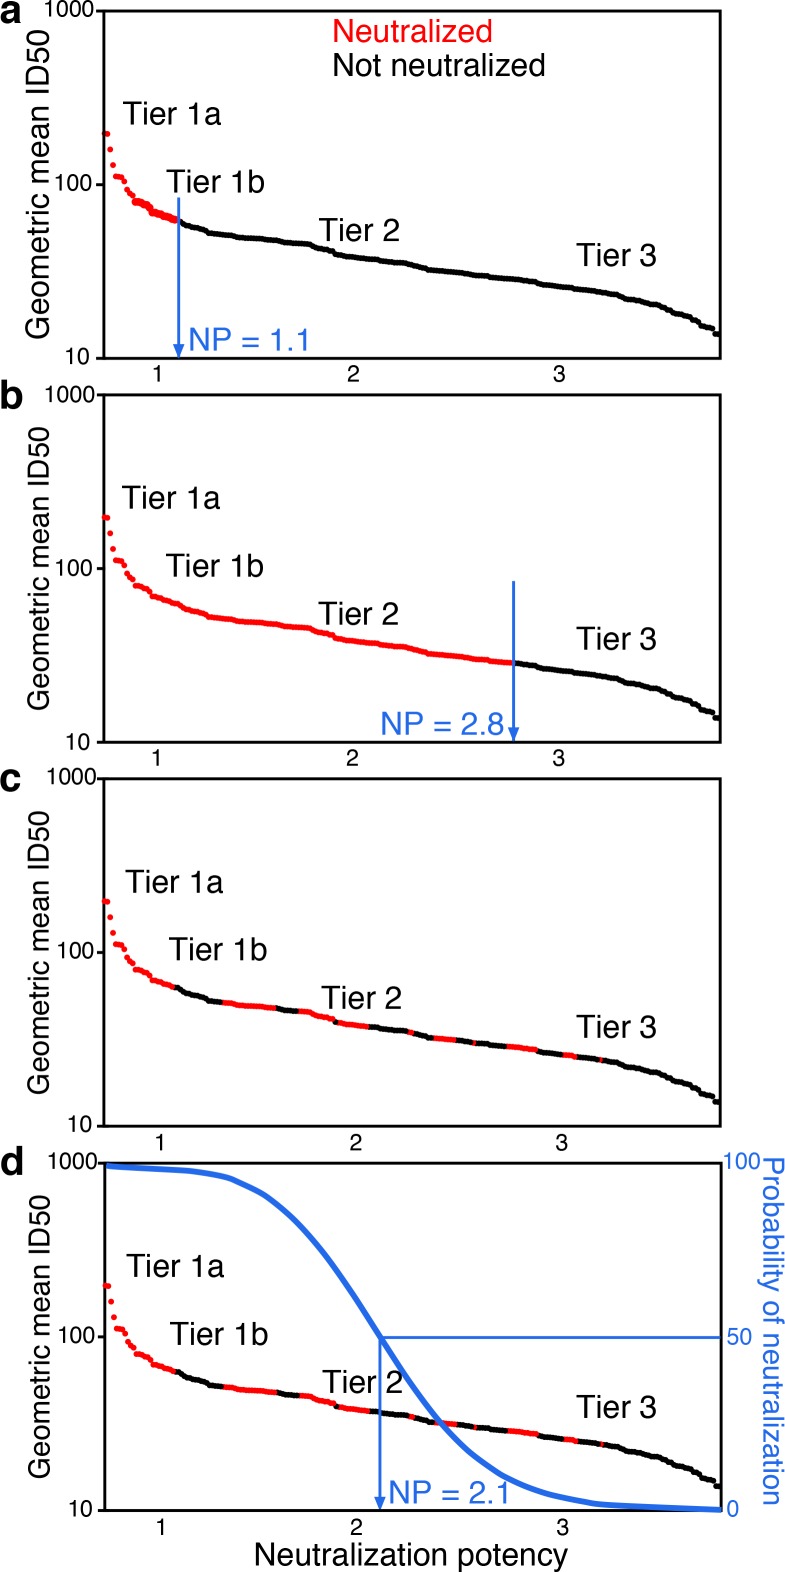
HIV-1 Envelope (Env) variants are grouped into tiers by their neutralization-sensitivity phenotype. This helped to recognize that tier 1 neutralization responses can be elicited readily, but do not protect against new infections. Tier 3 viruses are the least sensitive to neutralization. Because most circulating viruses are tier 2, vaccines that elicit neutralization responses against them are needed. While tier classification is widely used for viruses, a way to rate serum or antibody neutralization responses in comparable terms is needed. Logistic regression of neutralization outcomes summarizes serum or antibody potency on a continuous, tier-like scale. It also tests significance of the neutralization score, to indicate cases where serum response does not depend on virus tiers. The method can standardize results from different virus panels, and could lead to high-throughput assays, which evaluate a single serum dilution, rather than a dilution series, for more efficient use of limited resources to screen samples from vaccinees.

Keywords: antibodies; clinical trials; epidemiology; global health; immunology; logistic regression; neutralization; none; serology; vaccines.


Conflict of interest statement

PH, BK, KW, DM, MR No competing interests declared

Figures

Figure 1.
Figure 1.. Conceptual introduction to serum neutralization potency (NP).
(a) A hypothetical serum, which neutralizes tier 1A and some tier 1B viruses (red), but does not neutralize any tier 2 or 3 viruses (black), is assigned a neutralization potency (NP) of 1.1. (b) Another hypothetical serum may neutralize all tier 1A and B viruses and most tier 2 viruses, for NP of 2.8. In practice (c), the two outcomes do not segregate so clearly. Instead, positive and negative results among pseudoviruses are interspersed. Neutralization outcomes are scattered over the range of mean ID50s, and more sensitive viruses are enriched for positive neutralization. Logistic regression provides an objective way to distinguish neutralization outcomes. The neutralization outcome is treated as a probability (d). We use logistic regression to define the serum NP, which is the Env neutralization index (NI) value with 50% probability of neutralization that best separates neutralized and non-neutralized viruses.
Figure 2.
Figure 2.. Neutralization potencies (NP) in the M-group panel of 225 Envs and 205 sera.
(a) Linear transformation of NSDP virus geometric mean ID50 neutralization titers provides a tiered scale, based on previous reports. Symbol colors indicate neutralization sensitivity, from ranked virus mean ID50s, and range from most (red) to least sensitive (grey). Envs identified for use in candidate subset panels that reproduce full virus panel NP values are labeled, with corresponding symbols colored black. We use the transformed values to compute serum NP. (b) Serum NPs are correlated with geometric mean ID50s per serum but, because of the transformation applied to viruses, range from about 1 to 4, consistent with the established Env tier classification scheme. Symbol colors show potency among ranked mean serum ID50s, and range from least (grey) to most potent (blue). Other colors indicate results from χ2 tests for non-zero slope, with Bonferroni corrections for 205 tests (red, experiment-wide p>0.1/205, that is per-comparison p>0.000488; magenta, experiment-wide p>0.05/205, per-comparison p>0.000244).
Figure 2—figure supplement 1.
Figure 2—figure supplement 1.. Comparison of observed and bootstrap-resampled neutralization potency values.
(a) Serum NPs computed from the 225-Env panel (circles) and from 500 bootstrap-resampled replicate panels of 225 Envs, with replacement. The resampled distribution is summarized as the median and interquartile range (IQR) using a tick and bar, respectively. Symbol colors indicate results from χ2 tests for non-zero slope, using Bonferroni corrections for 205 tests (red, experiment-wide p>0.1/205, that is per comparison p>0.000488; magenta, experiment-wide p>0.05/205, per comparison p>0.000244). Results with adjusted p-values below 0.05 are colored by rank serum neutralization potency (grey to blue), as in Figure 2b. (b) Differences between resampled and observed NP values. Resampled NP median and IQR are shown, with the observed NP values subtracted.
Figure 3.
Figure 3.. Neutralization outcomes and NP computation for a typical serum, SA.C37.
This serum was chosen for illustration because it represents the median serum potency. (a) Outcomes for each of 225 viruses are either neutralized (ID50 >50, red) or not (ID50 ≤50, black) and are scattered noisily over virus mean ID50s, as in the hypothetical example (Figure 1c). (b) Beeswarm plot of the same data summarizes the NI distribution (tier-scaled geometric mean ID50 per virus) by outcome. The χ2 p-value for significance of the slope is 4.79 × 10−12. A superimposed curve shows the inferred logistic function, and a vertical line indicates the NP at 2.5. Symbol color indicates virus neutralization sensitivity, as in Figure 2a.
Figure 4.
Figure 4.. Panel-based NP estimates for a typical serum.
The serum SA.C37 (Figure 3) was chosen for illustration because it represents median serum potency. (a) Global virus panel of 11 Envs. Lasso-selected (b) 10- and (c) 20-Env panels. In each case, panel viruses are identified by name, and text annotations indicate the NP (top-right corner), and the p-value for the null hypothesis of no slope (center).
Figure 4—figure supplement 1.
Figure 4—figure supplement 1.. Heatmap of NSDP ID50 values identifies panel Envs.
The Venn diagram summarizes set membership in global (11-Env) and lasso (10- and 20-Env) panels. Lasso identified 10 Envs that explained 47.2% of the deviance that would be explained by a fully saturated model (the maximum-likelihood solution, involving all Envs) and 20 Envs explained 80.8% of the deviance. The lasso set of 10 is fully contained within the larger set of 20 Envs. Adding more than 20 Envs gave ever smaller increases in the proportion of deviance explained (not shown). Text colors correspond to Env names in the heatmap. ID50 values in the heatmap are shaded according to the legend in the upper-right corner. Envs (rows) and sera (columns) in the heatmap were hierarchically clustered, with leaf order weighted to indicate geometric mean titers. Only the column dendrogram is shown. Serum and Env names are prefixed by clade.
Figure 4—figure supplement 2.
Figure 4—figure supplement 2.. Concordance of neutralization index estimates.
NP values are highly correlated when comparing between holdout and panel Envs, and between each of the panels we evaluated. In each comparison, using Kendall’s τ, p<10−16. (a–c) Comparisons of neutralization indices from (a) 11-, (b) 10-, and (c) 20-Env panels with the much larger remaining holdout (non-panel) Envs. (d–f) Comparisons between NPs from the three panels described in the text. In each panel, points are colored to indicate p-values from panels depicted along the x-axis.
Figure 4—figure supplement 3.
Figure 4—figure supplement 3.. Cumulative p-value distributions for three candidate panels.
Smaller p-values indicate lower chance of a false positive in inferring slope of the logistic regression is non-zero, that is the NP is well defined. Light- and dark-grey shaded regions identify p-values above 0.05 and 0.1, respectively. Results are from each of 205 sera in the NSDP panel, computed against 10-, 11-, and 20-Env panels.
Figure 5.
Figure 5.. Neutralization potency analysis recapitulates mean titers and differences between progressors and long-term non-progressors (LTNP).
Scatter-plot compares geometric mean ID50 titers, computed from 20 Envs, with NP scores, computed using 10 Envs. Symbol color shows whether the serum was from LTNP or progressor. Open circles had p-values from χ2 testing of 0.1 or more, suggesting the NP scores were unreliably quantified. Separate beeswarm plots show results for mean ID50 and NP scores, stratified by group.
Figure 6.
Figure 6.. Analysis of monoclonal bnAb combinations.
Increasing the number of bnAbs increases NP and slope. We used a cutoff IC50 of 0.1 µg/ml for 112 Envs and 27 bnAb combinations (Kong et al., 2015). (a) Neutralization potency (NP = –b0/b1, where b0 is intercept and b1 is slope of logistic function). (b) Slope (b1) of logistic function. Up to four bnAbs were combined per set. Set 1included PGT128, PG9, 10E8, and VRC07. Set 2 included 10.1074, PG9, 3BNC117, and 10E8. (PG9 and 10E8 were in both.) Letters A through F correspond to individual bnAbs and are used to label combinations, for example the four bnAbs combined in Set 1 are indicated as ACEF and in Set 2 as BCDE. p-Values indicate slope significance by χ2 test.

References

    1. Crawley MJ. Statistical Computing: An Introduction to Data Analysis Using S-Plus. Hoboken: Wiley & Sons; 2002. Proportion data: binomial errors; pp. 513–536.
    1. de Taeye SW, Ozorowski G, Torrents de la Peña A, Guttman M, Julien JP, van den Kerkhof TL, Burger JA, Pritchard LK, Pugach P, Yasmeen A, Crampton J, Hu J, Bontjer I, Torres JL, Arendt H, DeStefano J, Koff WC, Schuitemaker H, Eggink D, Berkhout B, Dean H, LaBranche C, Crotty S, Crispin M, Montefiori DC, Klasse PJ, Lee KK, Moore JP, Wilson IA, Ward AB, Sanders RW. Immunogenicity of stabilized HIV-1 envelope trimers with reduced exposure of non-neutralizing epitopes. Cell. 2015;163:1702–1715. doi: 10.1016/j.cell.2015.11.056. - DOI - PMC - PubMed
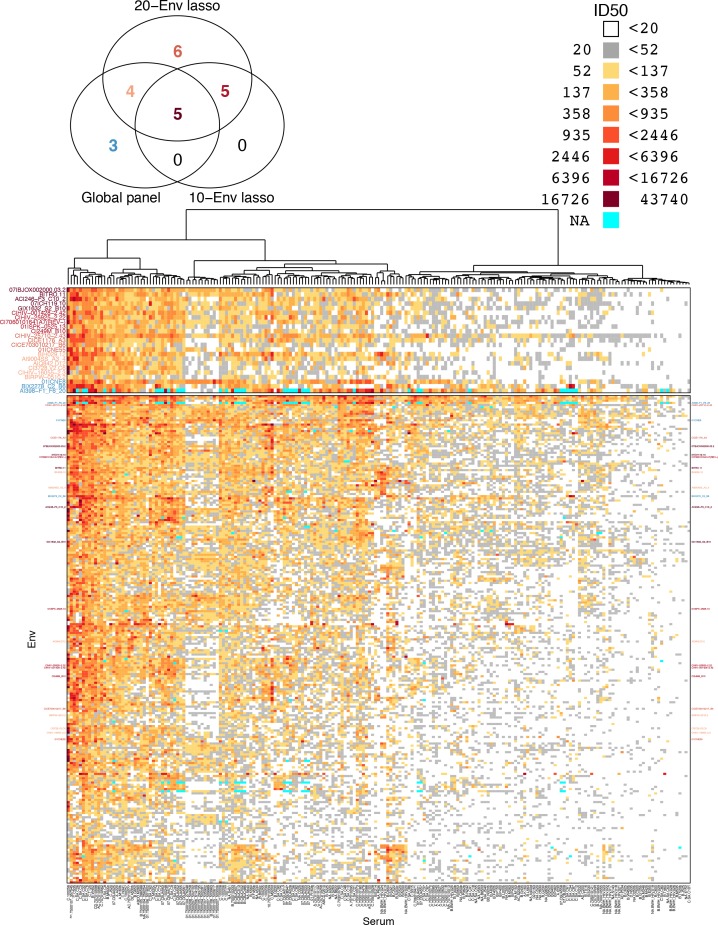
    1. deCamp A, Hraber P, Bailer RT, Seaman MS, Ochsenbauer C, Kappes J, Gottardo R, Edlefsen P, Self S, Tang H, Greene K, Gao H, Daniell X, Sarzotti-Kelsoe M, Gorny MK, Zolla-Pazner S, LaBranche CC, Mascola JR, Korber BT, Montefiori DC. Global panel of HIV-1 Env reference strains for standardized assessments of vaccine-elicited neutralizing antibodies. Journal of Virology. 2014;88:2489–2507. doi: 10.1128/JVI.02853-13. - DOI - PMC - PubMed
    1. Doria-Rose NA, Altae-Tran HR, Roark RS, Schmidt SD, Sutton MS, Louder MK, Chuang GY, Bailer RT, Cortez V, Kong R, McKee K, O'Dell S, Wang F, Abdool Karim SS, Binley JM, Connors M, Haynes BF, Martin MA, Montefiori DC, Morris L, Overbaugh J, Kwong PD, Mascola JR, Georgiev IS. Mapping polyclonal HIV-1 antibody responses via next-generation neutralization fingerprinting. PLOS Pathogens. 2017;13:e1006148. doi: 10.1371/journal.ppat.1006148. - DOI - PMC - PubMed
    1. Doria-Rose NA, Klein RM, Daniels MG, O'Dell S, Nason M, Lapedes A, Bhattacharya T, Migueles SA, Wyatt RT, Korber BT, Mascola JR, Connors M. Breadth of human immunodeficiency virus-specific neutralizing activity in sera: clustering analysis and association with clinical variables. Journal of Virology. 2010;84:1631–1636. doi: 10.1128/JVI.01482-09. - DOI - PMC - PubMed

Publication types