Comparative Study
. 2018 Apr 1;314(4):R563-R573.
doi: 10.1152/ajpregu.00289.2017. Epub 2018 Jan 3.

Body mass-specific Na+-K+-ATPase activity in the medullary thick ascending limb: implications for species-dependent urine concentrating mechanisms

Affiliations
Comparative Study

Body mass-specific Na+-K+-ATPase activity in the medullary thick ascending limb: implications for species-dependent urine concentrating mechanisms

Mun Aw et al. Am J Physiol Regul Integr Comp Physiol. .

Erratum in

  • Corrigendum.
    [No authors listed] [No authors listed] Am J Physiol Regul Integr Comp Physiol. 2019 Jun 1;316(6):R726. doi: 10.1152/ajpregu.zh6-9687-corr.2019. Am J Physiol Regul Integr Comp Physiol. 2019. PMID: 31111743 Free PMC article. No abstract available.

Abstract

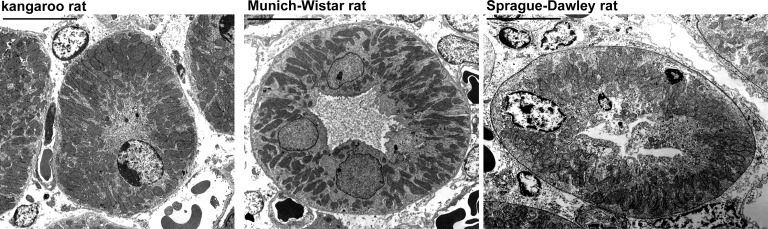
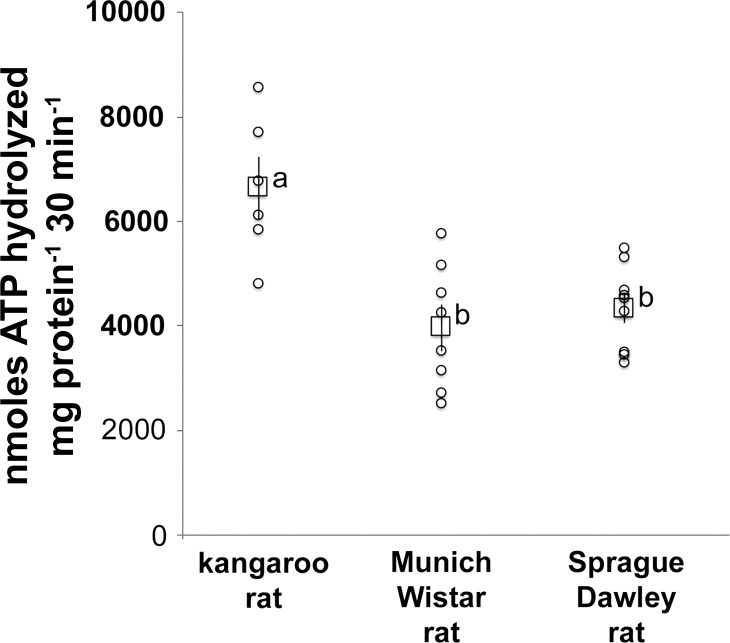
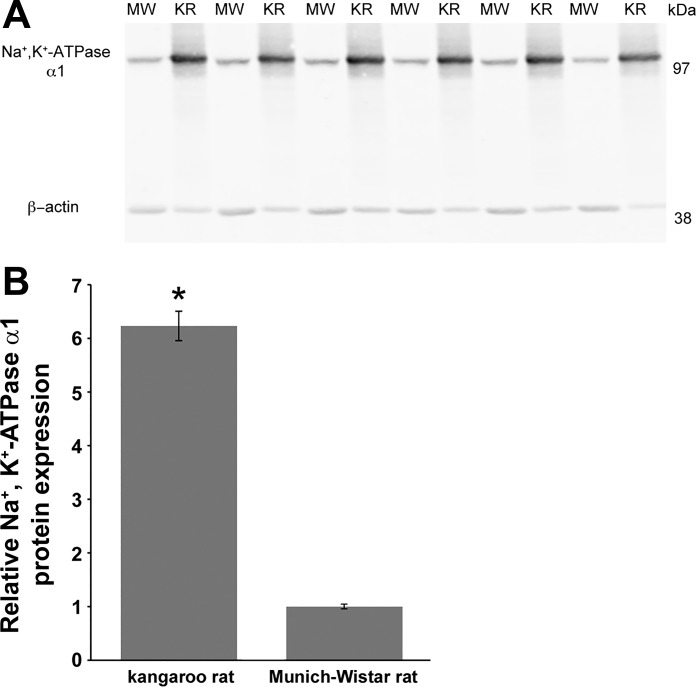
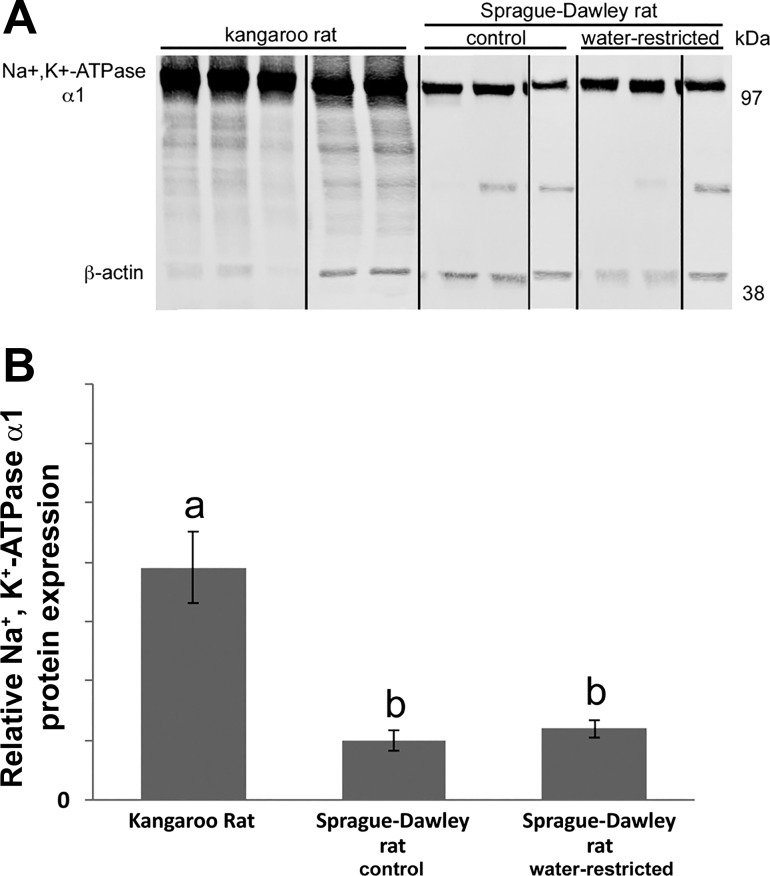
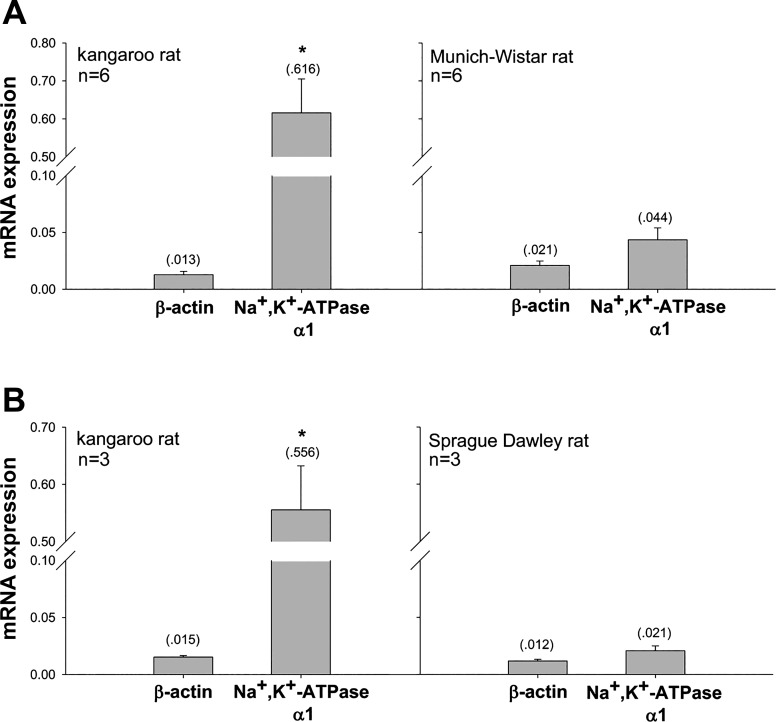
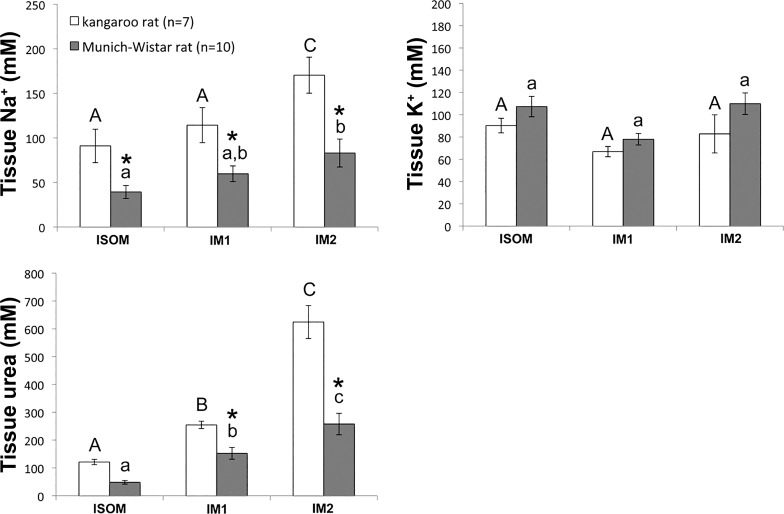
In general, the mammalian whole body mass-specific metabolic rate correlates positively with maximal urine concentration (Umax) irrespective of whether or not the species have adapted to arid or mesic habitat. Accordingly, we hypothesized that the thick ascending limb (TAL) of a rodent with markedly higher whole body mass-specific metabolism than rat exhibits a substantially higher TAL metabolic rate as estimated by Na+-K+-ATPase activity and Na+-K+-ATPase α1-gene and protein expression. The kangaroo rat inner stripe of the outer medulla exhibits significantly higher mean Na+-K+-ATPase activity (~70%) compared with two rat strains (Sprague-Dawley and Munich-Wistar), extending prior studies showing rat activity exceeds rabbit. Furthermore, higher expression of Na+-K+-ATPase α1-protein (~4- to 6-fold) and mRNA (~13-fold) and higher TAL mitochondrial volume density (~20%) occur in the kangaroo rat compared with both rat strains. Rat TAL Na+-K+-ATPase α1-protein expression is relatively unaffected by body hydration status or, shown previously, by dietary Na+, arguing against confounding effects from two unavoidably dissimilar diets: grain-based diet without water (kangaroo rat) or grain-based diet with water (rat). We conclude that higher TAL Na+-K+-ATPase activity contributes to relationships between whole body mass-specific metabolic rate and high Umax. More vigorous TAL Na+-K+-ATPase activity in kangaroo rat than rat may contribute to its steeper Na+ and urea axial concentration gradients, adding support to a revised model of the urine concentrating mechanism, which hypothesizes a leading role for vigorous active transport of NaCl, rather than countercurrent multiplication, in generating the outer medullary axial osmotic gradient.

Keywords: comparative physiology; countercurrent multiplication; loop of Henle; renal outer medulla; sodium transport.


Figures

Fig. 1.
Fig. 1.
Electron micrographs of the thick ascending limb (TAL) from the inner stripe of the outer medulla (ISOM) of the kangaroo rat, Munich-Wistar rat and Sprague-Dawley rat. The mitochondria density in the kangaroo rat is significantly higher compared with the Munich-Wistar and Sprague-Dawley rats. See results for details. Scale bars = 10 μm.
Fig. 2.
Fig. 2.
Na+-K+-ATPase activity in homogenates of the ISOM of the kangaroo rat (n = 6), Munich-Wistar rat (n = 8) and Sprague-Dawley rat (n = 9). Individual values (○) and means ± SE (☐) are shown. The statistical significance between sample means was determined with a one-way ANOVA and Tukey’s post hoc test. Mean values that share the same letter are not significantly different from each other.
Fig. 3.
Fig. 3.
The linearity of the Na+-K+-ATPase α1-protein immunoblot detection system. The detection of Na+-K+-ATPase α1-protein by immunoblot was linear for a range of 5–40 µg total protein. A: immunoblot with 5–40 μg of protein from Munich-Wistar rat ISOM applied to each lane. B: quantification of Na+-K+-ATPase α1 normalized to band intensity measured for 5 µg total protein.
Fig. 4.
Fig. 4.
Na+-K+-ATPase α1-protein expression in the ISOM of the kangaroo rat (KR) and the Munich-Wistar rat (MW). A: immunoblots with 20 μg of protein applied to each lane; each lane represents a different animal. B: quantification of Na+-K+-ATPase α1 immunoblot normalized to β-actin; n = 6 for each species. Kangaroo rat data are expressed relative to the mean of the Munich-Wistar rat, which was set to 1. *Significant difference in protein expression between species by Student’s unpaired t-test.
Fig. 5.
Fig. 5.
Na+-K+-ATPase α1-protein expression in the ISOM of the kangaroo rat and the Sprague-Dawley rat, the latter with water ad libitum (control) or water restricted for 72 h (see methods). A: immunoblots with 10 μg of protein applied to each lane; each lane represents a different animal. Black lines denote where blot was cut for rearrangement of lanes. B: quantification of Na+-K+-ATPase α1-immunoblot normalized to β-actin; n = 5 (kangaroo rat) and n = 3 (Sprague-Dawley rats). Kangaroo rat and water-restricted Sprague-Dawley rat data are expressed relative to the mean of the control Sprague-Dawley rat, which was set to 1. Kangaroo rats were mixed gender. The statistical significance between sample means was determined with a one-way ANOVA and Tukey’s post hoc test. Mean values that share the same letter are not significantly different from each other.
Fig. 6.
Fig. 6.
Na+-K+-ATPase α1-mRNA expression in the ISOM of the kangaroo rat compared with the Munich-Wistar rat (A) and kangaroo rat compared with the Sprague-Dawley rat (B), as determined by real-time PCR. β-Actin expression was not significantly different between the two species in each panel. Arbitrary units; means shown in parentheses. *Significant difference in gene expression between species by Student’s unpaired t-test.
Fig. 7.
Fig. 7.
Na+, K+ and urea concentrations in the inner and outer medulla of the kangaroo rat and the Munich-Wistar rat. Na+, K+ and urea concentrations were determined in three medullary zones: the ISOM, outer 50% of the inner medulla (IM1), and inner 50% of the inner medulla (IM2). The statistical significance of differences between sample means was determined with a two-way, repeated-measures, mixed-model ANOVA, and post hoc Bonferroni adjustments were calculated for each tested effect (zone, species or zone*species). *Significant differences between species in each zone; bars sharing the same letter of the same case are not significantly different from one another.

References

    1. Abrahams S, Greenwald L, Stetson DL. Contribution of renal medullary mitochondrial density to urinary concentrating ability in mammals. Am J Physiol Regul Integr Comp Physiol 261: R719–R726, 1991. - PubMed
    1. Ares GR, Caceres PS, Ortiz PA. Molecular regulation of NKCC2 in the thick ascending limb. Am J Physiol Renal Physiol 301: F1143–F1159, 2011. doi:10.1152/ajprenal.00396.2011. - DOI - PMC - PubMed
    1. Baines AD, de Rouffignac C, Deiss S. Functional heterogeneity of nephrons. II. Filtration rates, intraluminal flow velocities and fractional water reabsorption. Pflugers Arch 308: 260–276, 1969. doi:10.1007/BF00586558. - DOI - PubMed
    1. Bankir L, de Rouffignac C. Urinary concentrating ability: insights from comparative anatomy. Am J Physiol Regul Integr Comp Physiol 249: R643–R666, 1985. - PubMed
    1. Barratt LJ, Wallin JD, Rector FC Jr, Seldin DW. Influence of volume expansion on single-nephron filtration rate and plasma flow in the rat. Am J Physiol 224: 643–650, 1973. doi:10.1152/ajplegacy.1973.224.3.643. - DOI - PubMed

Publication types

LinkOut - more resources