. 2018 May 1;314(5):H895-H916.
doi: 10.1152/ajpheart.00477.2017. Epub 2017 Dec 22.

From ionic to cellular variability in human atrial myocytes: an integrative computational and experimental study

Affiliations

From ionic to cellular variability in human atrial myocytes: an integrative computational and experimental study

Anna Muszkiewicz et al. Am J Physiol Heart Circ Physiol. .

Abstract

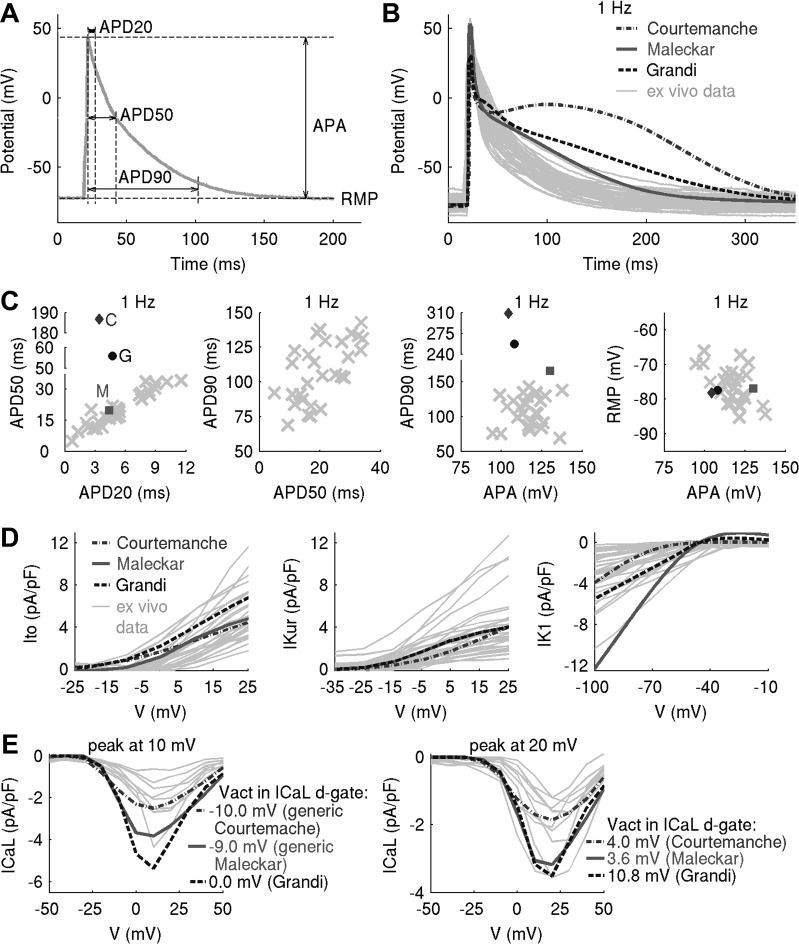
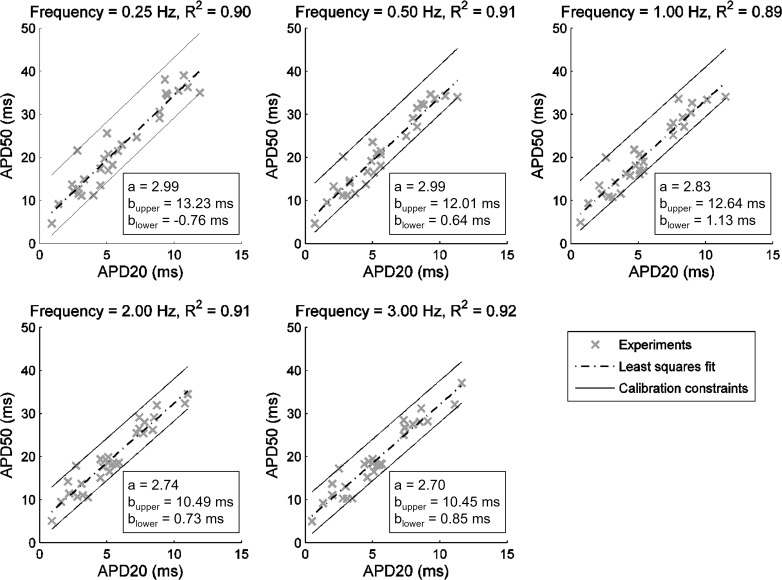
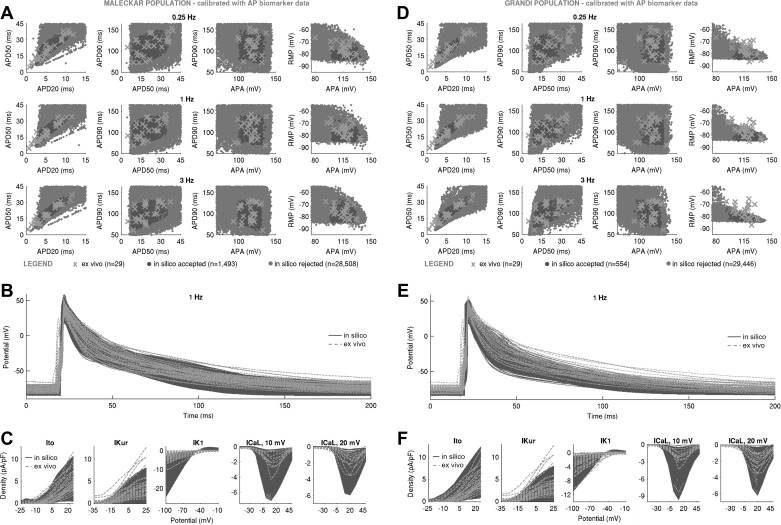
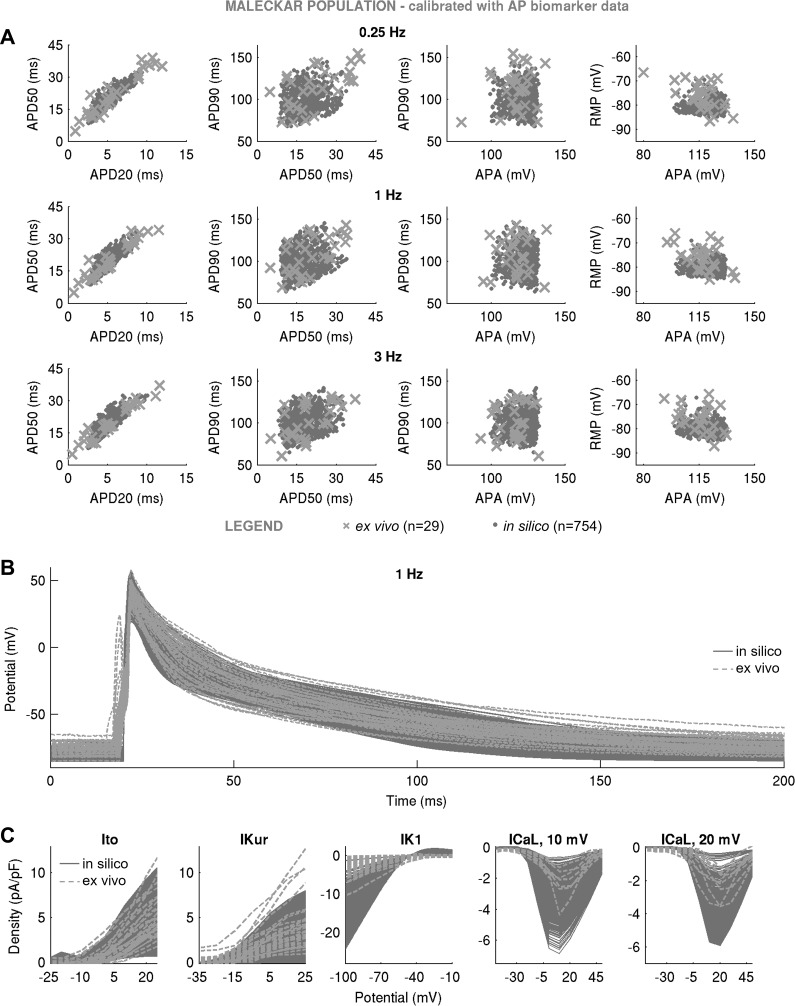
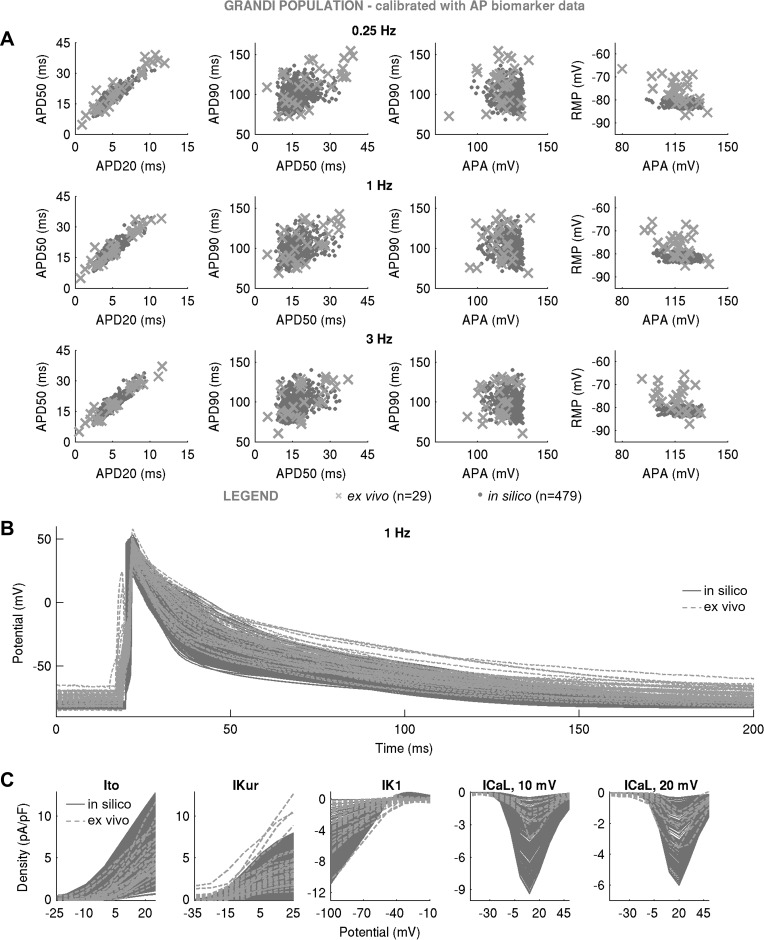
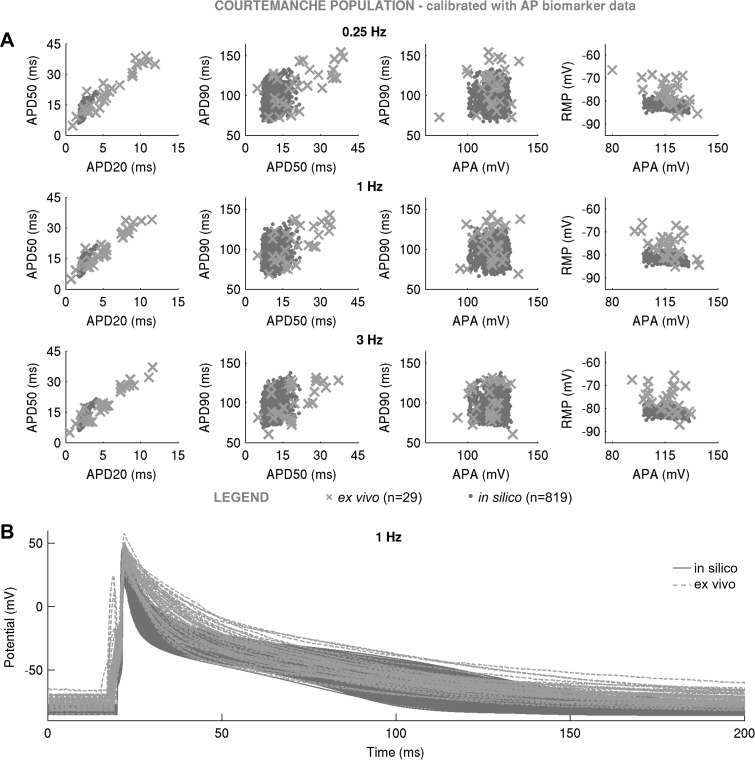
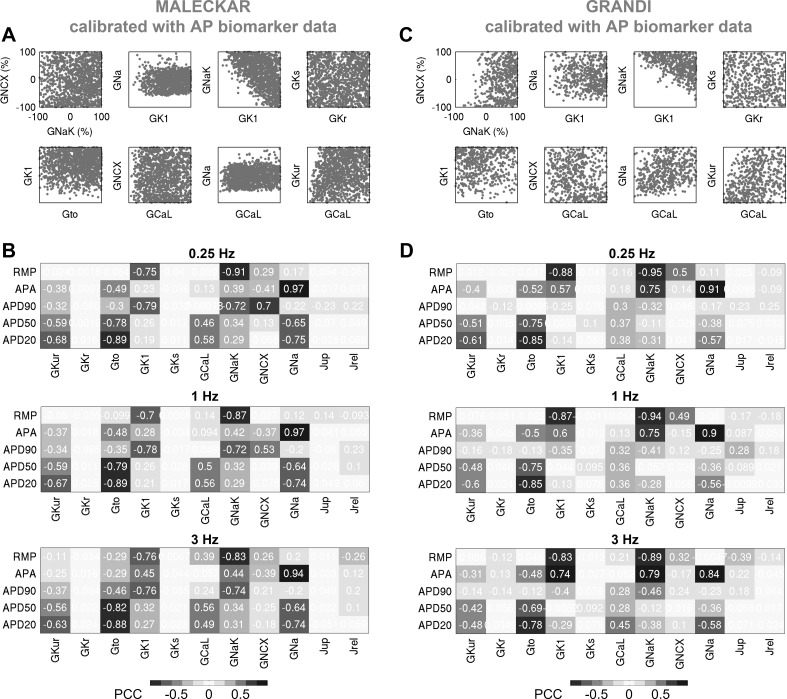
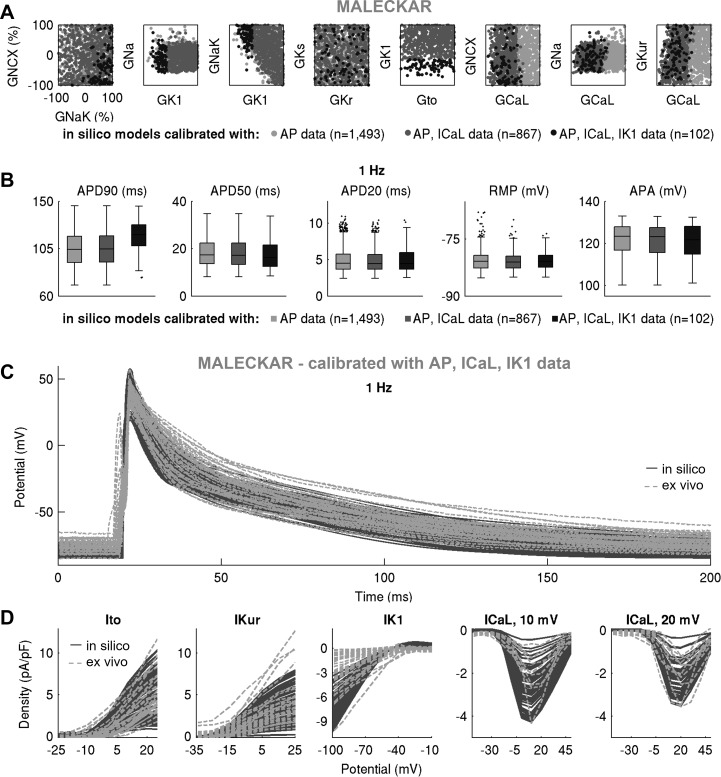
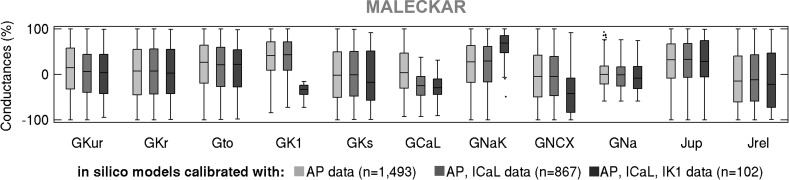
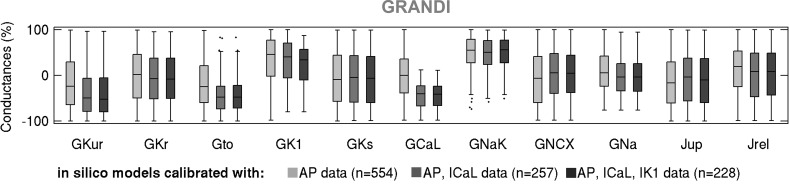
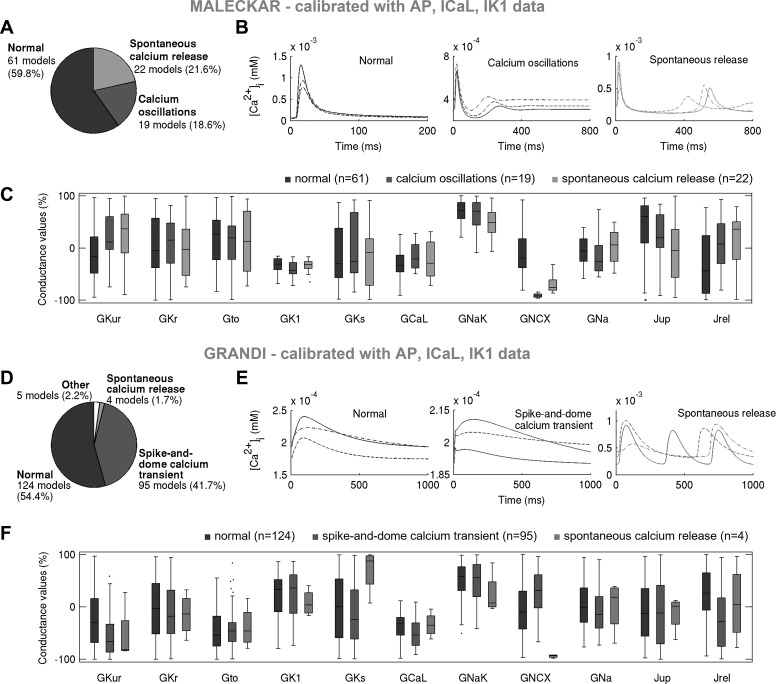
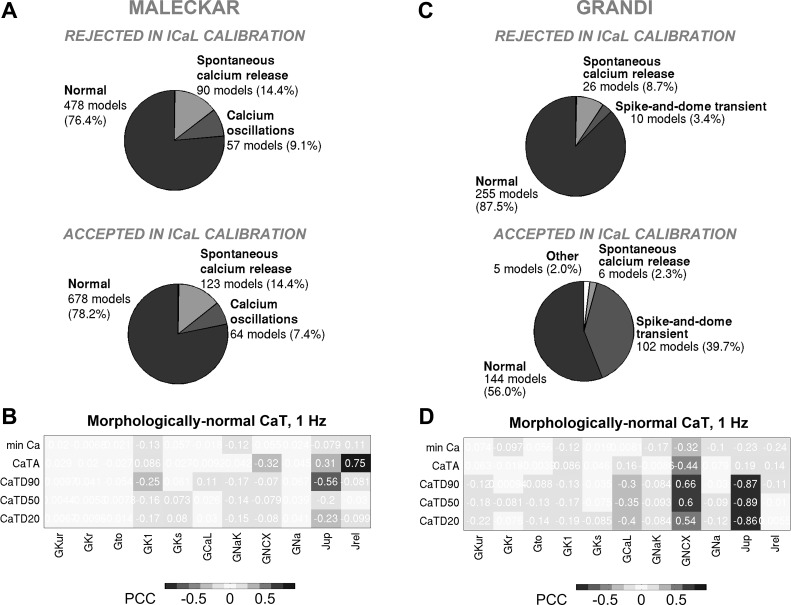
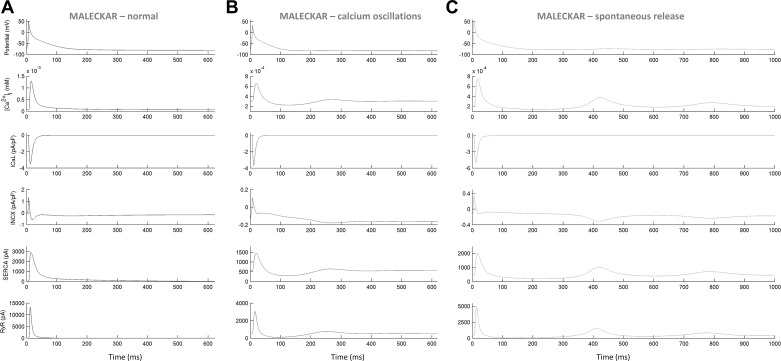
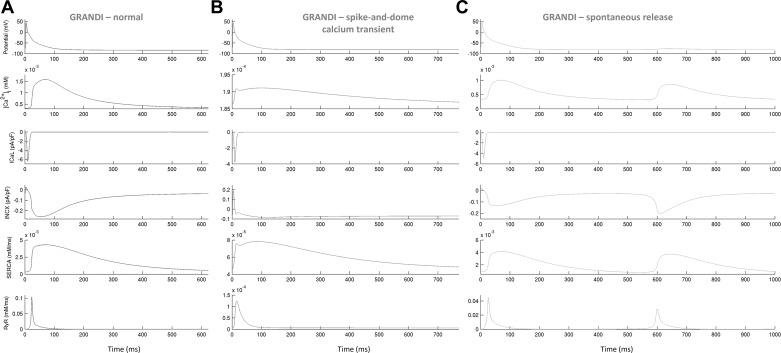
Variability refers to differences in physiological function between individuals, which may translate into different disease susceptibility and treatment efficacy. Experiments in human cardiomyocytes face wide variability and restricted tissue access; under these conditions, computational models are a useful complementary tool. We conducted a computational and experimental investigation in cardiomyocytes isolated from samples of the right atrial appendage of patients undergoing cardiac surgery to evaluate the impact of variability in action potentials (APs) and subcellular ionic densities on Ca2+ transient dynamics. Results showed that 1) variability in APs and ionic densities is large, even within an apparently homogenous patient cohort, and translates into ±100% variation in ionic conductances; 2) experimentally calibrated populations of models with wide variations in ionic densities yield APs overlapping with those obtained experimentally, even if AP characteristics of the original generic model differed significantly from experimental APs; 3) model calibration with AP recordings restricts the variability in ionic densities affecting upstroke and resting potential, but redundancy in repolarization currents admits substantial variability in ionic densities; and 4) model populations constrained with experimental APs and ionic densities exhibit three Ca2+ transient phenotypes, differing in intracellular Ca2+ handling and Na+/Ca2+ membrane extrusion. These findings advance our understanding of the impact of variability in human atrial electrophysiology. NEW & NOTEWORTHY Variability in human atrial electrophysiology is investigated by integrating for the first time cellular-level and ion channel recordings in computational electrophysiological models. Ion channel calibration restricts current densities but not cellular phenotypic variability. Reduced Na+/Ca2+ exchanger is identified as a primary mechanism underlying diastolic Ca2+ fluctuations in human atrial myocytes.

Keywords: action potential; population of models.


Figures

Fig. 1.
Fig. 1.
Experimental variability in action potential (AP) and current densities cannot be captured with a single in silico model of human atrial electrophysiology, motivating the use of a population-of-models approach. A: AP biomarkers used in this study. APD20, APD50, and APD90, AP duration at 20%, 50%, and 90% repolarization, respectively (in ms); RMP, resting membrane potential (in mV); APA, action potential amplitude (in mV); V, voltage. BE: outputs of generic Courtemanche, Maleckar, and Grandi models compared with experimental AP traces (B), AP biomarkers (C), and ionic current densities (D and E). In C, outputs of Courtemanche, Maleckar, and Grandi models are represented with a diamond, square, and circle, with ex vivo data plotted as crosses. E: two peaks in L-type Ca2+ current (ICaL) density were observed ex vivo. To capture these, modifications to half-potential of activation (Vact) of the ICaL d-gate were introduced to generic models (see Modifications to the generic models to capture two peaks in ICaL density in the appendix).
Fig. 2.
Fig. 2.
Linear relationship between action potential (AP) duration (APD) at 20% and 50% repolarization (APD20 and APD50) properties at five pacing frequencies ex vivo. Experimental data are shown as crosses, dashed-dotted lines are the least-squares fits to the data (corresponding R2 value given at the top of each plot), and solid black lines represent constraints corresponding to aAPD20 + bupper ≥ APD50aAPD20 + blower imposed on APD20 and APD50 properties generated by in silico models. The constant a was obtained from the least-squares fit, whereas blower and bupper were determined from the values of the outermost experimental data points.
Fig. 3.
Fig. 3.
Populations of models with a substantial variability in maximal conductances can yield action potential (AP) and ionic current characteristics overlapping with ex vivo data set even if generic model outputs are far away from experiment. AC: in silico AP biomarkers at 0.25, 1, and 3 Hz (A), full AP traces (B), and ionic current densities of transient outward K+ current (Ito), ultrarapid K+ current (IKur), inward rectifier (IK1), and L-type Ca2+ current (ICaL) (with peaks at 10 and 20 mV (C) in the Maleckar-based population of n = 1,493 models following calibration with AP biomarker data compared with ex vivo measurements. DF: analogous plots for the Grandi-based in silico population of n = 554 models. Both in silico populations were generated with Latin hypercube sampling. Throughout, in silico “accepted” models, meaning those models that fulfill experimental AP calibration constraints, are plotted in dark gray; A and D additionally show AP biomarkers of in silico “rejected” models in light gray. Ex vivo data are shown as crosses. RMP, resting membrane potential; APA, AP amplitude; APD20, APD50, and APD90, AP duration at 20%, 50%, and 90% repolarization.
Fig. 4.
Fig. 4.
In silico action potential (AP) biomarkers at 0.25, 1, and 3 Hz (A) and full AP traces in the Courtemanche-based population of n = 1,553 models (B) following calibration with AP biomarker data compared with ex vivo measurements. In silico population was generated with Latin hypercube sampling. In silico accepted models, i.e., those models that fulfill experimental AP calibration constraints, are plotted in dark gray; A additionally shows AP biomarkers of in silico rejected models in light gray. Ex vivo data are shown as crosses.
Fig. 5.
Fig. 5.
In silico action potential (AP) biomarkers at 0.25, 1, and 3 Hz (A), full AP traces (B), and ionic current densities (C) of transient outward K+ current (Ito), atrial-specific ultrarapid K+ current (IKur), inward rectifier K+ current (IK1), and L-type Ca2+ current (ICaL) (with peaks at 10 and 20 mV) in the Maleckar-based population of n = 754 models following calibration with AP biomarker data compared with ex vivo measurements. The in silico population was generated with sequential Monte Carlo. In silico accepted models, i.e., those models that fulfill experimental AP calibration constraints, are plotted in gray dots, whereas ex vivo data are shown as crosses.
Fig. 6.
Fig. 6.
In silico action potential (AP) biomarkers at 0.25, 1, and 3 Hz (A), full AP traces (B), and ionic current densities (C) of transient outward K+ current (Ito), atrial-specific ultrarapid K+ current (IKur), inward rectifier K+ current (IK1), and L-type Ca2+ current (ICaL) (with peaks at 10 and 20 mV) in the Grandi-based population of n = 479 models following calibration with AP biomarker data compared with ex vivo measurements. In silico population was generated with sequential Monte Carlo. In silico accepted models, i.e., those models that fulfill experimental AP calibration constraints, are plotted in light gray, whereas ex vivo data are shown as crosses.
Fig. 7.
Fig. 7.
In silico action potential (AP) biomarkers at 0.25, 1, and 3 Hz (A) and full AP traces (B) in the Courtemanche-based population of n = 819 models following calibration with AP biomarker data compared with ex vivo measurements. In silico population was generated with sequential Monte Carlo. In silico accepted models, i.e., those models that fulfill experimental AP calibration constraints, are plotted as light gray, whereas ex vivo data are shown as crosses.
Fig. 8.
Fig. 8.
Calibration with action potential (AP) data constrains currents affecting upstroke and resting potential, but current redundancy during repolarization allows wide ranges of variability in currents impacting AP duration (APD). A and B: selected pairwise plots of maximal conductances (A) and partial correlation coefficients (PCCs) between AP biomarkers and maximal conductances (B), computed at 0.25, 1, and 3 Hz, for the Maleckar-based population. C and D: analogous results for the Grandi-based population. In B and D, positive (+) and negative (−) correlations are highlighted.
Fig. 9.
Fig. 9.
Further calibration with ionic currents active during repolarization constrains current density but not cellular phenotypic variability in action potential (AP). A and B: pairwise scatter plots of maximal conductances (A) and AP biomarkers (B) in the populations calibrated with AP, AP + L-type Ca2+ current (ICaL), and AP + ICaL + inward rectifier K+ current (IK1) ex vivo data in the Maleckar-based in silico population, plotted in light gray, dark gray, and black, respectively. C and D: AP traces (C) and ionic current densities (D) in the Maleckar-based population of n = 102 models calibrated with AP and voltage-clamp recordings, shown in dark gray, compared with ex vivo data in light gray.
Fig. 10.
Fig. 10.
Further calibration with ionic currents active during repolarization constrains current density but not cellular phenotypic variability in action potential (AP). A and B: pairwise scatterplots of maximal conductances (A) and AP biomarkers (B) in the populations calibrated with AP, AP + L-type Ca2+ current (ICaL), and AP + ICaL + inward rectifier K+ current (IK1) ex vivo data in the Grandi-based in silico population, plotted in light gray, dark gray, and black, respectively. C and D: AP traces (C) and ionic current densities (D) in the Maleckar-based population of n = 228 models calibrated with AP and voltage-clamp recordings, shown in dark gray, compared with ex vivo data in light gray.
Fig. 11.
Fig. 11.
Box plots of maximal current conductances in the Maleckar-based in silico population of models following calibration with AP, AP + ICaL, and AP + ICaL + IK1 data, shown in light gray, dark gray, and black, respectively. Black dots indicate outliers.
Fig. 12.
Fig. 12.
Box plots of maximal current conductances in the Grandi-based in silico population of models following calibration with action potential (AP), AP + L-type Ca2+ current (ICaL), and AP + ICaL + inward rectifier K+ current (IK1) data, shown in light gray, dark gray, and black, respectively. Black dots indicate outliers.
Fig. 13.
Fig. 13.
Low Na+/Ca2+ exchanger current (INCX) promotes fluctuations in diastolic Ca2+ concentration in both in silico populations, whereas high Na+/Ca2+ exchanger conductance (GNCX) and low release current (Jrel) correlate with the presence of a spike-and-dome Ca2+ transient (CaT) in the Grandi-based population only. AC: proportions of models and examples exhibiting distinct CaT morphologies in the Maleckar population calibrated with action potential (AP) + L-type Ca2+ current (ICaL) + inward rectifier K+ current (IK1) data and parameters underpinning the three CaT phenotypes (C). DF: showcase analogous results for the Grandi-based population following AP + ICaL + IK1 calibration. In AC, morphologically normal CaTs, Ca2+ oscillations in diastole, and spontaneous Ca2+ release phenotypes are plotted in black, dark gray, and light gray, respectively. In DF, morphologically normal CaTs, spike-and-dome CaTs, and spontaneous Ca2+ release models are shown in black, dark gray, and light gray, respectively. Ca2+ oscillations and spontaneous Ca2+ release are referred to as fluctuations in diastolic Ca2+.
Fig. 14.
Fig. 14.
Calibration with L-type Ca2+ current (ICaL) density does not impact proportions of models with distinct Ca2+ transient (CaT) phenotypes in the Maleckar population but promotes spike-and-dome CaT morphology in Grandi-based models; key determinants of morphologically normal CaTs are Na+/Ca2+ exchanger current (INCX) and sarcoplasmic reticulum release/uptake currents. A and B: prevalence of distinct CaT morphologies in the models rejected (top) and accepted (bottom) in the ICaL calibration step (A) and partial correlation coefficients (PCCs) between maximal conductances and CaT biomarkers in the Maleckar population following ICaL calibration (B). C and D: analogous plots for the Grandi-based population. min Ca, diastolic Ca2+ concentration; CaTA, CaT amplitude; CaTDxx, CaT duration at xx% relaxation. Positive (+) and negative (−) correlations are highlighted.
Fig. 15.
Fig. 15.
Ionic processes underpinning morphologically normal Ca2+ transients (A), oscillations in diastolic Ca2+ (B), and spontaneous Ca2+ release during diastole (C) in selected Maleckar-based in silico models. In B and C, fluctuations in diastolic Ca2+ are preceded by Ca2+ release from the sarcoplasim reticulum [ryanodine receptor (RyR), bottom].
Fig. 16.
Fig. 16.
Ionic processes underpinning the morphologically normal Ca2+ transient (CaT; A), spike-and-dome CaT (B), and spontaneous Ca2+ release (C) during diastole in selected Grandi-based in silico models. In B, the spike in CaT coincides with a prominent notch in the forward-mode Na+/Ca2+ exchanger current (INCX); weak Ca2+ release from the sarcoplasim reticulum can be seen [ryanodine receptor (RyR), bottom]. In C, fluctuations in diastolic Ca2+ are preceded by Ca2+ release from the sarcoplasim reticulum.

References

    1. Abi-Gerges N, Philp K, Pollard C, Wakefield I, Hammond TG, Valentin J-P. Sex differences in ventricular repolarization: from cardiac electrophysiology to Torsades de Pointes. Fundam Clin Pharmacol 18: 139–151, 2004. doi:10.1111/j.1472-8206.2004.00230.x. - DOI - PubMed
    1. Abi-Gerges N, Small BG, Lawrence CL, Hammond TG, Valentin J-P, Pollard CE. Gender differences in the slow delayed (IKs) but not in inward (IK1) rectifier K+ currents of canine Purkinje fibre cardiac action potential: key roles for IKs, beta-adrenoceptor stimulation, pacing rate and gender. Br J Pharmacol 147: 653–660, 2006. doi:10.1038/sj.bjp.0706491. - DOI - PMC - PubMed
    1. Bosch RF, Zeng X, Grammer JB, Popovic K, Mewis C, Kühlkamp V. Ionic mechanisms of electrical remodeling in human atrial fibrillation. Cardiovasc Res 44: 121–131, 1999. doi:10.1016/S0008-6363(99)00178-9. - DOI - PubMed
    1. Britton OJ, Bueno-Orovio A, Van Ammel K, Lu HR, Towart R, Gallacher DJ, Rodriguez B. Experimentally calibrated population of models predicts and explains intersubject variability in cardiac cellular electrophysiology. Proc Natl Acad Sci USA 110: E2098–E2105, 2013. doi:10.1073/pnas.1304382110. - DOI - PMC - PubMed
    1. Carusi A, Burrage K, Rodríguez B. Bridging experiments, models and simulations: an integrative approach to validation in computational cardiac electrophysiology. Am J Physiol Heart Circ Physiol 303: H144–H155, 2012. doi:10.1152/ajpheart.01151.2011. - DOI - PubMed

Substances

LinkOut - more resources