

Screen Targeting Lung and Prostate Cancer Oncogene Identifies Novel Inhibitors of RGS17 and Problematic Chemical Substructures
- PMID: 29351497
- PMCID: PMC6342279
- DOI: 10.1177/2472555217752301
Screen Targeting Lung and Prostate Cancer Oncogene Identifies Novel Inhibitors of RGS17 and Problematic Chemical Substructures
Abstract
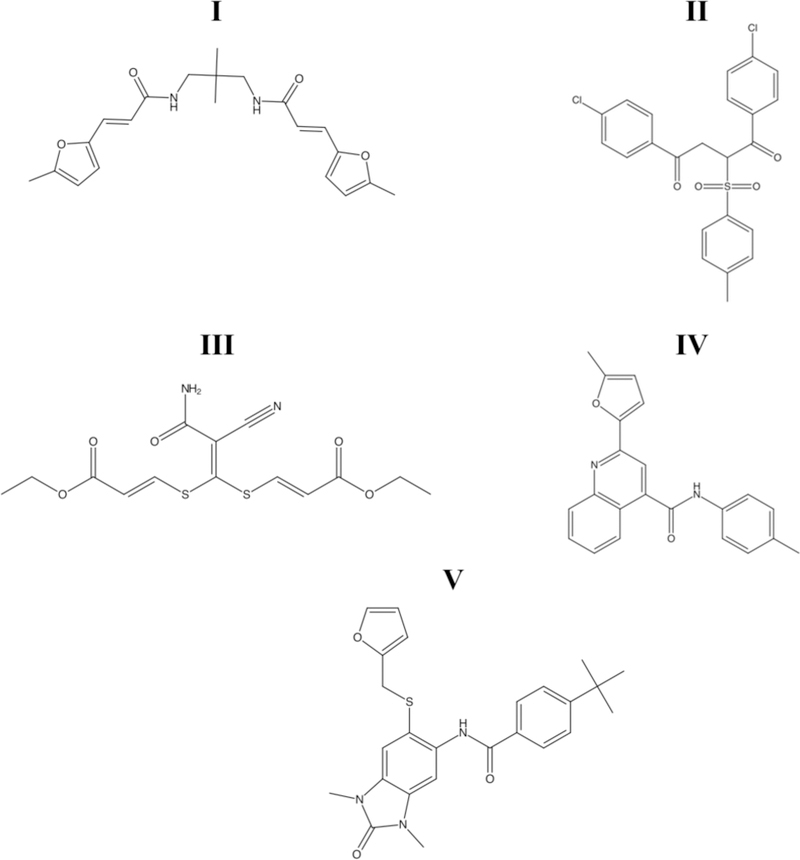
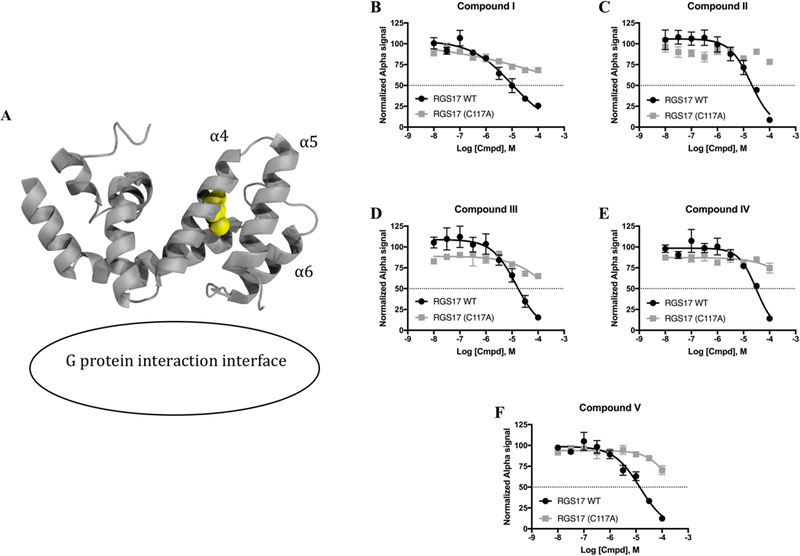
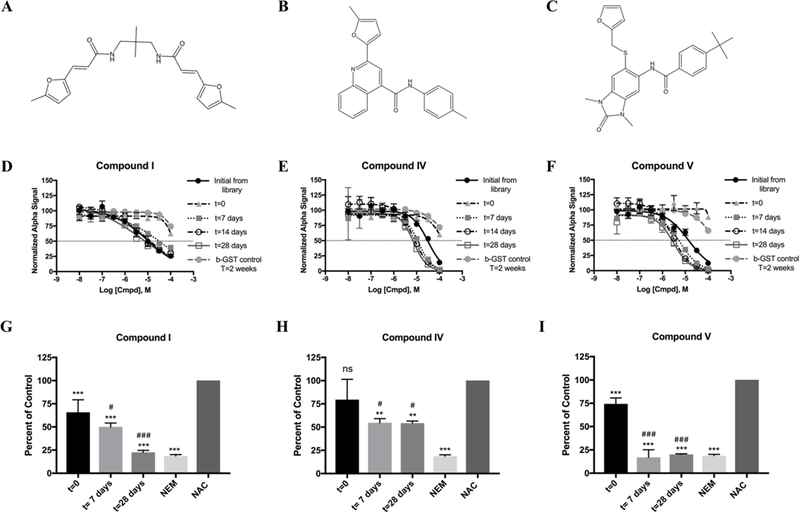
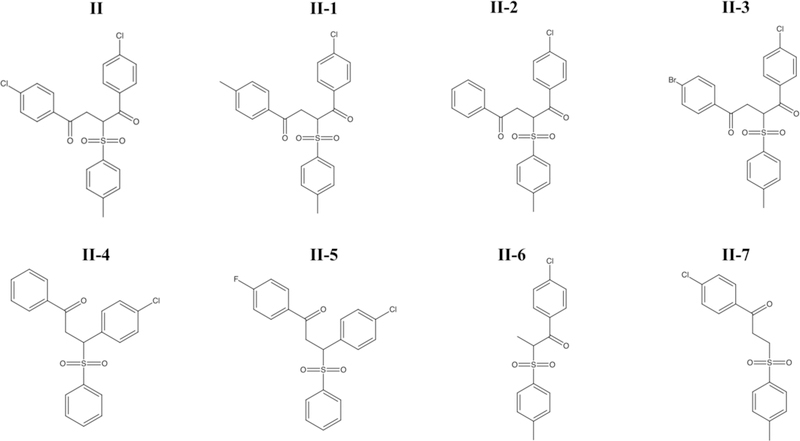
Regulator of G protein signaling (RGS) proteins temporally regulate heterotrimeric G protein signaling cascades elicited by G protein-coupled receptor activation and thus are essential for cell homeostasis. The dysregulation of RGS protein expression has been linked to several pathologies, spurring discovery efforts to identify small-molecule inhibitors of these proteins. Presented here are the results of a high-throughput screening (HTS) campaign targeting RGS17, an RGS protein reported to be inappropriately upregulated in several cancers. A screen of over 60,000 small molecules led to the identification of five hit compounds that inhibit the RGS17-Gαo protein-protein interaction. Chemical and biochemical characterization demonstrated that three of these hits inhibited the interaction through the decomposition of parent compound into reactive products under normal chemical library storage/usage conditions. Compound substructures susceptible to decomposition are reported and the decomposition process characterized, adding to the armamentarium of tools available to the screening field, allowing for the conservation of resources in follow-up efforts and more efficient identification of potentially decomposed compounds. Finally, analogues of one hit compound were tested, and the results establish the first ever structure-activity relationship (SAR) profile for a small-molecule inhibitor of RGS17.
Keywords: AlphaScreen; RGS proteins; SAR; compound decomposition; high-throughput screening.
Conflict of interest statement
Conflicts of Interest:
The authors disclose no potential conflicts of interest.
Figures

Similar articles
-
Development of a novel high-throughput screen and identification of small-molecule inhibitors of the Gα-RGS17 protein-protein interaction using AlphaScreen.J Biomol Screen. 2011 Sep;16(8):869-77. doi: 10.1177/1087057111410427. Epub 2011 Jun 16. J Biomol Screen. 2011. PMID: 21680864 Free PMC article.
-
RGS17: an emerging therapeutic target for lung and prostate cancers.Future Med Chem. 2013 Jun;5(9):995-1007. doi: 10.4155/fmc.13.91. Future Med Chem. 2013. PMID: 23734683 Free PMC article.
-
Regulator of G Protein Signaling 17 as a Negative Modulator of GPCR Signaling in Multiple Human Cancers.AAPS J. 2016 May;18(3):550-9. doi: 10.1208/s12248-016-9894-1. Epub 2016 Feb 29. AAPS J. 2016. PMID: 26928451 Free PMC article. Review.
-
Fragment-Based Nuclear Magnetic Resonance Screen against a Regulator of G Protein Signaling Identifies a Binding "Hot Spot".Chembiochem. 2021 May 4;22(9):1609-1620. doi: 10.1002/cbic.202000740. Epub 2021 Feb 16. Chembiochem. 2021. PMID: 33480159 Free PMC article.
-
Identification of ligands targeting RGS proteins high-throughput screening and therapeutic potential.Prog Mol Biol Transl Sci. 2009;86:335-56. doi: 10.1016/S1877-1173(09)86011-0. Epub 2009 Oct 7. Prog Mol Biol Transl Sci. 2009. PMID: 20374721 Review.
Cited by
-
Regulator of G-protein signaling (RGS) proteins as drug targets: Progress and future potentials.J Biol Chem. 2019 Dec 6;294(49):18571-18585. doi: 10.1074/jbc.REV119.007060. Epub 2019 Oct 21. J Biol Chem. 2019. PMID: 31636120 Free PMC article. Review.
-
RGS proteins and their roles in cancer: friend or foe?Cancer Cell Int. 2023 Apr 28;23(1):81. doi: 10.1186/s12935-023-02932-8. Cancer Cell Int. 2023. PMID: 37118788 Free PMC article. Review.
References
-
- Marinissen MJ; Gutkind JS, G-protein-coupled receptors and signaling networks: emerging paradigms. Trends Pharmacol. Sci 2001, 22, 368–376. - PubMed
-
- Pierce KL; Lefkowitz RJ, Classical and new roles of beta-arrestins in the regulation of G-protein-coupled receptors. Nat. Rev. Neurosci 2001, 2, 727–733. - PubMed
-
- Gilman AG, G proteins: transducers of receptor-generated signals. Annu. Rev. Biochem 1987, 56, 615–649. - PubMed
-
- Freissmuth M; Casey PJ; Gilman AG, G proteins control diverse pathways of transmembrane signaling. FASEB J 1989, 3, 2125–2131. - PubMed
Publication types
MeSH terms
Substances
Grants and funding
LinkOut - more resources
Full Text Sources
Other Literature Sources
Medical
Molecular Biology Databases
Miscellaneous
