

Review
doi: 10.1152/physrev.00042.2016.
Physiology of Astroglia
Affiliations
- PMID: 29351512
- PMCID: PMC6050349
- DOI: 10.1152/physrev.00042.2016
Item in Clipboard
Review
Physiology of Astroglia
Physiol Rev.
.
Abstract
Astrocytes are neural cells of ectodermal, neuroepithelial origin that provide for homeostasis and defense of the central nervous system (CNS). Astrocytes are highly heterogeneous in morphological appearance; they express a multitude of receptors, channels, and membrane transporters. This complement underlies their remarkable adaptive plasticity that defines the functional maintenance of the CNS in development and aging. Astrocytes are tightly integrated into neural networks and act within the context of neural tissue; astrocytes control homeostasis of the CNS at all levels of organization from molecular to the whole organ.
Figures
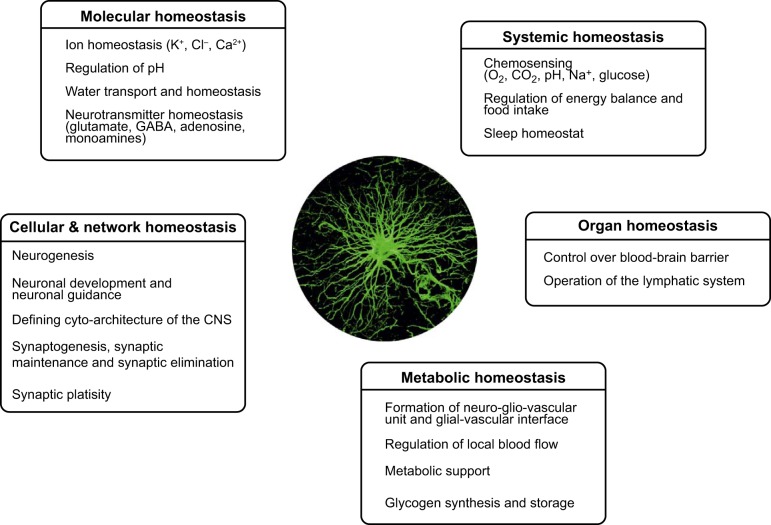
Homeostatic functions of astroglia.
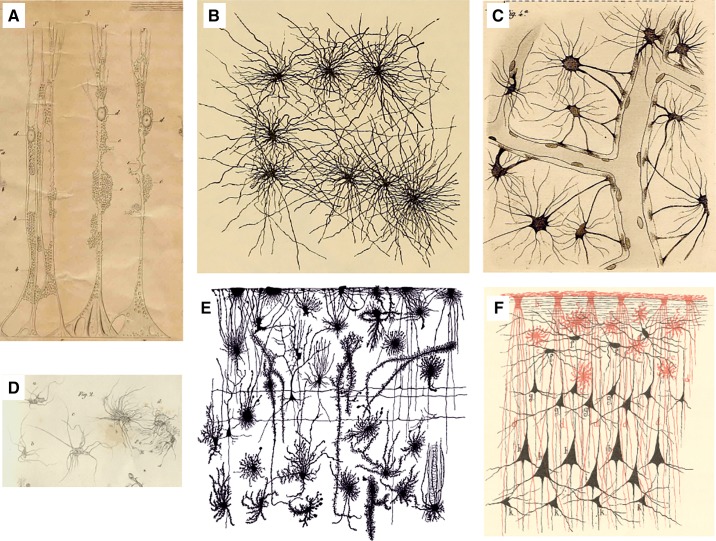
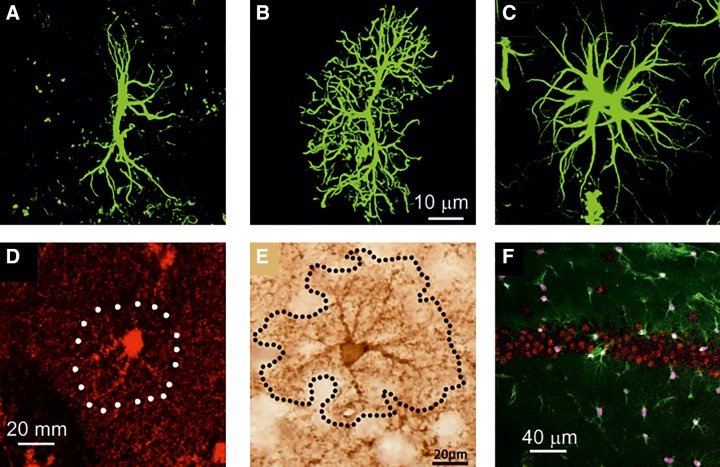
Historic images of astrocytes. A: Müller glial cell of the sheep retina drawn by Max Schulze using a microscope from Amici. y, Brushlike fibrils extending from the outer Müller fiber in the outer granular layer; x, internal limiting membrane; a, opening in the limiting membrane; b, very delicate network of fenestrated membranes similar in the ganglion cell layer; c, network in the so-called molecular layer; d, nuclei as part of the Müller fibers; ee, cavity in which the nuclei or the cells of the internal granular layer are located. [From Schulze (1579). Image has been kindly provided by Prof. Helmut Kettenmann, Max Delbruck Centre for Molecular Medicine, Berlin.] B: cortical astrocytes drawn by Albert von Kolliker (894). C: Camillo Golgi’s drawings of astrocytes contacting blood vessels (583). D: the “Spinnenzellen” of Moritz Jastrowitz (787). E: morphological diversity of neuroglia in human fetal cortex (1458). F: close interactions between neuroglial (red; both interlaminar and protoplasmic astrocytes are clearly presented) and neuronal (black) networks in human brain. [From Schleich (1565).]
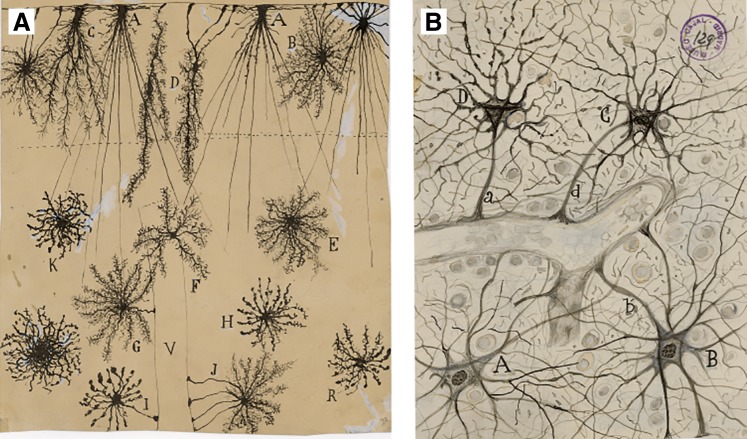
Images of astroglia drawn by Santiago Ramon y Cajal. A: Golgi impregnated glia from human cortex (2-mo-old child) in the plexiform layer (A–D), second and third layers (E–H and K, R, respectively), and perivascular glia (I and J). V, blood vessel. B: perivascular astrocytes. [These images are part of the collection of the Cajal Legacy at the Cajal Institute of the Spanish Research Council (CSIC), Madrid, Spain. Images have been kindly provided by Professor Ricardo Martínez Murillo.]
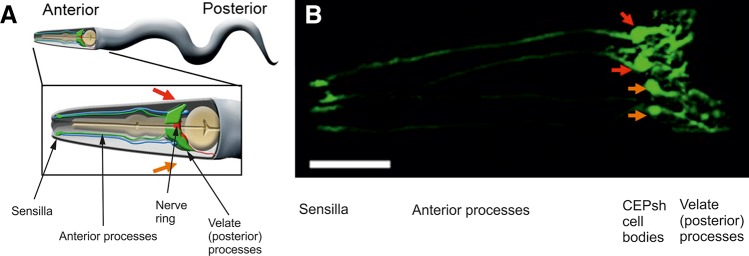
Proto-astrocytes (cephalic sheath, or CEPsh glial cells) of roundworm C. elegans. A: a cartoon of an adult worm showing the four CEPsh glial cells (green) positioned in the anterior of the worm (inset). The CEPsh cell bodies with their velate processes are positioned around the central nerve ring (red), which they enwrap along with the proximal section of the ventral nerve cord. Additionally, each CEPsh glial cell possesses a long anterior process, projecting to the anterior sensory tip, which closely interacts with the dendritic extension of a nearby cephalic neuron (blue). Arrows indicate the dorsal (red arrow) and ventral (orange arrow) side of the worm. B: a confocal image showing green fluorescent protein expression driven by the hlh-17 promoter to visualize the four CEPsh glial cells (worm strain VPR839). The anterior (head) of a juvenile (larval stage 4) worm is shown; the worm is turned ~45 degrees from “upright” such that all four CEP sheath cells are visible. The sheath portion of the cells that form a tube around the dendritic endings of the CEP neurons are seen at the left of the image. The dorsal (red arrow) and ventral (orange arrow) CEPsh cell bodies are seen. The thin sheetlike extensions that surround and invade the nerve ring are seen in the rightmost part of the image. Scale bar, 20 µm. [From Stout et al. (1683).]
Visualization of rodent astrocytes with immunostaining against canonic markers GFAP, S100B, and glutamine synthetase. A–C: GFAP-stained astrocytes in entorhinal cortex (A), prefrontal cortex (B), and CA1 area of hippocampus (C). [A–C from Rodriguez et al. (1483). Reprinted with permission from Eureka Science Ltd.] D: astrocyte stained with antibody against S100B in the dentate gyrus of hippocampus. E: hippocampal astrcytes stained with anti-glutamine synthetase antibody. [D and E from Rodriguez-Arellano et al. (1480), with permission from Elsevier; and Rodriguez et al. (1486), with permission from Elsevier.] F: cortical tissue preparation with astrocytes labeled in green (EGFP expressed under EAAT2 promoter), astroglial nuclei labeled in pink were stained with antibodies against SOX9, and neurons (in red) were stained with antibodies against NeuroN. (From Sun and Nedergaard, unpublished observation.)
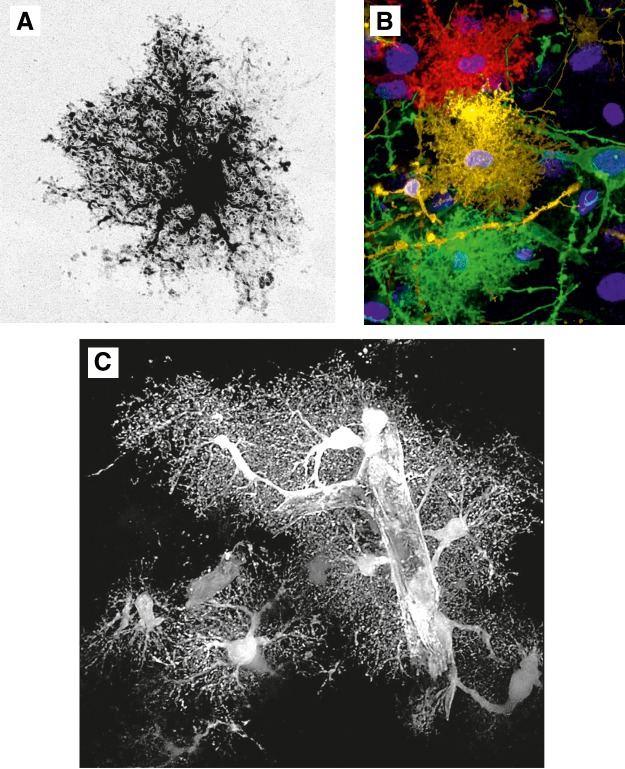
Protoplasmic astrocytes. A: cortical protoplasmic astrocytes filled/injected with fluorescent dye. [Image courtesy of Prof. Milos Pekny and Dr. Ulrika Wilhelmsson (University of Göteborg).] B: protoplasmic astrocytes diolistically labeled with spectrally distinct probes. C: the EGFP-expressing cortical protoplasmic astrocytes with endfeet plastering the blood vessel.
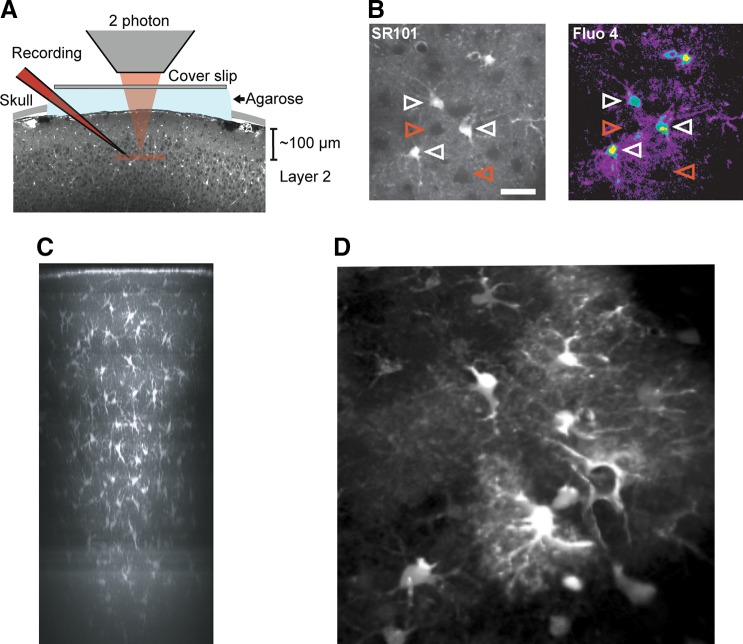
Two photon imaging of astrocytes in vivo. A: experimental setup. Exposed somatosensory cortex was loaded with the specific astrocyte marker sulforhodamine 101 (SR101) and Ca2+ indicator fluo 4-AM. Coverslip and 1% agarose were mounted on top of cranial window to minimize brain pulsation. Recording electrode was loaded with Texas red-dextran (red) and inserted into cortical layer 2 (100–150 μm below pial surface). B: example images showing cortical layer 2 astrocytes double labeled with SR101 and Fluo 4-AM. Only SR101-positive astrocytes also labeled with Fluo 4-AM (white arrowhead). Neurons appeared as dark round shape area (red arrowhead). Scale bar, 30 μm. [A and B from Tian et al. (1750).] C: overview side projection of an SR101-stained area (revealing astrocytes) in mouse neocortex ~30 min after dye application. The image is a maximum-intensity side-projection from a stack of fluorescence images taken through cranial window on an anesthetized mouse. [C from Nimmerjahn et al. (1224). Reprinted by permission from Macmillan Publishers Inc.] D: cortical astrocytes loaded with SR101 and imaged (using two photon confocal system) through the cranial window on an anesthetized mouse. (Image kindly provided by Dr. Hajime Hirose, RIKEN, Japan.)
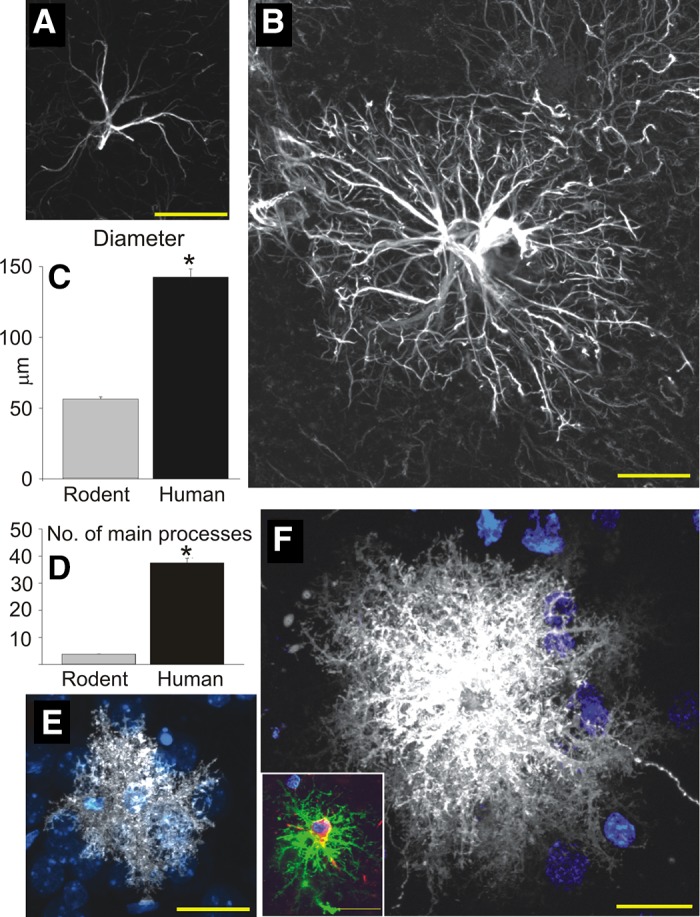
Comparison of rodent and human protoplasmic astrocytes. A: typical mouse protoplasmic astrocyte. GFAP, white. Scale bar, 20 μm. B: typical human protoplasmic astrocyte in the same scale. Scale bar, 20 μm. C and D: human protoplasmic astrocytes are 2.55-fold larger and have 10-fold more main GFAP processes than mouse astrocytes (human, n = 50 cells from 7 patients; mouse, n = 65 cells from 6 mice; means ± SE; *P < 0.005, t-test). E: mouse protoplasmic astrocyte diolistically labeled with DiI (white) and sytox (blue) revealing the full structure of the astrocyte including its numerous fine processes. Scale bar, 20 μm. F: human astrocyte diolistically labeled demonstrates the highly complicated network of fine process that defines the human protoplasmic astrocyte. Scale bar, 20 μm. Inset: human protoplasmic astrocyte diolistically labeled as well as immunolabelled for GFAP (green) demonstrating colocalization. Scale bar, 20 μm. [From Oberheim et al. (1248).]
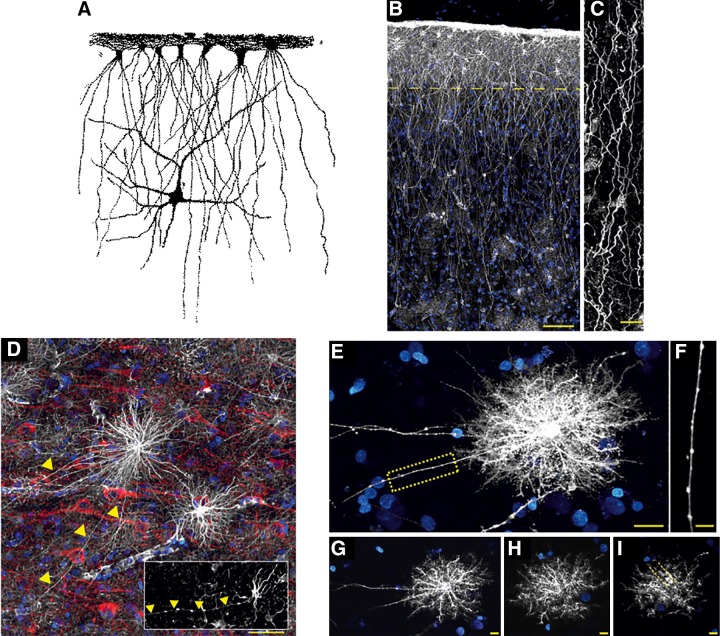
Interlaminar and varicose projection astrocytes in human cortex. A: interlaminar astrocytes as seen by William Lloyd Andriezen (44). B: pial surface and layers 1–2 of human cortex. GFAP staining is in white; DAPI is in blue. Scale bar, 100 μm. Yellow line indicates border between layer 1 and 2. C: interlaminar astrocyte processes. Scale bar, 10 μm. [B and C from Oberheim et al. (1247), with permission of Springer.] D: varicose projection astrocytes reside in layers 5–6 and extend long processes characterized by evenly spaced varicosities. Inset: varicose projection astrocyte from chimpanzee cortex. GFAP, white; MAP2, red; DAPI, blue. Yellow arrowheads indicate varicose projections. Scale bar, 50 μm. E: diolistic labeling (white) of a varicose projection astrocyte whose long process terminates in the neuropil. Sytox, blue. Scale bar, 20 μm. F: high-power image of the yellow box in B, highlighting the varicosities seen along the processes. Scale bar, 10 μm. G–I: individual z-sections of the astrocyte in E, demonstrating long processes, straighter fine processes, and association with the vasculature. [D–I from Oberheim et al. (1248).]
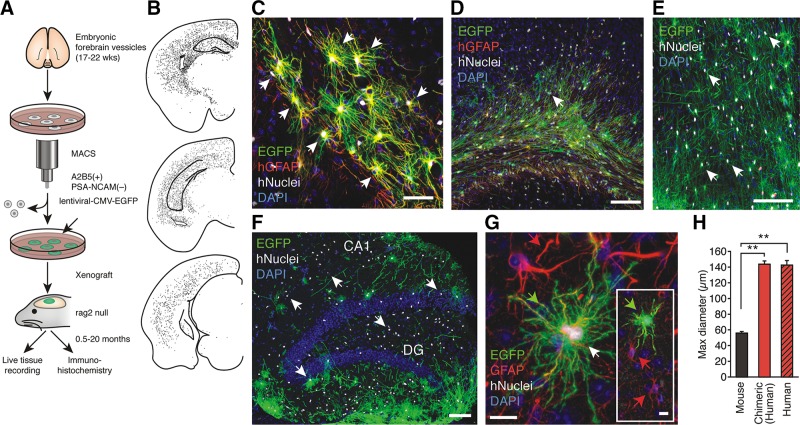
Human astrocytes replace host glia in mice engrafted with human glial progenitors. A: schematic outlining the procedure for magnetic cell sort-based isolation (MACS) of human glial progenitors, tagging with EGFP and xenografting at P1. The chimeric mice brains were analyzed in 0.5- to 20-mo-old chimeric mice. B: representative dot map showing the distribution of human nuclear antigen (hNuclei)+ cells in 3 coronal sections from a 10-mo-old human chimeric mouse. C: the complex fine structure of human astrocytes in chimeric brain replicates the classical star-shaped appearance of human astrocytes labeled with hGFAP in situ. Most cells in the field are EGFP+/hNuclei+/hGFAP+ (hGFAP, red). D: at 5 mo, EGFP+ cells typically infiltrated corpus callosum and cortical layers V and VI. All EGFP+ cells labeled with an antibody directed against human nuclear antigen (hNuclei) and most of the human cells were also labeled with an antibody directed against human GFAP (hGFAP, red). E: at 11 mo, many areas of cortex were infiltrated by evenly distributed EGFP+ /hNuclei+ cells. F: the hippocampus was also populated with EGFP+/hNuclei+ cells in a 14-mo-old animal, with the highest density in the dentate. G: human EGFP+/hNuclei+/GFAP+ cells (green arrow) were significantly larger than host murine astrocytes (red arrow). The anti-GFAP antibody cross-reacted with both human and mouse GFAP (red). Inset shows same field in lower magnification. H: histogram compares the diameter of mouse cortical astrocytes to human cortical astrocytes in situ (freshly resected surgical samples) and xenografted human astrocytes in cortex of chimeric mouse brain. The maximal diameter of mouse and human astrocytes (in situ and in chimeric mice) was determined in sections stained with an anti-GFAP antibody that labels both human and mouse GFAP. In B–F, n = 50–65; **P < 0.01, Bonferroni t-test. EGFP, green; hNuclei, white and white arrow; DAPI, blue. Scale bars: 50 μm (C); 100 μm (D–F); 10 μm (G). Data graphed as means ± SE. [From Han et al. (637).]
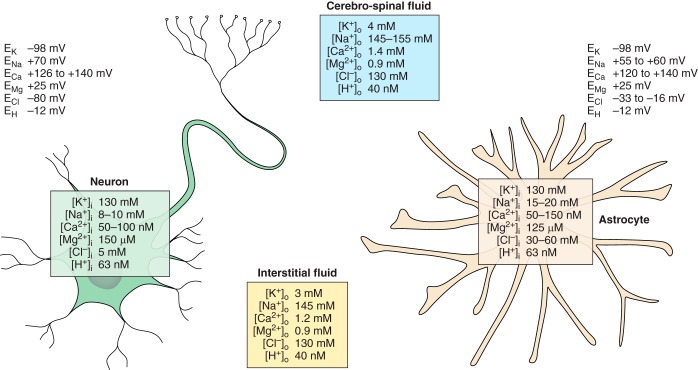
Ion distribution and corresponding values of equilibrium potentials for different ions between the cerebrospinal fluid, interstitial space, and cytoplasm of astrocytes and neurons.
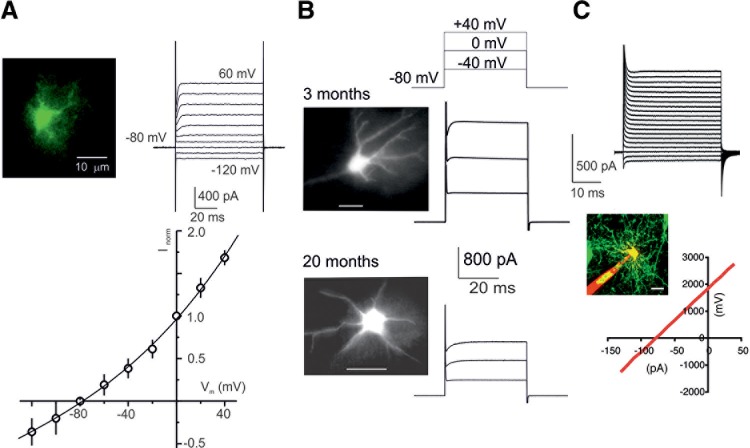
Passive membrane properties of astrocytes. A: voltage-clamp recordings from astrocytes freshly isolated from the cortex of transgenic mice expressing EGFP under control of the GFAP promoter. Astrocytes were identified by specific fluorescence; whole-cell currents were recorded in response to hyperpolarizing and depolarizing steps from −120 to +60 mV (step interval, 20 mV). To construct the current-voltage relationship, amplitudes of currents were normalized to the value measured at 0 mV; every point is mean ± SD for 20 cells. [From Lalo et al. (935).] B: voltage-clamp recordings from astrocytes in acute slices obtained from 3- and 20-mo-old GFAP-EGFP mice; astrocytes were identified by fluorescence. [From Lalo et al. (932).] C: voltage-clamp recordings from human astrocytes grafted into mouse brain. [From Han et al. (637).]
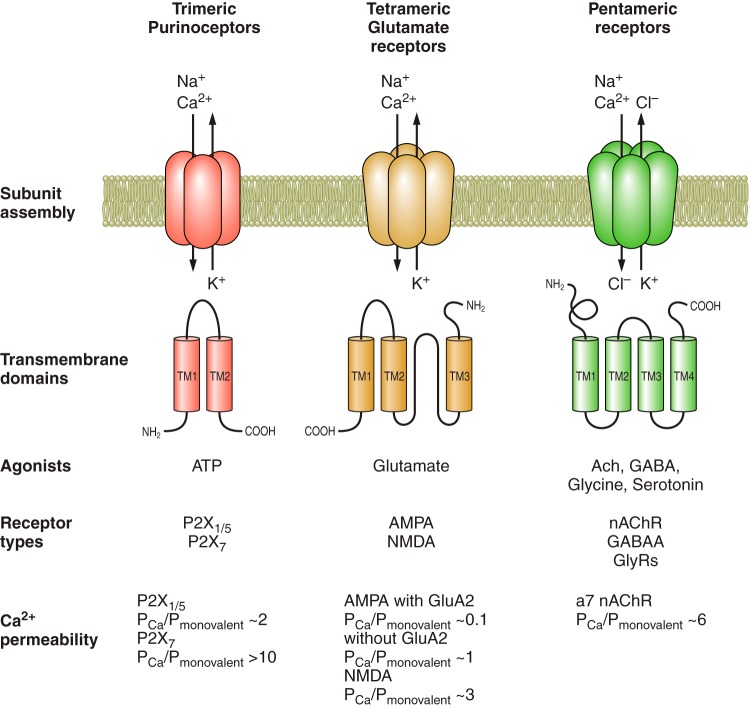
Main properties of ionotropic receptors functionally expressed in astroglia.
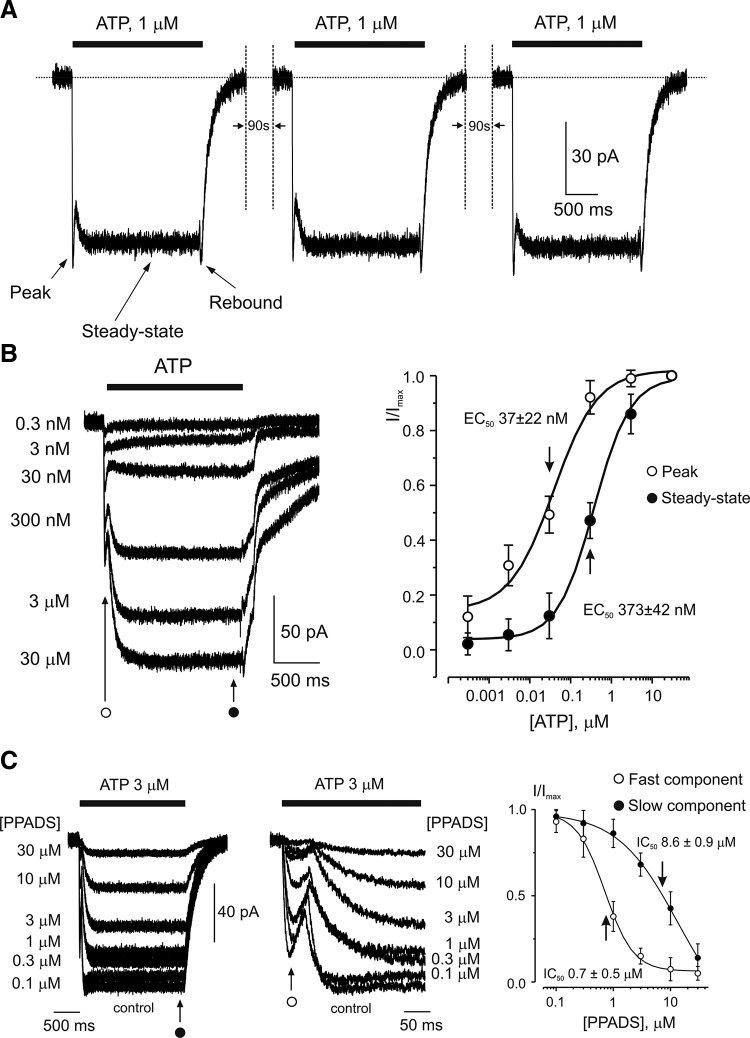
P2X1/5 receptor-mediated currents in cortical astrocytes. A: the family of ATP currents evoked by repetitive applications of the agonist. The currents show no apparent desensitization. Current traces have a complex kinetics comprising the peak, the steady-state component, and the “rebound” inward current recorded upon ATP washout as indicated on the graph. B: concentration dependence of ATP-induced currents in cortical astrocytes. Membrane currents recorded from a single cell in response to different ATP concentrations are shown on the left. The right panel shows the concentration-response curves constructed from 9 similar experiments; current amplitudes were measured at the initial peak and at the end of the current, as indicated on the graph. C: inhibition of ATP-induced currents by PPADS. Currents recorded at various concentrations of PPADS are shown on the left, and the concentration dependence of inhibition for peak and steady-state components constructed for 7 individual experiments is presented on the right. The peak component of the response was more sensitive to PPADS. Application of PPADS started 2 min before application of ATP. All recordings were made at holding potential of −80 mV. [From Lalo et al. (937).]
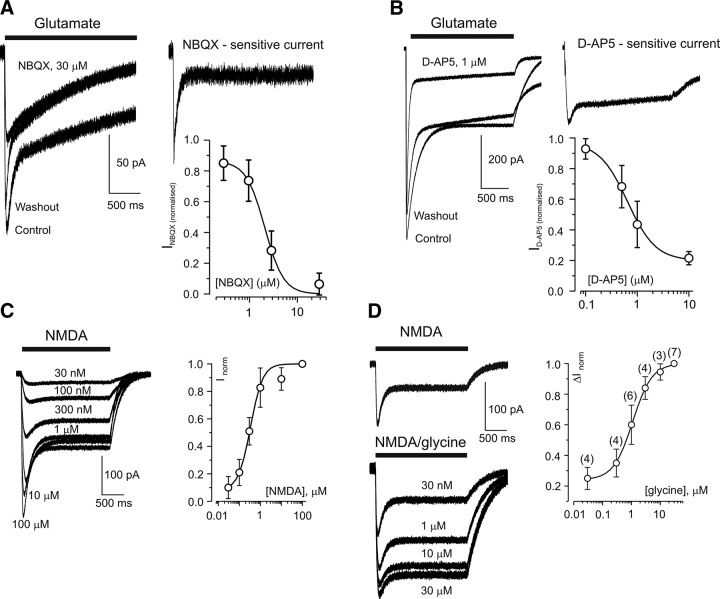
AMPA and NMDA receptor-mediated currents in cortical astrocytes. A: NBQX inhibits the fast component of glutamate-induced current. Representative traces illustrate the current before, during, and after application of 30 μM NBQX (left panel) as well as the NBQX-sensitive current obtained by subtraction (right panel). The concentration dependence of the block of the fast component for four cells (IC50 = 2.2 ± 0.4 μM, Hill coefficient = 1.9) is shown in the inset. B: d -AP5 inhibits the slow component of glutamate-induced current. Representative traces demonstrating the effect of 1 μM d -AP5 (left panel) and the d -AP5-sensitive component were obtained by subtraction (right panel). The concentration dependence of the block for five cells (IC50 = 0.64 ± 0.1 μM, Hill coefficient = 1.6) is shown in the inset. C: NMDA-induced (2-s application) currents in a single astrocyte and concentration-response curve constructed from six such experiments (EC50 0.34 ± 0.06 μM, Hill coefficient = 1.5). D: glycine-dependent potentiation of astrocyte NMDA response. NMDA-induced currents in glycine-free normal extracellular solution are shown on the top; NMDA-induced currents in the presence of different glycine concentrations (30 nM and 1, 10, and 30 μM) are displayed on the bottom. The concentration-response curve (ΔInorm represents the amplitudes of current increase normalized to the maximal increase at 30 μM glycine) constructed from seven experiments is shown on the right (EC50 1.1 ± 0.07 μM, Hill coefficient = 1.2). [From Lalo et al. (935).]
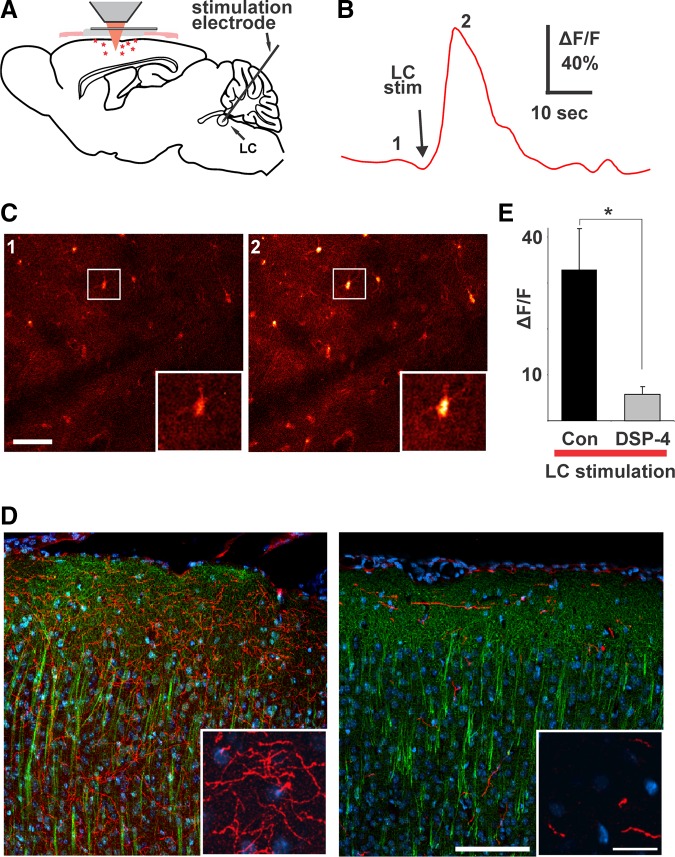
Direct stimulation of locus coeruleus elicits Ca2+ transients in cortical astrocytes. A: the scheme of experimental setup. B: average fluorescence of the image field in C over time showing Ca2+ response to locus coeruleus stimulation. C: fluo 4-labeled astrocytes taken at time points indicated by numbers in B. Insets are blown-up view of boxed area in pictures. Scale bar, 50 μm. D: images from coronal sections through somatosensory cortex illustrating the effect of N-(2-chloroethyl)-N-ethyl-2-bromobenzylamine (DSP-4) on locus coeruleus projection neurons as labeled by antibodies to TH (in red) and MAP-2 (in green) with DAPI labeling of nuclei for orientation. Scale bar, 100 μm (20 μm in inset). E: consistent with the significant reduction in locus coeruleus projection neurons and despite almost twice the stimulation intensity (216 ± 33 vs. 400 ± 39 μA; P = 0.004, t-test), there is a significant reduction in the cortical Ca2+ response to locus coeruleus stimulation in DSP-4-treated animals (P = 0.013, t-test). [From Bekar et al. (123).]
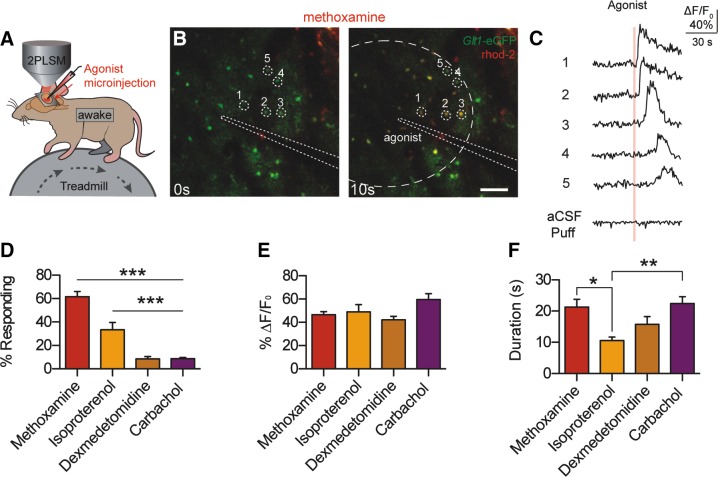
Stimulation of α1- and β-adrenoceptors triggers Ca2+ signaling in astrocytes in vivo. A: cortical astrocytes loaded with rhod 2-AM were imaged in layers I/II to detect changes in [Ca2+]i. Agonists were injected using a microelectrode loaded with an artificail cerebrospinal fluid (aCSF) and the tracer Alexa 488. B: representative images of astrocytic [Ca2+]i responses to the α1-AR agonist methoxamine in awake Glt-1-EGFP transgenic mice. Astrocyte-specific loading of rhod 2-AM was confirmed by colocalization with Glt-1-EGFP. Scale bar = 100 μm. C: rhod 2-AM ΔF/F0 traces from B, normalized to Glt-1-EGFP fluorescence. Representative aCSF-microinjection trace is shown at the bottom. D: astrocytic [Ca2+]i responses to adrenergic and acetylcholinergic receptor agonists, measured by rhod 2-AM ΔF/F0. Bar graph shows the percentage of astrocytes within the puff radius responding with a [Ca2+]i increase. ***P < 0.001, one-way ANOVA, Bonferroni correction [n = 25 trials in 6 animals (methoxamine); 14 trials in 4 animals (isoproterenol); 24 trials in 5 animals (dexmedetomidine); 23 trials in 5 animals (carbachol)]. E and F: bar graphs showing average rhod 2-AM ΔF/F0 and response duration from trials with responding cells. **P < 0.01; *P < 0.05, one-way ANOVA, Bonferroni correction [n = 25 trials (methoxamine), 13 trials (isoproterenol), 17 trials (dexmedetomidine), 20 trials (carbachol)]. Data are means ± SE. [From Ding et al. (431).]
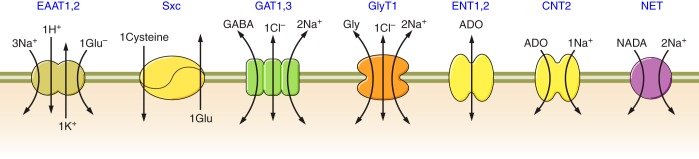
Stoichiometry of astroglial solute carrier (SLC) neurotransmitter transporters. EAAT1,2 , excitatory amino acid transporters 1 and 2; Sxc, cystine-glutamate exchanger; GAT1,3, GABA transporters 1 and 3; GlyT1, glycine transporter; ENT, equilibrative nucleotide transporters; CNT, concentrative nucleotide transporters; NET, norepinephrine transporter.
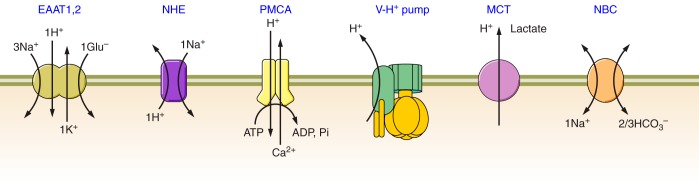
Astrocytes and pH homeostasis. Astrocytes regulate extracellular pH by supplying H+ through operation of NHE, EAAT1/2, MCT, and possibly V-H+ pump, by removing H+ by PMCA and by supplying extracellular space with HCO3− through NBC. EAAT1,2, excitatory amino acid transporters 1 and 2; NHE, Na+-H+ exchanger, PMCA, plasmalemmal Ca2+-ATPase; VH+ pump, vacuolar H+ pump localized in plasmalemma; MCT, monocarboxylate transporter; NBC, Na+-bicarbonate exchanger.
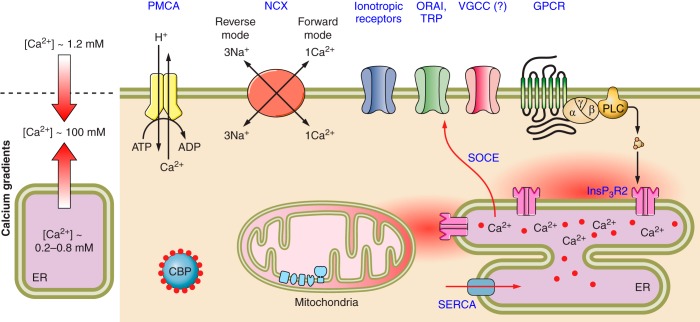
Molecular pathways of astroglial Ca2+ signaling. Cytoplasmic calcium signaling is driven by the concentration gradients for Ca2+ ions between extracellular space and the cytosol and between the lumen of intracellular organelles (mainly endoplasmic reticulum) and the cytosol. Physiological stimulation opens plasmalemmal or intracellular Ca2+ channels, thus creating Ca2+ fluxes which translate into [Ca2+]i dynamical changes in intracellular compartments. In astroglia, Ca2+ signals originate from both InsP3-induced Ca2+ release from the ER calcium store (which can be also amplified by Ca2+ release through ryanodine receptors) and Ca2+ entry via plasmalemmal Ca2+ channels (see sect. VIIC for detailed description), ionotropic receptors (see sect. VIII), or reversed Na+-Ca2+ exchanger. In the cytosol, Ca2+ interacts with Ca2+-bindng proteins, which are represneted by Ca2+ buffers and Ca2+ sensors. The latter are Ca2+-regulated enzymes, which initiate various cellular reactions. Cytosolic Ca2+ signals are terminated by Ca2+ extrusion into extracellular space by Ca2+ pumps and Na+-Ca2+ exchanger and Ca2+ uptake into the ER (by SERCA pumps) and mitochondria (by mitochondrial uniporter). Mitochondrial Ca2+ entry acts as the main link between cell activity and energy production by regulating mitochondrial electron transport and ATP synthesis. CBP, Ca2+ binding proteins; ER, endoplasmic reticulum; GPCR, G protein-coupled metabotropic receptors; InsP3R2, InsP3 receptor type 2; NCX, Na+-Ca2+ exchanger; ORAI, Ca2+ release-activated Ca2+ channels; PMCA, plasmalemmal Ca2+-ATPase; RyR, ryanodine receptors; SERCA, sarco(endo)plasmic reticulum Ca2+-ATPase; SOCE, store-operated Ca2+ entry; TRP, transient receptor potential channels; VGCCs, voltage-gated calcium channels.
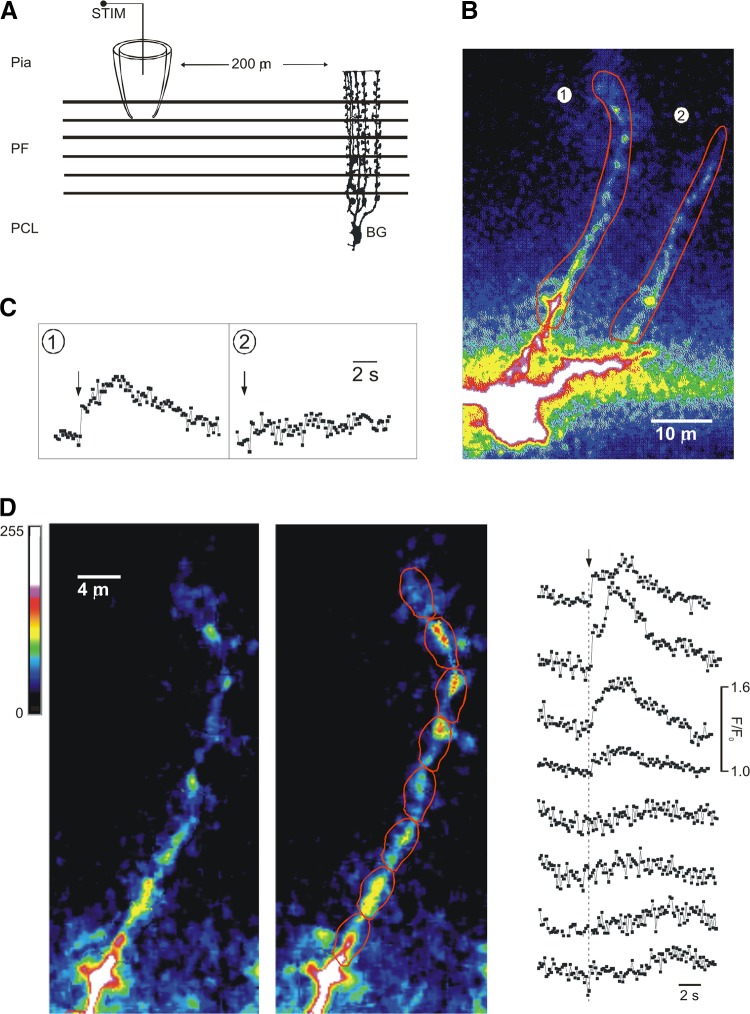
Ca2+ microdomains in Bergmann glia. Stimulation of parallel fibers triggers local calcium signals in Bergmann glial cells. A: experimental protocol. Parallel fibers (PF) were stimulated via a pipette connected to a stimulator (STIM) while calcium-dependent fluorescence responses were recorded in a Bergmann glial cell (BG). PCL, Purkinje cell layer. B: confocal fluorescence intensity image of a patch-clamped Bergmann glial cell dialyzed with the calcium indicator Oregon green 488 BAPTA-1 (right). Two processes were distinguished (indicated as 1, 2). C: calcium signals in response to PF stimulation were measured independently for each process (left). Time of PF stimulation is marked by arrows. D: the responding process (1) was further subdivided into regions of interest, in which calcium signals were measured separately (right). Time of PF stimulation is marked by an arrow and a dotted line. (From Matyiash, Grosche, Reichenbach, Verkhratsky, and Kettenmann, unpublished data.)
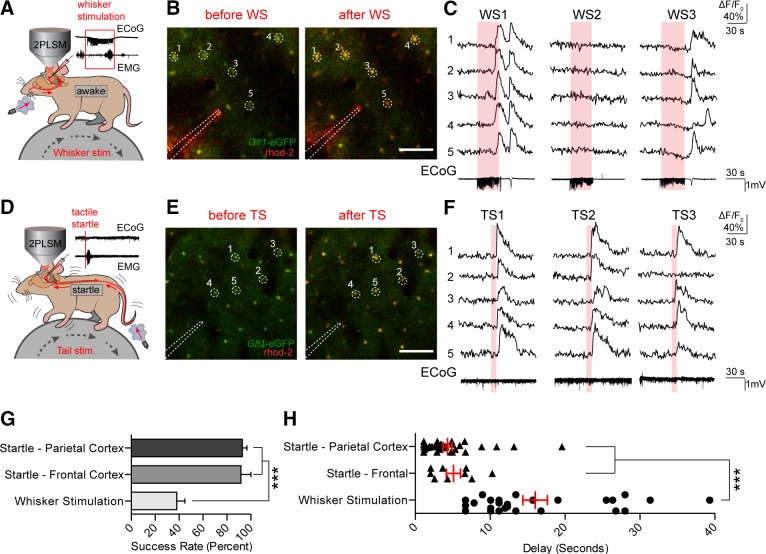
Startle stimulation triggers widespread astroglial Ca2+ signaling. A: astrocytic Ca2+ transients measured by rhod 2-AM were detected in response to 30 s of 3-Hz whisker stimulation. Representative local field potential LFP and electromyogram (EMG) recordings are shown. B: representative images of rhod 2-AM fluorescence increases during whisker stimulation in a Glt-1-EGFP animal. Scale bar = 100 μM. C: selected cells from B. Rhod 2 ΔF/F0 was normalized to Glt-1-EGFP fluorescence. Electrocorticogram (ECoG) traces corresponding to rhod 2 ΔF/F0 are shown below. D: air pulses were directed at the face or tail of the animal to elicit a startle response. Representative ECoG and EMG traces are shown with no apparent evoked ECoG response and strong EMG activity, indicative of a startle response. E and F: representative images and corresponding rhod 2 ΔF/F0 traces show stable and repeatable astrocytic [Ca2+]i transients after startle stimulations. Bottom: representative ECoG traces from startle stimulation are shown. G: bar graph showing the response rate of cortical astrocytes to whisker and startle stimulation, averaged across animals. *** P < 0.001, one-way ANOVA, Bonferroni correction [n = 11 animals (parietal cortex startle and whisker stimulation), 4 animals (frontal cortex startle)]. H: scatter diagram with superimposed mean and SE for the delay from the onset of whisker/startle stimulation to the beginning of astrocytic rhod 2 ΔF/F0 responses. Average delay from each successful trial is shown. *** P < 0.001, one-way ANOVA, Bonferroni correction [n = 28 trials in 14 animals (whisker stimulation), 38 trials in 13 animals (parietal cortex startle), and 9 trials in 4 animals (frontal cortex startle)]. Data are means ± SE. [From Ding et al. (431).]
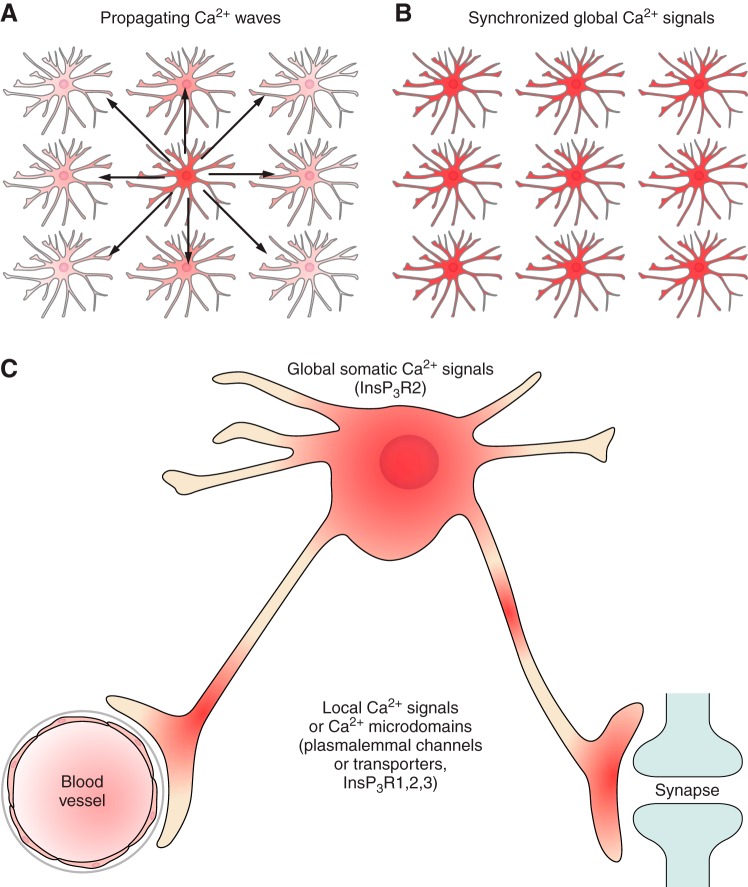
Hierarchy of astroglial Ca2+ signaling.
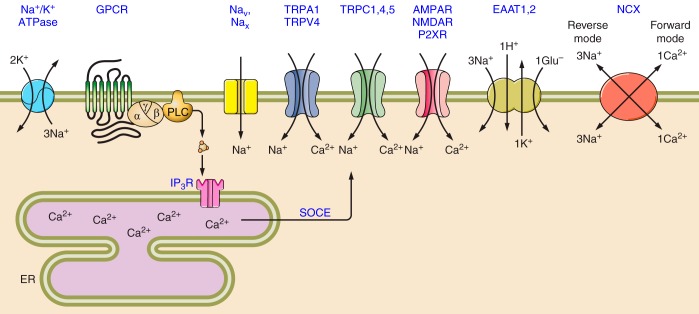
Na+ entry pathways. Astroglial Na+ signaling is generated by Na+ entry through plasmalemma; the Na+ influx occurs through Na+ channels, ionotropic receptors, and TRP channels. Na+ entry also accompanies operation of plasmalemmal SLC transporters and Na+-Ca2+ exchanger. Termination of Na+ signals is mainly mediated by Na+ extrusion via Na+-K+ pump. The TRPC channels are the molecular substrate of astroglial store-operated Ca2+ entry; as these channels pass both Na+ and Ca2+, they establish the link between metabotropic activation of Ca2+ release and Na+ signaling. AMPAR, AMPA receptors; EAAT1,2, excitatory amino acid transporters 1 and 2; ER, endoplasmic reticulum; GAT1,3, GABA transporters 1 and 3; GlyT1, glycine transporter; GPCR, G protein-coupled metabotropic receptors; NCX, Na+-Ca2+ exchanger; Nav, voltage-gated Na+ channels; Nax, Na channels gated by extracellular concentration of Na+; NKA, Na+-K+-ATPase; NMDAR, NMDA receptors; P2XR, P2X puriunoceptors; SOCE, store-operated Ca2+ entry; TRP, transient receptor potential channels.
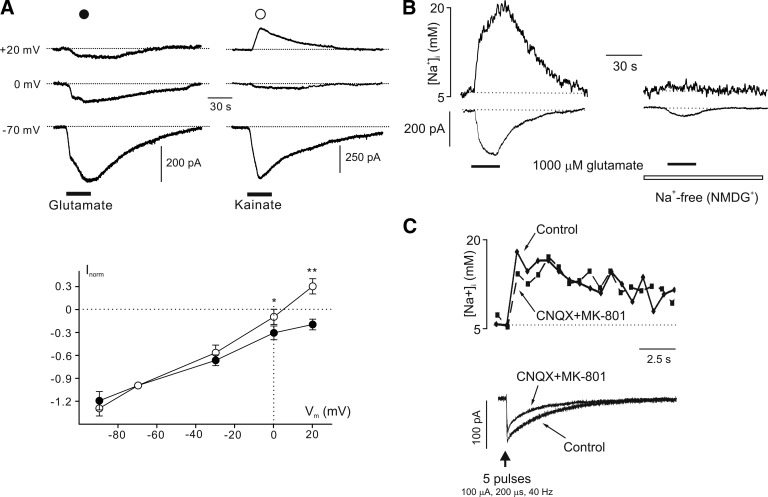
Astroglial Na+ signaling associated with glutamate uptake in cerebellar Bergmann glial cells. A: voltage dependence of glutamate-transporter current as compared with kainate-induced (AMPA-mediated) currents. The current traces are shown on the top (transporter current on the left and receptor-mediated current on the right), while current-voltage curves for glutamate- and kainite-induced currents are displayed at the bottom. For each cell membrane, currents at different voltages were normalized to the amplitude of current recorded at the holding potential of −70 mV. Note that glutamate-induced responses do not reverse at +20 mV, whereas kainate-induced currents show a reversal potential close to 0 mV. *P < 0.05 and **P < 0.01, significant difference between glutamate- and kainite-induced currents. B: simultaneous recordings of glutamate-induced inward current and [Na+]i elevation in normal conditions in Na+-free (Na+ substituted by NMDG+) solution. C: stimulation of parallel fibers activates membrane currents and transient [Na+]i elevation in Bergmann glial cell. The [Na+]i transient is not affected by inhibitors of ionotropic glutamate receptors. [From Kirischuk et al. (877).]
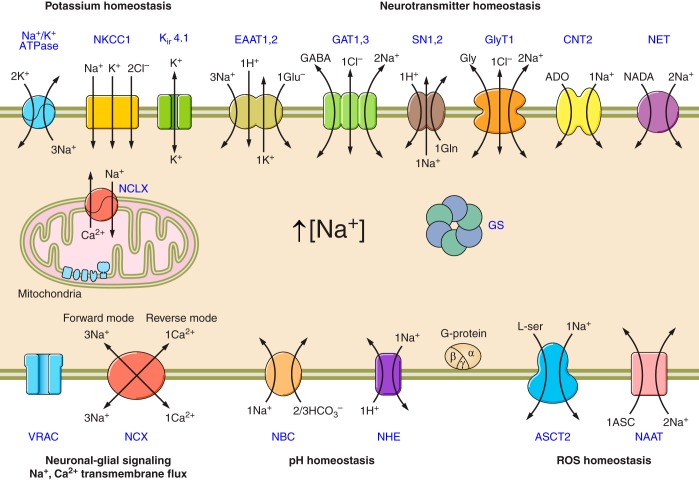
Na+ signals regulate multiple molecules and multiple homeostatic functions (see text for further details). ASCT2, alanine-serine-cysteine transporter 2; ASIC, acid sensing ion channels; CNT2, concentrative nucleoside transporters; EAAT, excitatory amino acid transporters; ENaC, epithelial sodium channels; GAT, GABA transporters; GS, glutamine synthetase; GlyT1, glycine transporter; iGluRs, ionotropic glutamate receptors; Nax, Na+ channels activated by extracellular Na+; NAAT, Na+-dependent ascorbic acid transporter; NBC, Na+/HCO3− (sodium-bicarbonate) cotransporter; NCX, Na+/Ca2+ exchanger; NCLX, mitochondrial Na+/Ca2+ exchanger; NHE, Na+/H+ exchanger; NKCC1, Na+/K+/Cl− cotransporter; NET, norepinephrine transporter; MCT1, monocarboxylase transporter 1; P2XRs, ionotropic purinoceptors; SN1,2, sodium-coupled neutral amino acid transporters which underlie exit of glutamine; TRP, transient receptor potential channels; ROS, reactive oxygen species; VRAC, volume-regulated anion channels.
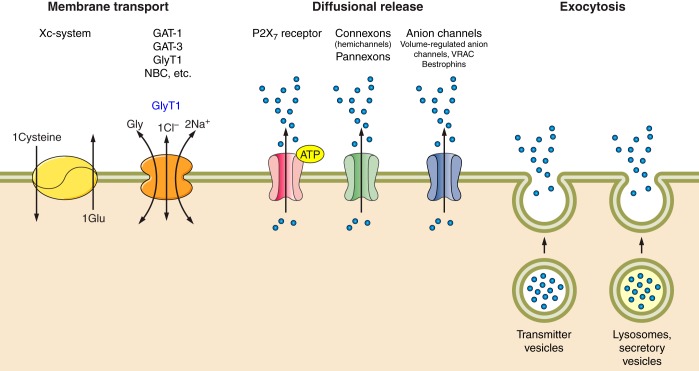
Multiple astroglial secretory pathways.
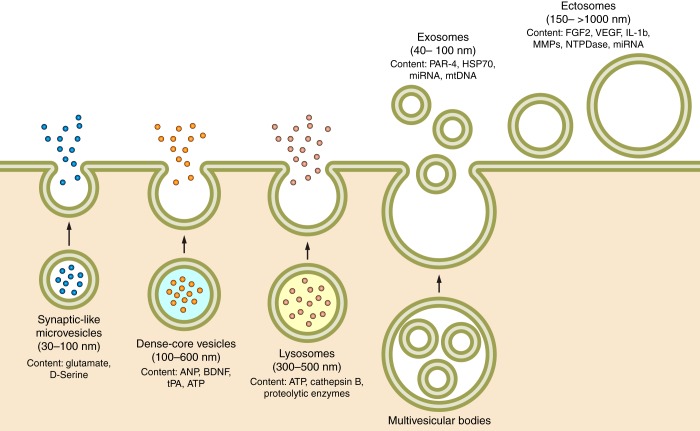
Astroglial secretory organelles.
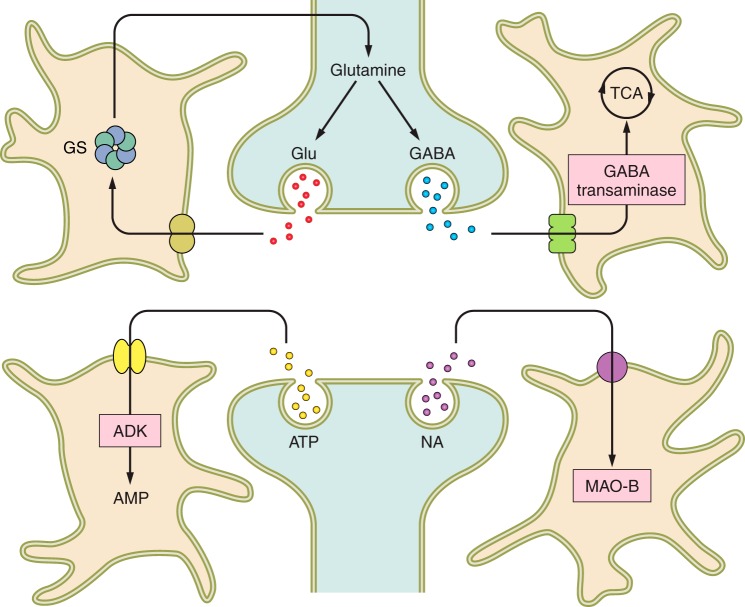
Astrocytes and neurotransmitter homeostasis. Astrocytes take up glutamate, GABA, adenosine, and monoamines. Glutamate is converted to glutamine (by glutamine synthetase, GS), which is shuttled to neurons for subsequent conversion into glutamate and GABA. GABA accumulated by astrocytes is mainly consumed by tricarboxylic acid cycle; adenosine is converted to AMP by adenosine kinase (ADK) while monoamines are degraded by astroglial monoamine oxidase B (MAO-B).
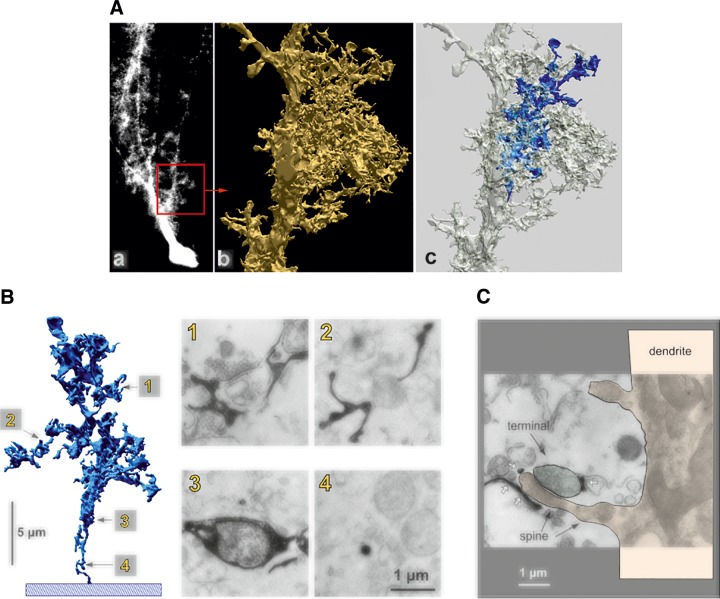
Microdomain organization of Bergmann glia and coverage of parallel fibers to Purkinje neuron synapses. A: reconstruction of an appendage based on electron microscopic data. a: Fluorescence light micrograph of a dye-injected Bergmann glial cell is shown; the red square (20 × 20 mm) corresponds to the portion that was reconstructed from consecutive ultrathin sections. b: One of the lateral appendages, arising directly from fiber with all the other side branches omitted for clarity. c: The same appendage as shown in b, but with one of the appendages marked by blue. This labeled structure is shown in isolation and at higher magnification in B. B: fine structure of appendages and relation to synapses. a: A small lateral appendage, arising from the reconstructed part of the glial fiber (blue in Ac), is shown as a slightly turned, isolated three-dimensional reconstruction (left). Electron micrographs of four sections contributing to the reconstruction (designated 1–4) are shown on the right; glial compartments appear black after conversion of the injected dye. The location of these sections in the reconstruction is indicated by the labeled arrows: 1, region directly contacting synapses; 2, glial compartments without direct synaptic contacts; 3, bulging glial structure containing a mitochondrion; 4, the stalk of the appendage. C: another example of a synapse contacted by glial compartments, appearing as black structures (white arrows); in this case, the postsynaptic element can be traced back along the spine (black arrows) to the Purkinje cell dendrite (reddish overlay; the presynaptic terminal is labeled by a green overlay). [From Grosche et al. (609).]
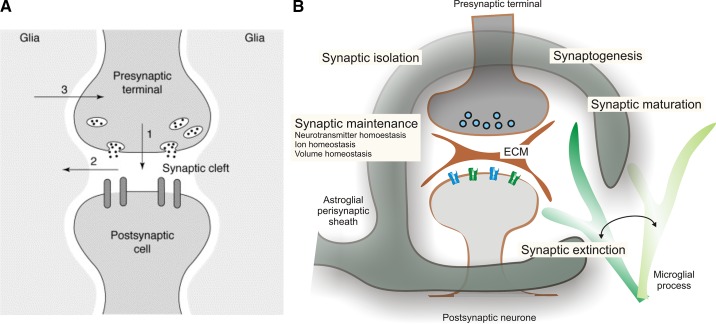
Tripartite synapse and synaptic cradle. A: the original concept of tripartite synapse. “During synaptic neurotransmission, neurons release neurotransmitters from nerve terminals into the synaptic cleft to communicate with other neurons (1). The neurotransmitter released from the synapse (or other co-released neurotransmitter) can, under certain circumstances, “spill over” from the synaptic cleft and reach neurotransmitter receptors in adjacent astrocytes, eliciting intracellular increases in Ca2+ concentrations in the glial cells (2). The increase in the glial-cell Ca2+ concentration causes it to release a chemical neurotransmitter from the glial cell, which in the case of astrocytes is glutamate (3), that feeds back to the presynaptic nerve terminal to modulate synaptic neurotransmission.” [From Araque et al. (58). The figure from original submission (although left unpublished) was kindly provided by Prof. V. Parpura (Birmingham University, Birmingham, AL).] B: astroglial cradle embraces and fosters multi-partite synapse in the CNS. The majority of synapses in the brain and in the spinal cord are composed of several components that include the presynaptic terminal, the postsynaptic compartment, the perisynaptic process of the astrocyte, the process of neighboring microglial cell that periodically contacts the synaptic structure, and the extracellular matrix (ECM) present in the synaptic cleft and also extended extrasynaptically. Astroglial perisynaptic sheath enwraps synaptic structures and regulate, influence, and assist synaptogenesis, synaptic maturation, synaptic maintenance, and synaptic extinction. [From Verkhratsky and Nedergaard (1812).]
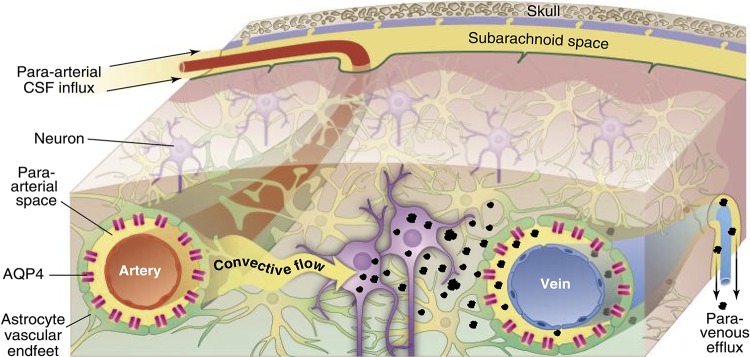
Schematic outline of the glymphatic system. Convective glymphatic fluxes of cerebrospinal fluid (CSF) and interstitial fluid (ISF) propel the waste products of neuron metabolism into the paravenous space, from which they are directed into lymphatic vessels and ultimately return to the general circulation for clearance by the kidney and liver. [From Nedergaard (1204).]
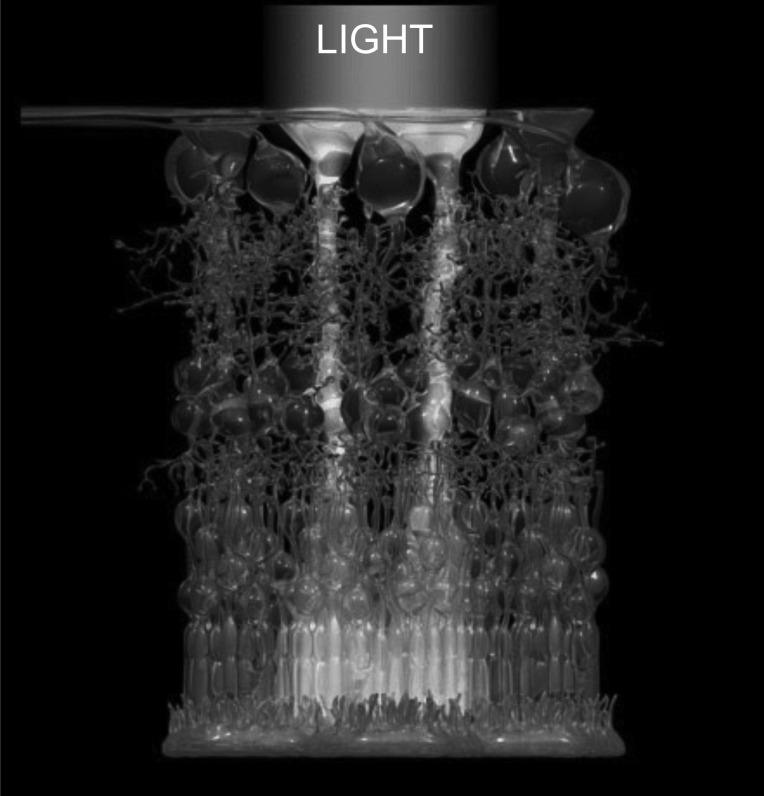
Müller cells as light guides. Shown as an artistic impression, the light penetrates the retina using Müller glial cells as guides. (Artwork courtesy of Dr. Jens Grosche, Leipzig University.)
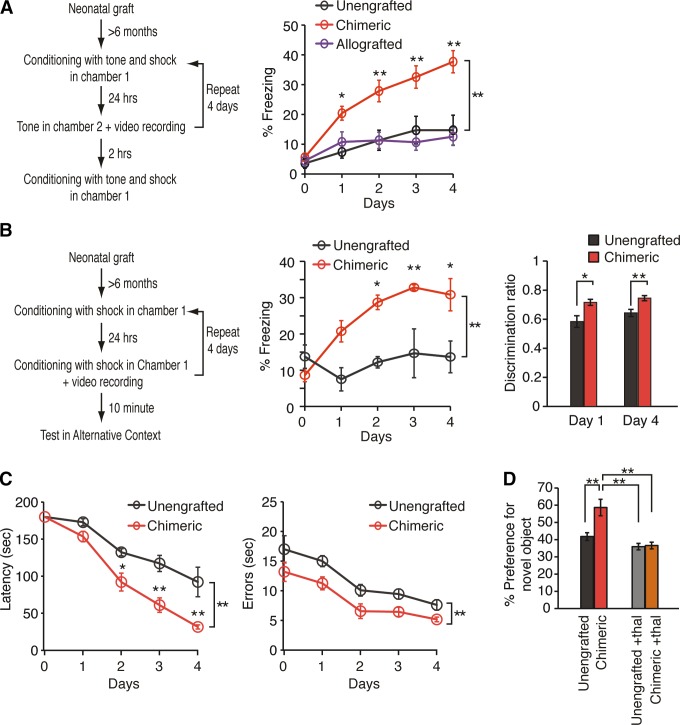
Humanized chimeric mice learn faster than wild-type controls. A: auditory fear conditioning assessed in a cohort of human chimeric, mouse chimeric, and unengrafted control rag1 mice. Chimeric mice exhibit prolonged freezing behavior in test chamber 2, during exposure to the tonal conditioned stimulus when compared with unengrafted mice and allografted mice (n = 5–20; *P < 0.05; **P < 0.01; two-way repeated measures ANOVA with Bonferroni test; means ± SE). This difference persisted throughout all 4 days. B: contextual fear conditioning in human glial-chimeric mice and littermate controls. Freezing behavior was quantified for chimeric and unengrafted littermate controls during the 2 min of acclimatization period (n = 6; *P < 0.05; **P < 0.01; two-way repeated measures ANOVA with Bonferroni test). In addition, the mean discrimination ratio for each day was obtained from freezing scores in the training chamber and the alternative chamber (freezing in training chamber/total freezing time). Chimeric mice demonstrated significantly higher abilities to discriminate the chambers (n = 8–13; *P < 0.05; **P < 0.01; two-way repeated measures ANOVA with Bonferroni test). C: Barnes maze testing in chimeric and unengrafted littermate controls. Chimeric mice demonstrated a significant learning advantage, as reflected in a shorter latency and fewer errors in solving the maze (n = 6; *P < 0.05; **P < 0.01; two-way repeated measures ANOVA with Bonferroni test). D: object-location memory task (OLT) in chimeric mice and their unengrafted littermate controls demonstrated a learning advantage in chimeric mice via enhanced recognition of the novel displaced object. Thalidomide eliminated the learning advantage of chimeric mice, suggesting that the learning enhancement was TNF-α mediated (n = 7; **P < 0.01; one-way ANOVA with Bonferroni test). All data plotted as means ± SE. [From Han et al. (637).]
References
-
- Abbracchio MP, Burnstock G, Boeynaems JM, Barnard EA, Boyer JL, Kennedy C, Knight GE, Fumagalli M, Gachet C, Jacobson KA, Weisman GA. International Union of Pharmacology LVIII: update on the P2Y G protein-coupled nucleotide receptors: from molecular mechanisms and pathophysiology to therapy. Pharmacol Rev 58: 281–341, 2006. doi: 10.1124/pr.58.3.3. - DOI - PMC - PubMed
Publication types
MeSH terms
Substances
Grants and funding
LinkOut - more resources
Full Text Sources
Other Literature Sources
Molecular Biology Databases