. 2018 Jan 18;126(1):017008.
doi: 10.1289/EHP2466.

Long-Term Exposure to Fine Particulate Matter, Blood Pressure, and Incident Hypertension in Taiwanese Adults

Affiliations

Long-Term Exposure to Fine Particulate Matter, Blood Pressure, and Incident Hypertension in Taiwanese Adults

Zilong Zhang et al. Environ Health Perspect. .

Abstract

Background: Long-term exposure to particulate matter (PM) air pollution may increase blood pressure and the risk of hypertension. However, epidemiological evidence is scarce and inconsistent.

Objectives: We investigated the associations between long-term exposure to PM with an aerodynamic diameter <2.5μm (PM2.5), blood pressure, and incident hypertension in a large Taiwanese cohort.

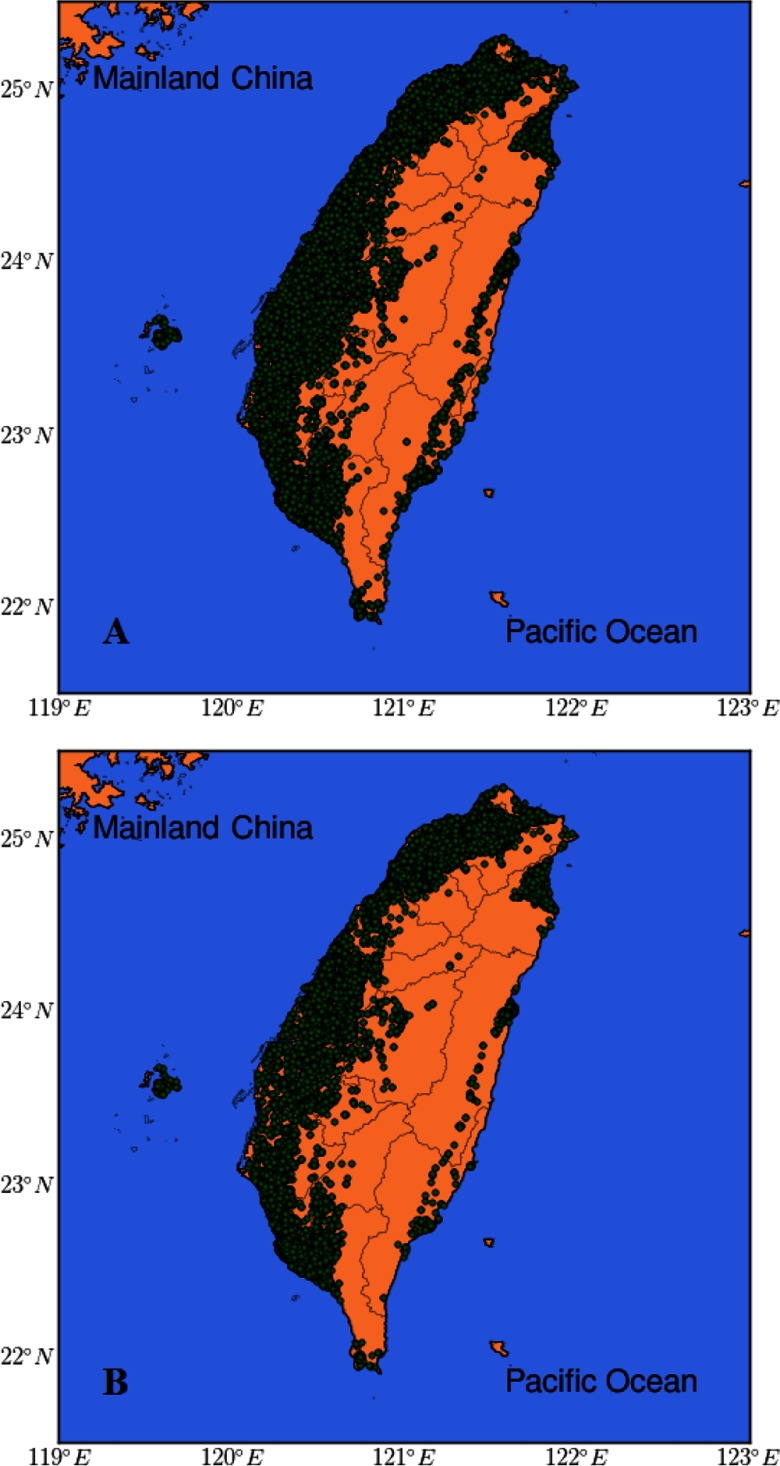
Methods: We studied 361,560 adults ≥18y old from a large cohort who participated in a standard medical examination program during 2001 to 2014. Among this group, 125,913 nonhypertensive participants were followed up. A satellite-based spatiotemporal model was used to estimate the 2-y average PM2.5 concentrations at each participant's address. Multivariable linear regression was used in the cross-sectional data analysis with the 361,560 participants to investigate the associations between PM2.5 and systolic blood pressure (SBP), diastolic blood pressure (DBP), and pulse pressure (PP), and Cox proportional hazard regression was used in the cohort data analysis with the 125,913 participants to investigate the associations between PM2.5 and incident hypertension.

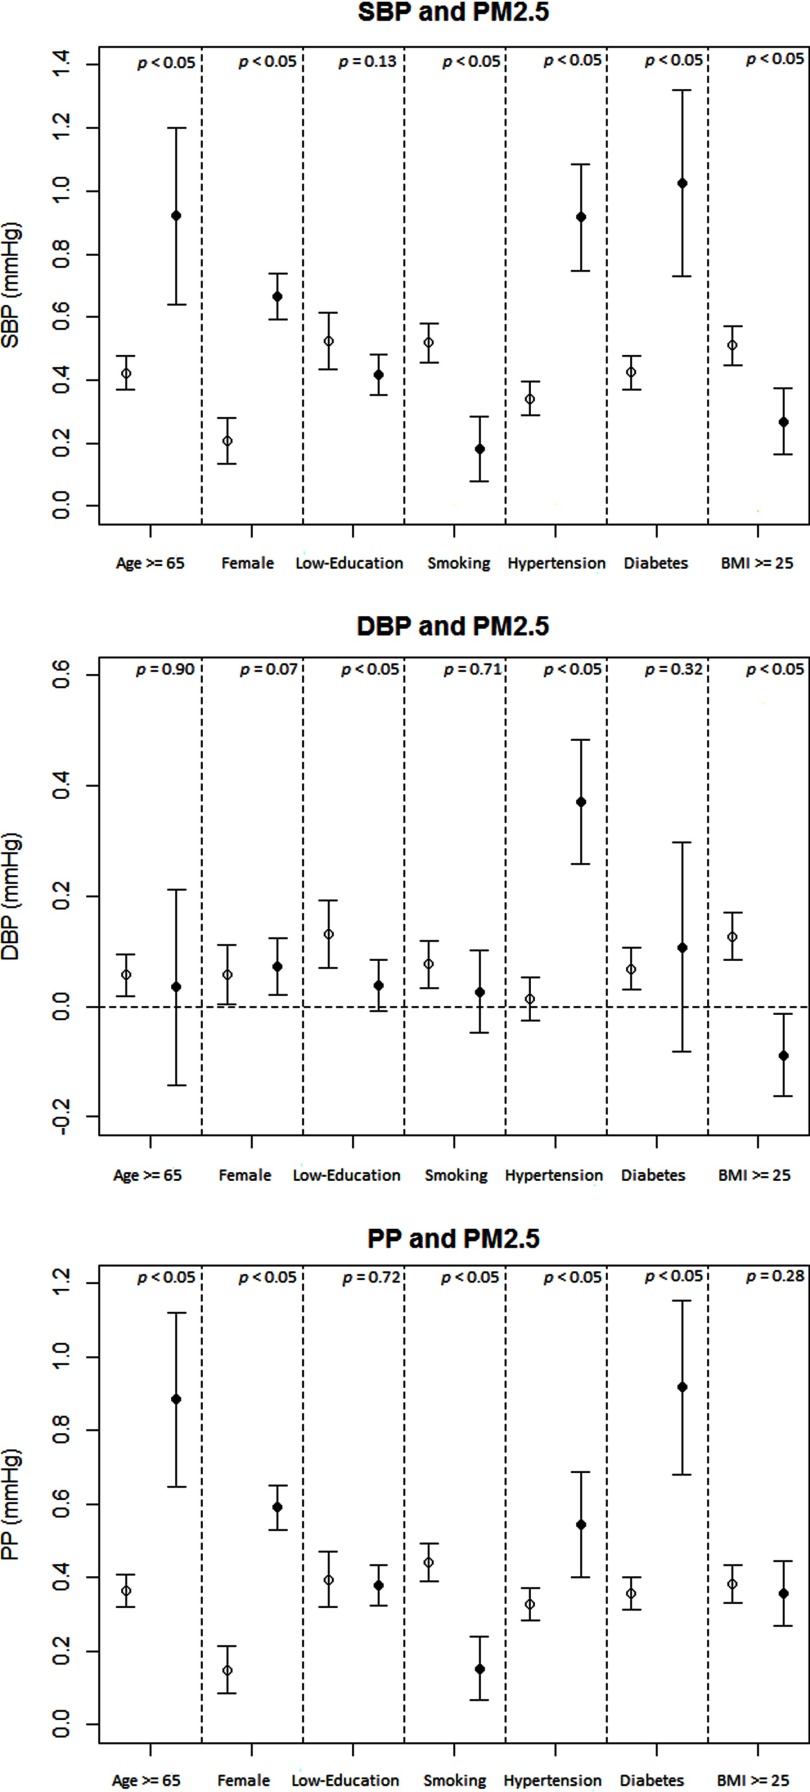
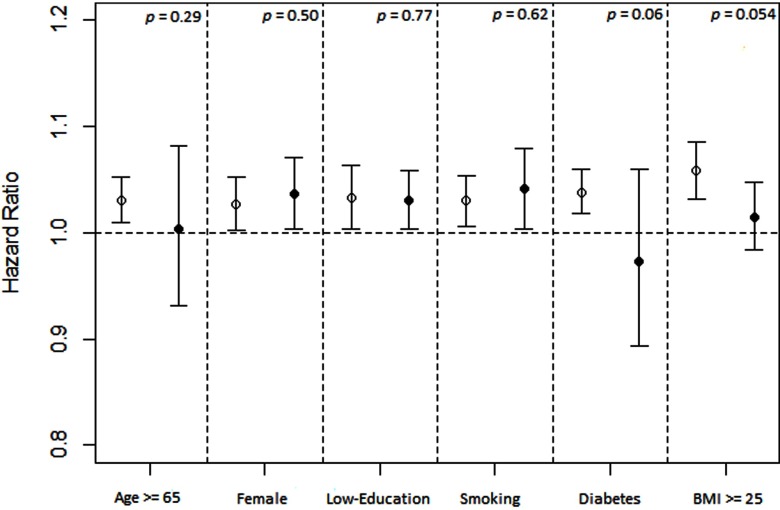
Results: Each 10-μg/m3 increment in the 2-y average PM2.5 concentration was associated with increases of 0.45 mmHg [95% confidence interval (CI): 0.40, 0.50], 0.07 mmHg (95% CI: 0.04, 0.11), and 0.38 mmHg (95% CI: 0.33, 0.42) in SBP, DBP, and PP, respectively, after adjusting for a wide range of covariates and possible confounders. Each 10-μg/m3 increment in the 2-y average PM2.5 concentration was associated with an increase of 3% in the risk of developing hypertension [hazard ratio=1.03 (95% CI: 1.01, 1.05)]. Stratified and sensitivity analyses yielded similar results.

Conclusions: Long-term exposure to PM2.5 air pollution is associated with higher blood pressure and an increased risk of hypertension. These findings reinforce the importance of air pollution mitigation strategies to reduce the risk of cardiovascular disease. https://doi.org/10.1289/EHP2466.


Figures

Two maps of Taiwan marking the locations of the study participants for blood pressure and incident hypertension
Figure 1.
Location map of the study participants. (A) 361,560 participants in blood pressure–PM2.5 analysis. (B) 125,913 participants in incident hypertension–PM2.5 analysis. Circles represent the locations of the study participants.
Figure 2 comprises three plots with 95 percent confidence intervals respectively plotting SBP, DBP, and PP all measured in millimeters of mercury (y-axis) adjusted for the following factors (x-axis): age greater than or equal to 65 years (p less than 0.05; p equals 0.07; p less than 0.05), female (p less than 0.05; p equals 0.07; p less than 0.05), low education (p equals 0.13; p less than 0.05; p equals 0.72), smoking (p less than 0.05; p equals 0.71; p less than 0.05), hypertension (p less than 0.05; p less than 0.05; p less than 0.05), diabetes (p less than 0.05; p equals 0.32; p less than 0.05), and BMI greater than or equal to 25 (p less than 0.05; p less than 0.05; p equals 0.28).
Figure 2.
Stratified analysis on associations between long-term PM2.5 exposure (10-μg/m3 increments) and systolic blood pressure (SBP), diastolic blood pressure (DBP), and pulse pressure (PP) at baseline. Effect estimates (coefficients) are derived from multivariable linear regression analysis, and bars cover 95% confidence intervals. Results were adjusted for age (not in age-stratified analysis), sex (not in sex-stratified analysis), education level (not in education level–stratified analysis), smoking status (not in smoking-stratified analysis), alcohol drinking, leisure-time physical activity, occupational exposure to dust or organic solvents in the workplace, season, body mass index (BMI; not in BMI-stratified analysis), hypertension (not in hypertension-stratified analysis), diabetes (not in diabetes-stratified analysis), hyperlipidemia, and self-reported cardiovascular disease, stroke, or cancer. The lines with hollow circles from left to right represent the participants who were <65yold, were males, had a high education level, were nonsmokers, had no hypertension, had no diabetes, and had BMI <25kg/m2, respectively. The lines with solid circles from left to right represent the participants who were 65yold, were females, had a low education level, were smokers, had hypertension, had diabetes, and had BMI25kg/m2, respectively. p-Values for interaction terms between PM2.5 (continuous variable) and each potential modifier (dichotomous variable) are presented in the figure.
Plots with 95 percent confidence intervals plotting hazard ratio (y-axis) across factors, namely, age greater than or equal to 65 years (p equals 0.29), female (p equals 0.50), low education (p equals 0.77), smoking (p equals 0.62), diabetes (p equals 0.06), and BMI greater than or equal to 25 (p equals 0.054) (x-axis).
Figure 3.
Stratified analysis on associations between long-term PM2.5 exposure (10-μg/m3 increments) and incident hypertension. Effect estimates (hazard ratios) are derived from Cox proportional hazard regression analysis, and bars cover 95% confidence intervals. Results were adjusted for age (not in age-stratified analysis), sex (not in sex-stratified analysis), education level (not in education level–stratified analysis), smoking status (not in smoking-stratified analysis), alcohol drinking, leisure-time physical activity, occupational exposure to dust or organic solvents in the workplace, season, body mass index (BMI; not in BMI-stratified analysis), diabetes (not in diabetes-stratified analysis), hyperlipidemia, and self-reported cardiovascular disease, stroke, or cancer. The lines with hollow circles from left to right represent the participants who were <65yold, were males, had a high education level, were nonsmokers, had no diabetes, and had BMI <25kg/m2, respectively. The lines with solid circles from left to right represent the participants who were 65yold, were females, had a low education level, were smokers, had diabetes, and had BMI25kg/m2, respectively. p-Values for interaction terms between PM2.5 (continuous variable) and each potential modifier (dichotomous variable) are calculated and presented in the figure.

References

    1. Bilenko N, van Rossem L, Brunekreef B, Beelen R, Eeftens M, Hoek G. 2015. Traffic-related air pollution and noise and children’s blood pressure: results from the PIAMA birth cohort study. Eur J Prev Cardiol 22(1):4–12, PMID: 24047569, 10.1177/2047487313505821. - DOI - PubMed
    1. Bondjers G, Glukhova M, Hansson GK, Postnov YV, Reidy MA, Schwartz SM. 1991. Hypertension and atherosclerosis. Cause and effect, or two effects with one unknown cause? Circulation 84(6suppl):VI2–V16, PMID: 1959216. - PubMed
    1. Brook RD, Rajagopalan S, Pope CA 3rd, Brook JR, Bhatnagar A, Diez-Roux AV, et al. 2010. Particulate matter air pollution and cardiovascular disease: an update to the scientific statement from the American Heart Association. Circulation 121(21):2331–2378, PMID: 20458016, 10.1161/CIR.0b013e3181dbece1. - DOI - PubMed
    1. Brook RD, Urch B, Dvonch JT, Bard RL, Speck M, Keeler G, et al. 2009. Insights into the mechanisms and mediators of the effects of air pollution exposure on blood pressure and vascular function in healthy humans. Hypertension 54(3):659–667, PMID: 19620518, 10.1161/HYPERTENSIONAHA.109.130237. - DOI - PMC - PubMed
    1. Chan SH, Van Hee VC, Bergen S, Szpiro AA, DeRoo LA, London SJ, et al. 2015. Long-term air pollution exposure and blood pressure in the Sister Study. Environ Health Perspect 123(10):951–958, PMID: 25748169, 10.1289/ehp.1408125. - DOI - PMC - PubMed

Publication types

MeSH terms

LinkOut - more resources