. 2018 Mar 1;159(3):1360-1376.
doi: 10.1210/en.2017-03102.

A Membrane G-Protein-Coupled Estrogen Receptor Is Necessary but Not Sufficient for Sex Differences in Zebra Finch Auditory Coding

Affiliations

A Membrane G-Protein-Coupled Estrogen Receptor Is Necessary but Not Sufficient for Sex Differences in Zebra Finch Auditory Coding

Amanda A Krentzel et al. Endocrinology. .

Abstract

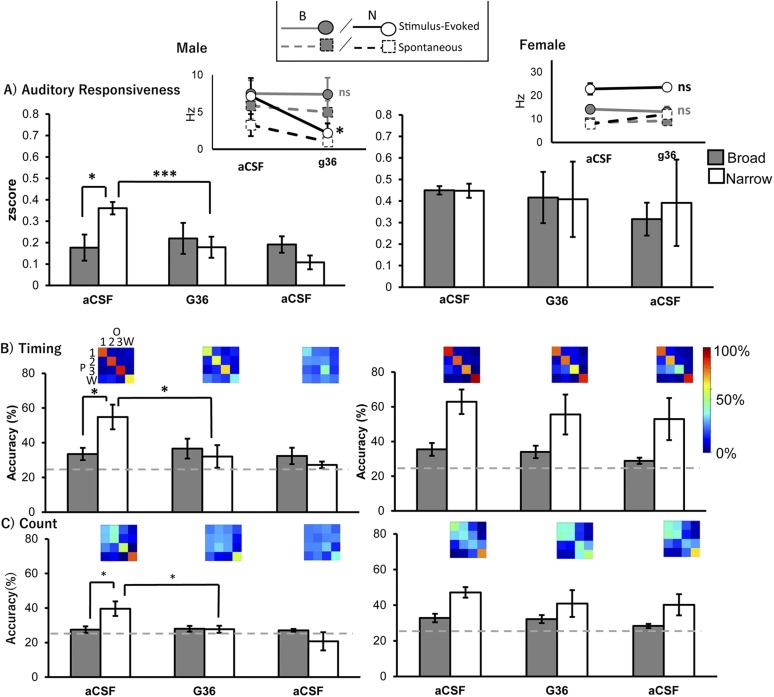
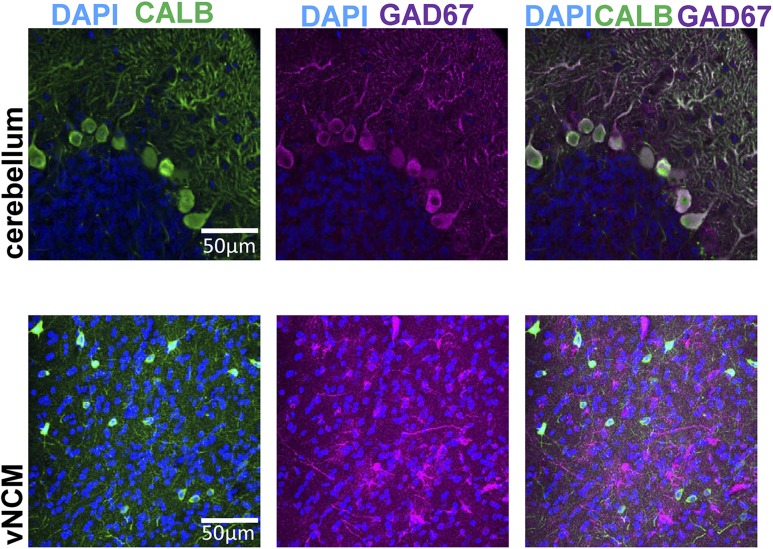
Estradiol acts as a neuromodulator in brain regions important for cognition and sensory processing. Estradiol also shapes brain sex differences but rarely have these concepts been considered simultaneously. In male and female songbirds, estradiol rapidly increases within the auditory forebrain during song exposure and enhances local auditory processing. We tested whether G-protein-coupled estrogen receptor 1 (GPER1), a membrane-bound estrogen receptor, is necessary and sufficient for neuroestrogen regulation of forebrain auditory processing in male and female zebra finches (Taeniopygia guttata). At baseline, we observed that females had elevated single-neuron responses to songs vs males. In males, narrow-spiking (NS) neurons were more responsive to conspecific songs than broad-spiking (BS) neurons, yet cell types were similarly auditory responsive in females. Following acute inactivation of GPER1, auditory responsiveness and coding were suppressed in male NS yet unchanged in female NS and in BS of both sexes. By contrast, GPER1 activation did not mimic previously established estradiol actions in either sex. Lastly, the expression of GPER1 and its coexpression with an inhibitory neuron marker were similarly abundant in males and females, confirming anatomical similarity in the auditory forebrain. In this study, we found: (1) a role for GPER1 in regulating sensory processing and (2) a sex difference in auditory processing of complex vocalizations in a cell type-specific manner. These results reveal sex specificity of a rapid estrogen signaling mechanism in which neuromodulation accounts and/or compensates for brain sex differences, dependent on cell type, in brain regions that are anatomically similar in both sexes.


Conflict of interest statement

The authors have nothing to disclose.

Figures

Figure 1.
Figure 1.
Characteristics of broad and narrow cells. (A, left) Waveform averages for two example units from the same recording site. The purple unit is a narrow cell, and the red unit is a broad cell. The center line indicates the mean waveform, whereas the shaded area represents the standard deviation (SD) for all incidences of that shape in the recording. (A, right) An example of a PCA for the red and purple cells of that recording. (B) Histogram of quarter-spike width durations (in milliseconds). A dip in the histogram at 0.5 ms was used as an indicator of cutoff between narrow- and broad-unit classification. (C) Latency (in milliseconds) to fire after (left) the first syllable, and stimulus-evoked firing frequency are depicted as means and standard error of the mean. Gray bars are for broad units and white are narrow units. Samples sizes for each group are depicted for each bar; *P < 0.05.
Figure 2.
Figure 2.
The firing rates of NCM neurons differ between males and females, and the coding properties of NCM neurons differ by cell-type classification. All panels depict bar graphs representing means and standard error of the mean for the average of all three conspecific song types. (A) Stimulus-evoked firing frequency (song) is higher than baseline firing frequency (no song) for both sexes. Female cells (n = 59) have a higher firing frequency than male cells (n = 57) for both spontaneous and stimulus-evoked conditions. (B) Male narrow single units (n = 25) have a higher normalized auditory responsiveness (z score) than broad units (n = 32). Female broad (n = 37) and narrow (n = 22) units have similar auditory responsiveness. (C) Percentage of cells that are categorized as four coding types: bicoding (purple), count (red), timing (blue), and neither (white), separated by (upper) sex or (lower) cell type. Males and females have a similar distribution of coding types, but broad vs narrow units have significantly different distribution of coding types (χ2 = 12.2, P = 0.007). Specifically, narrow-spiking cells have more bicoding cells (85.1%) than broad-spiking cells (56.5%). (D and E) Means and standard errors for the average (D) timing accuracy and (E) count accuracy of the correctly assigned sound types. Broad cells (gray) have lower count and timing accuracy than narrow cells (white) for both males and females. Confusion matrices above each bar depict a representative cell of the mean for that group. Colors on confusion matrix are a heat map of accuracy from 0% to 100%. Gray, dotted lines represent chance-level decoding accuracy (25%); #P = 0.07; **P < 0.01; ***P < 0.001. 1, conspecific song 1; 2, conspecific song 2; 3, conspecific song 3; O, observed; P, predicted; W, white noise.
Figure 3.
Figure 3.
Representative images of GPER1 expression in dNCM and vNCM. GPER1 is expressed in regions that are targeted for recording. (Left) Original magnification (×10), 3 × 3 stitch of medial section of forebrain (sagittal plane). Boxes indicate regions from which subsequent images were taken. (Middle and right) Each image was taken at ×60 original magnification within respective NCM regions. Images are z-stack maximum projections with 15-µm thickness.
Figure 4.
Figure 4.
Auditory responsiveness and coding are suppressed during GPER1 inactivation in narrow cells in the NCM of males only. (A, Left) Male auditory responsiveness (z score) with broad cells (gray, n = 7) and narrow cells (white, n = 5). (A, Inset) Firing frequency (in hertz) of single units for males for aCSF and G36 trials. Dashed lines are spontaneous activity (no song), and solid lines are stimulus-evoked activity (songs). Gray lines are broad cells, and black lines are narrow cells. There is not a significant difference in firing frequency between the pre-aCSF and G36 for broad cells, but there is a significant difference for narrow cells in stimulus-evoked firing. (Right) Female auditory responsiveness (z score) with broad cells (gray, n = 8) and narrow cells (white, n = 4). (Inset) Firing frequency (in hertz) of single units for females for aCSF and G36 trials. Dashed lines are spontaneous activity (no song), and solid lines are stimulus-evoked activity (songs). Gray lines are broad cells, and black lines are narrow cells. (B and C) Bar graphs for (B) timing accuracy and (C) count accuracy for broad (gray) and narrow (white) units in (left) males and (right) females. Confusion matrices are representative examples of the means of the narrow single units only. Colors on the confusion matrix are a heat map of accuracy from 0% to 100%. Male broad (n = 7), male narrow (n = 5), female broad (n = 8), and female narrow (n = 4). Bar graphs depict means and standard errors. Gray, dotted lines represents chance-level decoding accuracy (25%); *P < 0.05; **P < 0.01; ***P < 0.001. 1, conspecific song 1; 2, conspecific song 2; 3, conspecific song 3; B, broad cell; N, narrow cell; ns, not significant; O, observed; P, predicted; W, white noise.
Figure 5.
Figure 5.
No changes in auditory responsiveness with GPER1 activation. (A) Individual single units depicted across the three treatment trials for the high dose of G1 (100 µM) for both (left) males and (right) females. Individual data are depicted because of the low number of male narrow cells (n = 2). (Insets) Descriptive bar graphs of means and standard errors for visual comparison with other figures. (B) Means and standard errors for the low dose of G1 (100 nM) for (left) males and (right) females. Bar graphs depict means and standard error of the mean of conspecific song auditory responsiveness. Broad cells are depicted by gray bars and narrow cells by white bars. High dose: male broad (n = 8), male narrow (n = 2), female broad (n = 8), and female narrow (n = 5). Low dose: male broad (n = 9), male narrow (n = 12), female broad (n = 11), and female narrow (n = 9).
Figure 6.
Figure 6.
Only male narrow cells decrease in auditory coding accuracy with GPER1 activation. All bar graphs depict means and standard error of the mean for the average accuracy across all correctly assigned sound types for both broad (gray) and narrow (white) units. Confusion matrices are representative examples of the means of the narrow single units only. Colors on confusion matrices are a heat map of accuracy from 0% to 100%. Graphs depict the lower dose of the G1 (100 nM) experiment. (A) G1 application decreased timing accuracy in males. (B) Count accuracy was not affected for either sex or cell type by G1 application. Low dose: male broad (n = 9), male narrow (n = 12), female broad (n = 11), and female narrow (n = 9). Gray, dotted lines represent chance-level decoding accuracy (25%); *P < 0.05. 1, conspecific song 1; 2, conspecific song 2; 3, conspecific song 3; O, observed; P, predicted; W, white noise.
Figure 7.
Figure 7.
Anti-GAD67 targets some GABAergic neurons but not all. Images are (upper) a ×60 original magnification section of the cerebellum and (lower) a ×60 original magnification z-stack maximal projection from vNCM. DAPI (blue), CALB (green), and GAD67 (magenta) are shown. Notably, there is complete coexpression between CALB and GAD67 in the Purkinje cell bodies of the cerebellum, known GABAergic neurons, but no coexpression in vNCM. This depicts that anti-GAD67 is only targeting a subset of GABAergic neurons that in the NCM are distinct from other GABAergic subtypes, such as those labeled with CALB antibodies.
Figure 8.
Figure 8.
GPER1 expression and colocalization in GABAergic neurons are each not sexually dimorphic. (A) Representative images of dNCM for labeling of GPER1 (green), GAD67 (magenta), and DAPI (blue). Each image was taken at ×60 original magnification within respective regions. Images are z-stack maximal projections with 15 µm thickness. Triangles point to examples of a cell that expresses both GPER1 and GAD67. Arrows point to examples of a single label. Dashed boxes indicate sections of the image that are presented in (B) and (C) that have been zoomed in and resized for colocalization clarity. (B) Zoomed-in images from the representative female dNCM in (A). Triangles point to a cell expressing both GAD67 and GPER1. (C) Zoomed-in images from the representative male dNCM in (A). Arrows point to a single label of a GPER1+ cell. (D and E) Means and standard error of the mean error bars for (left) GPER1-positive neurons and (right) GAD67-positive neurons as a percentage of DAPI. (F) Means and standard error of the mean error bars for GPER1/GAD67-positive neurons as a percentage of GAD67 cells. Red bars are females (dNCM n = 6; vNCM n = 6), and blue bars are males (dNCM n = 7; vNCM n = 6); *P < 0.05.

Similar articles

Cited by

References

    1. Dorris DM, Cao J, Willett JA, Hauser CA, Meitzen J. Intrinsic excitability varies by sex in prepubertal striatal medium spiny neurons. J Neurophysiol. 2015;113(3):720–729. - PMC - PubMed
    1. Nottebohm F, Arnold AP. Sexual dimorphism in vocal control areas of the songbird brain. Science. 1976;194(4261):211–213. - PubMed
    1. Hamaide J, De Groof G, Van Steenkiste G, Jeurissen B, Van Audekerke J, Naeyaert M, Van Ruijssevelt L, Cornil C, Sijbers J, Verhoye M, Van der Linden A. Exploring sex differences in the adult zebra finch brain: in vivo diffusion tensor imaging and ex vivo super-resolution track density imaging. Neuroimage. 2017;146:789–803. - PubMed
    1. Krentzel AA, Remage-Healey L. Sex differences and rapid estrogen signaling: a look at songbird audition. Front Neuroendocrinol. 2015;38:37–49. - PMC - PubMed
    1. Brenowitz EA, Remage-Healey L. It takes a seasoned bird to be a good listener: communication between the sexes. Curr Opin Neurobiol. 2016;38:12–17. - PMC - PubMed

Publication types

MeSH terms