

Identify Down syndrome transcriptome associations using integrative analysis of microarray database and correlation-interaction network
- PMID: 29351810
- PMCID: PMC5775600
- DOI: 10.1186/s40246-018-0133-y
Identify Down syndrome transcriptome associations using integrative analysis of microarray database and correlation-interaction network
Abstract
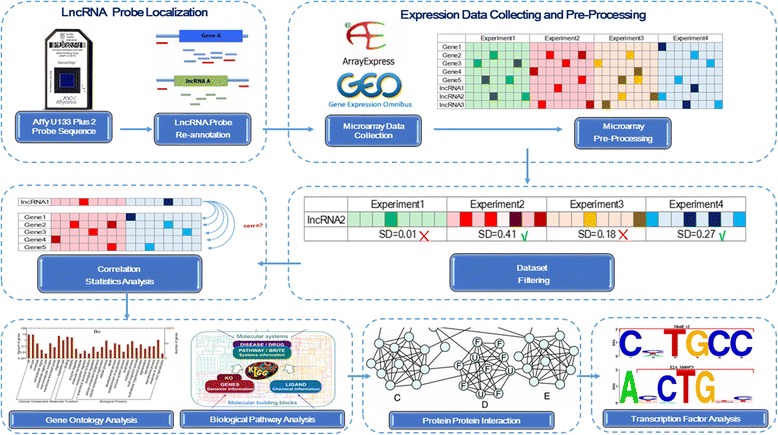
Background: Long non-coding RNAs (lncRNAs) have previously been emerged as key players in a series of biological processes. Dysregulation of lncRNA is correlated to human diseases including neurological disorders. Here, we developed a multi-step bioinformatics analysis to study the functions of a particular Down syndrome-associated gene DSCR9 including the lncRNAs. The method is named correlation-interaction-network (COIN), based on which a pipeline is implemented. Co-expression gene network analysis and biological network analysis results are presented.
Methods: We identified the regulation function of DSCR9, a lncRNA transcribed from the Down syndrome critical region (DSCR) of chromosome 21, by analyzing its co-expression genes from over 1700 sets and nearly 60,000 public Affymetrix human U133-Plus 2 transcriptional profiling microarrays. After proper evaluations, a threshold is chosen to filter the data and get satisfactory results. Microarray data resource is from EBI database and protein-protein interaction (PPI) network information is incorporated from the most complete network databases. PPI integration strategy guarantees complete information regarding DSCR9. Enrichment analysis is performed to identify significantly correlated pathways.
Results: We found that the most significant pathways associated with the top DSCR9 co-expressed genes were shown to be involved in neuro-active ligand-receptor interaction (GLP1R, HTR4, P2RX2, UCN3, and UTS2R), calcium signaling pathway (CACNA1F, CACNG4, HTR4, P2RX2, and SLC8A3), neuronal system (KCNJ5 and SYN1) by the KEGG, and GO analysis. The A549 and U251 cell lines with stable DSCR9 overexpression were constructed. We validated 10 DSCR9 co-expression genes by qPCR in both cell lines with over 70% accuracy.
Conclusions: DSCR9 was highly correlated with genes that were known as important factors in the developments and functions of nervous system, indicating that DSCR9 may regulate neurological proteins regarding Down syndrome and other neurological-related diseases. The pipeline can be properly adjusted to other applications.
Keywords: Correlation-interaction-network; DSCR9; Down syndrome; Neurological diseases; Protein–protein interaction; lncRNA.
Conflict of interest statement
Ethics approval and consent to participate
Not applicable.
Competing interests
The authors declare that they have no competing interests.
Figures


References
Publication types
MeSH terms
Substances
Supplementary concepts
Grants and funding
- No.2014234/Guangzhou Science and Technology Program/International
- No.2013B022000005/Guangdong Science and Technology Program/International
- No.81671470/he National Natural Science Foundation of China/International
- 2015A21/Youth Scientific Project Foundation of Guangzhou Medical University/International
- 2015A030313474/Guangdong Natural Science Foundation/International
LinkOut - more resources
Full Text Sources
Other Literature Sources
Medical
