. 2018 Apr 1;78(7):1579-1591.
doi: 10.1158/0008-5472.CAN-17-3486. Epub 2018 Jan 19.

Integrative Genomic Analysis Predicts Causative Cis-Regulatory Mechanisms of the Breast Cancer-Associated Genetic Variant rs4415084

Affiliations

Integrative Genomic Analysis Predicts Causative Cis-Regulatory Mechanisms of the Breast Cancer-Associated Genetic Variant rs4415084

Yi Zhang et al. Cancer Res. .

Abstract

Previous genome-wide association studies (GWAS) have identified several common genetic variants that may significantly modulate cancer susceptibility. However, the precise molecular mechanisms behind these associations remain largely unknown; it is often not clear whether discovered variants are themselves functional or merely genetically linked to other functional variants. Here, we provide an integrated method for identifying functional regulatory variants associated with cancer and their target genes by combining analyses of expression quantitative trait loci, a modified version of allele-specific expression that systematically utilizes haplotype information, transcription factor (TF)-binding preference, and epigenetic information. Application of our method to a breast cancer susceptibility region in 5p12 demonstrates that the risk allele rs4415084-T correlates with higher expression levels of the protein-coding gene mitochondrial ribosomal protein S30 (MRPS30) and lncRNA RP11-53O19.1 We propose an intergenic SNP rs4321755, in linkage disequilibrium (LD) with the GWAS SNP rs4415084 (r2 = 0.988), to be the predicted functional SNP. The risk allele rs4321755-T, in phase with the GWAS rs4415084-T, created a GATA3-binding motif within an enhancer, resulting in differential GATA3 binding and chromatin accessibility, thereby promoting transcription of MRPS30 and RP11-53O19.1. MRPS30 encodes a member of the mitochondrial ribosomal proteins, implicating the role of risk SNP in modulating mitochondrial activities in breast cancer. Our computational framework provides an effective means to integrate GWAS results with high-throughput genomic and epigenomic data and can be extended to facilitate rapid functional characterization of other genetic variants modulating cancer susceptibility.Significance: Unification of GWAS results with information from high-throughput genomic and epigenomic profiles provides a direct link between common genetic variants and measurable molecular perturbations. Cancer Res; 78(7); 1579-91. ©2018 AACR.


Conflict of interest statement

Conflict of interest: The authors declare no potential conflicts of interest.

Figures

Figure 1
Figure 1
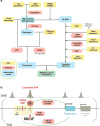
(a) Schematic representation of the integrated analysis workflow for identifying (causative SNP, TF, target gene) triplets. For inferring target genes (left part), eQTL analysis and a modified version of allele-specific expression analysis using the TCGA data are combined. For identifying causative SNPs and corresponding TFs (right part), epigenetics information, motif analysis and TF-target expression correlation analysis are used to filter the list of candidate causative variants. ChIP-seq data, allele-specific binding events and 3D chromatin interaction data are analysed when available. SNP: single-nucleotide polymorphism; eQTL: expression quantitative trait loci; LCASE: local chromosome allele-specific expression; LD: linkage disequilibrium; DHS: DNase I hypersensitive sites; TF: transcription factor; ASB: allele-specific binding; ChIA-PET: Chromatin Interaction Analysis by Paired-End Tag Sequencing; Hi-C: High-throughput chromosome conformation capture. (b) Visual illustration of the genomic analysis pipeline. Candidate SNPs are selected among the SNPs in strong LD with a GWAS SNP (yellow block) by overlapping with DHS (top track). The entire analysis is restricted to the topologically associated domain (TAD) containing the GWAS SNP.
Figure 2
Figure 2
Linkage structure and epigenetic annotation in the 5p12 region. Top triangle shows the linkage (color-coded by r2 value) among 5p12 SNPs ordered according to their genomic locations. Middle track shows genes annotated by GENCODE v19. In the lower tracks, three GWAS SNPs in the 5p12 region are shown, followed by ChromHMM enhancer annotations in the breast cancer cell line MCF-7 and human mammary epithelial cells (HMEC). DNase I hypersensitive sites in T-47D and MCF-7 are also shown to represent open chromatin regions.
Figure 3
Figure 3
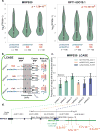
The risk allele of the GWAS SNP rs4415084 correlates with elevated MRPS30/RP11-53O19.1 expression. (a) Violin plots of MRPS30 and RP11-53O19.1 expression levels divided into the imputed genotypes at rs4415084, using the TCGA ER+ breast cancer patient data. The p-values are for the multivariate linear regression coefficients of genotype. See Supplementary Table 4 for a full list of eQTL genes and GWAS SNPs in 5p12. (b) A schematic representation of local chromosome allele-specific expression (LCASE) analysis. For a certain exonic SNP of interest, we obtain all patients who have heterozygous genotypes both at the GWAS SNP and at the exonic SNP. Haplotype phasing is performed for the chromosome segment covering the GWAS SNP, the exonic SNP and all intermediate SNPs (Methods). The reference and alternative alleles of a biallelic SNP are denoted as 0 and 1, respectively. In this figure, patient 1 and patient 2 have the 1 allele of the exonic SNP phased with the GWAS risk allele, whereas patient K has the 0 allele. RNA-seq read coverage is then counted in each patient to measure differential transcription activity between the risk chromosome (red) and the protective chromosome (blue). (c) LCASE analysis of exonic SNPs in the protein-coding gene MRPS30. The proportion of reads containing the protective alleles are plotted with the confidence intervals. Four of the six patient samples show significantly fewer reads emanating from the chromosome harboring the protective allele of rs4415084 (one-sided binomial test; p = 1.3 × 10⁻⁴, p = 9.7 × 10⁻¹⁷ for patient 1 and patient 2 at rs61754779, respectively; p = 6.7 × 10−47 for patient 4 at rs34522103; p = 1.2 × 10⁻³ for patient 5 at rs79210252), while patient 3 and patient 6 have non-significant p-values. (d) The genomic locations of LCASE SNPs in the protein-coding MRPS30 and MRPS30 3’ non-coding transcript. The p-values are from Wilcoxon signed-rank test with the red color showing transcription preference towards the risk chromosome.
Figure 4
Figure 4
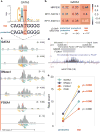
The predicted causal SNP rs4321755 in LD with the GWAS SNP rs4415084 may regulate GATA3 binding. (a) Subsequence containing the risk allele T of rs4321755 matches the GATA3 motif, while the protective allele C disrupts the motif. The risk and protective alleles are determined by phasing with the alleles of GWAS SNP rs4415084 (r2 = 0.988). (b) GATA3 expression positively correlates with predicted target gene expression. The correlation structure depends on the rs4321755 genotype status; i.e., as the number of risk allele increases, the correlation also increases. (c) ChIP-seq and DNase-seq data in T-47D show that rs4321755 is at the center of GATA3, FOXA1, and DNase I peaks (two replicate experiments of DNase-seq are shown: ENCODE accessions ENCFF001EGW and ENCFF001EHA). Shown for each experiment are the read coverage and raw aligned reads (positive strand: yellow; negative strand: cyan). In the read coverage figure, the range of y-axis values is indicated on top right, and the coverage of the putative causative SNP is color-coded based on the risk (red) and protective (blue) allele counts. (d) Zoomed-in view of ENCODE TF binding and PhyloP conservation track near rs4321755. (e) GATA3 ChIP-seq, PGR ChIP-seq and DNase-seq data show a significant skew towards the rs4321755-T risk allele. Replicates are pooled together and reads are deduplicated; the p-values are calculated by one-sided binomial test.
Figure 5
Figure 5
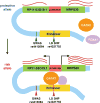
An illustration of the regulation model for MRPS30/RP11-53O19.1. The top chromosome carrying the protective allele C of the causal SNP rs4321755 has a disrupted GATA3 binding motif, thereby weakening the association between MRPS30/RP11-53O19.1 divergent promoter and the enhancer harboring the SNP. By contrast, the bottom chromosome carrying the risk allele rs4321755-T acquires a strong GATA3 motif, resulting in stronger binding of GATA3 and recruitment of other cofactors like FOXA1 and PGR, which together make this enhancer more active in regulating its target genes MRPS30 and RP11-53O19.1 via chromatin looping.

References

    1. Welter D, MacArthur J, Morales J, Burdett T, Hall P, Junkins H, et al. The NHGRI GWAS Catalog, a curated resource of SNP-trait associations. Nucleic Acids Res. 2014;42 - PMC - PubMed
    1. Maurano MT, Humbert R, Rynes E, Thurman RE, Haugen E, Wang H, et al. Systematic Localization of Common Disease-Associated Variation in Regulatory DNA. Science. 2012;337:1190–5. - PMC - PubMed
    1. Li Q, Seo J-H, Stranger B, McKenna A, Pe’er I, Laframboise T, et al. Integrative eQTL-based analyses reveal the biology of breast cancer risk loci. Cell. 2013;152:633–41. - PMC - PubMed
    1. Boyle AP, Hong EL, Hariharan M, Cheng Y, Schaub MA, Kasowski M, et al. Annotation of functional variation in personal genomes using RegulomeDB. Genome Res. 2012;22:1790–7. - PMC - PubMed
    1. Li Q, Seo JH, Stranger B, McKenna A, Pe’Er I, Laframboise T, et al. Cell. Vol. 152. Elsevier Inc.; 2013. Integrative eQTL-based analyses reveal the biology of breast cancer risk loci; pp. 633–41. - PMC - PubMed

Publication types

MeSH terms