. 2018 Feb 6;115(6):E1147-E1156.
doi: 10.1073/pnas.1717802115. Epub 2018 Jan 19.

Saa3 is a key mediator of the protumorigenic properties of cancer-associated fibroblasts in pancreatic tumors

Affiliations

Saa3 is a key mediator of the protumorigenic properties of cancer-associated fibroblasts in pancreatic tumors

Magdolna Djurec et al. Proc Natl Acad Sci U S A. .

Abstract

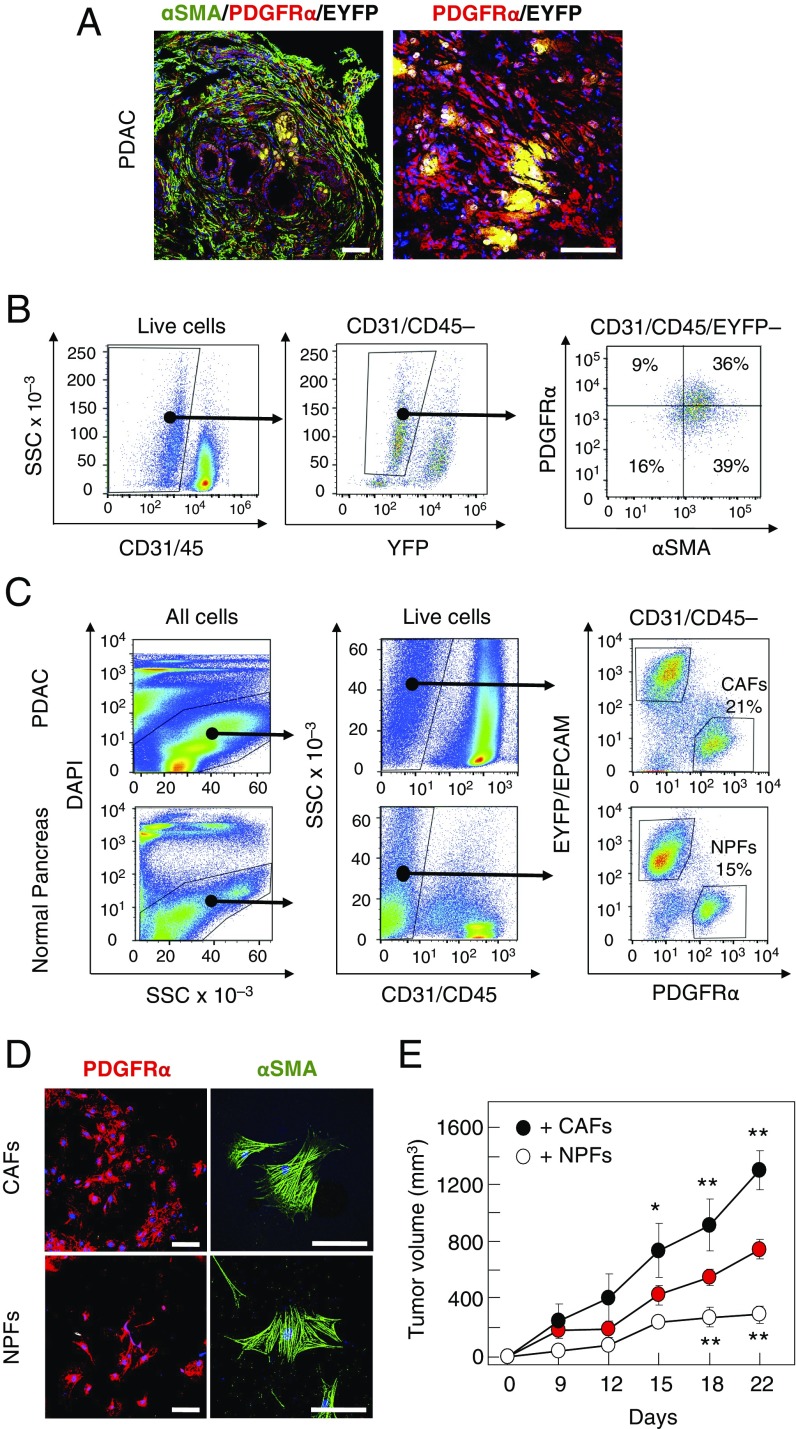
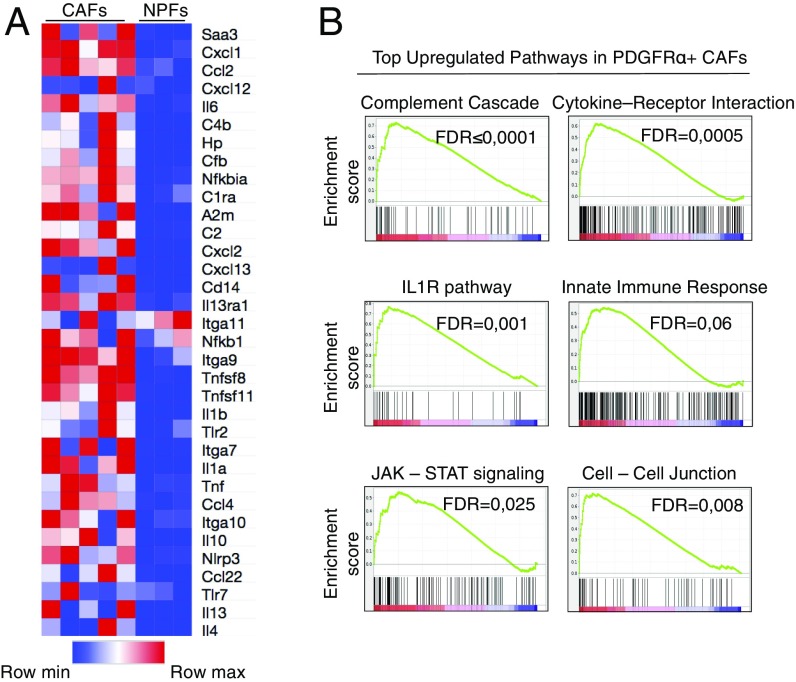
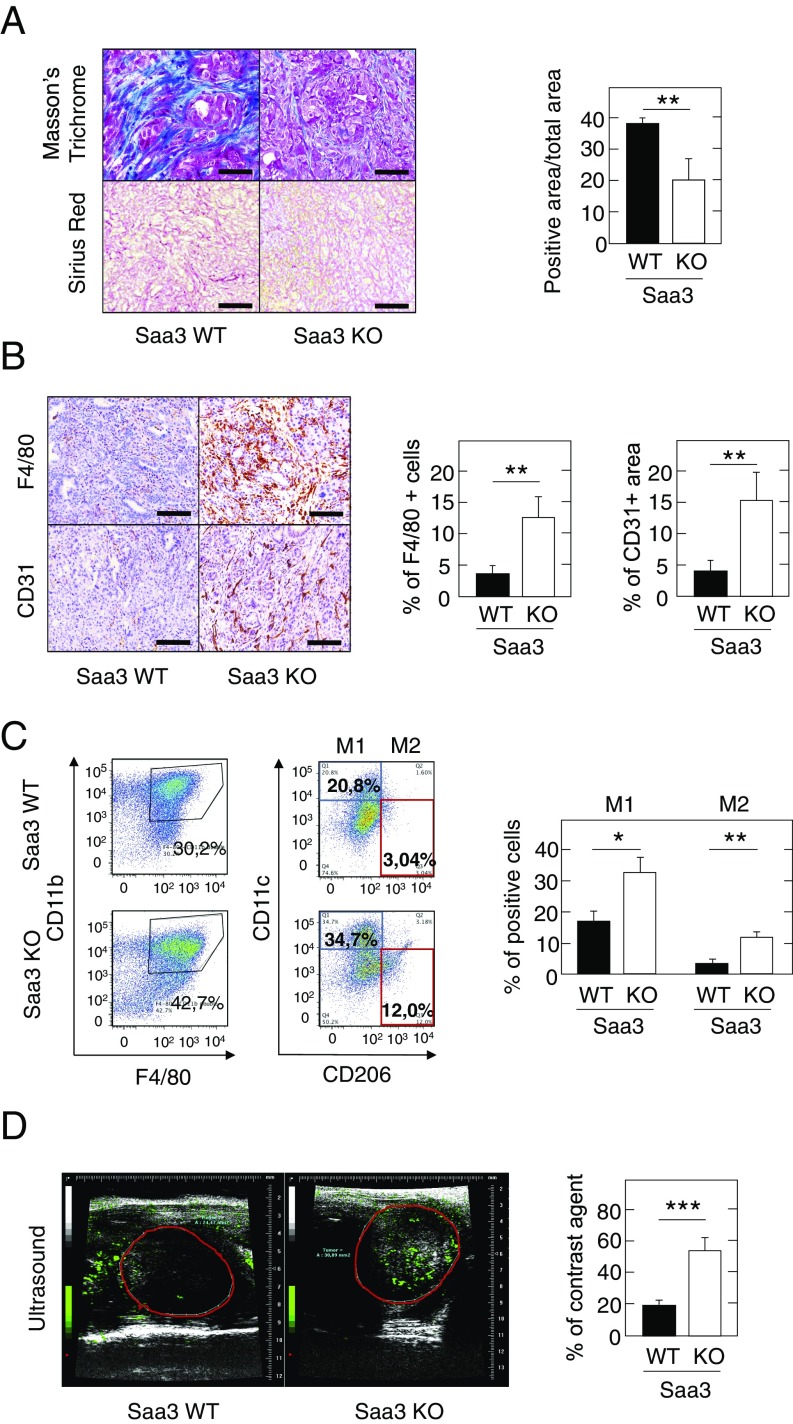
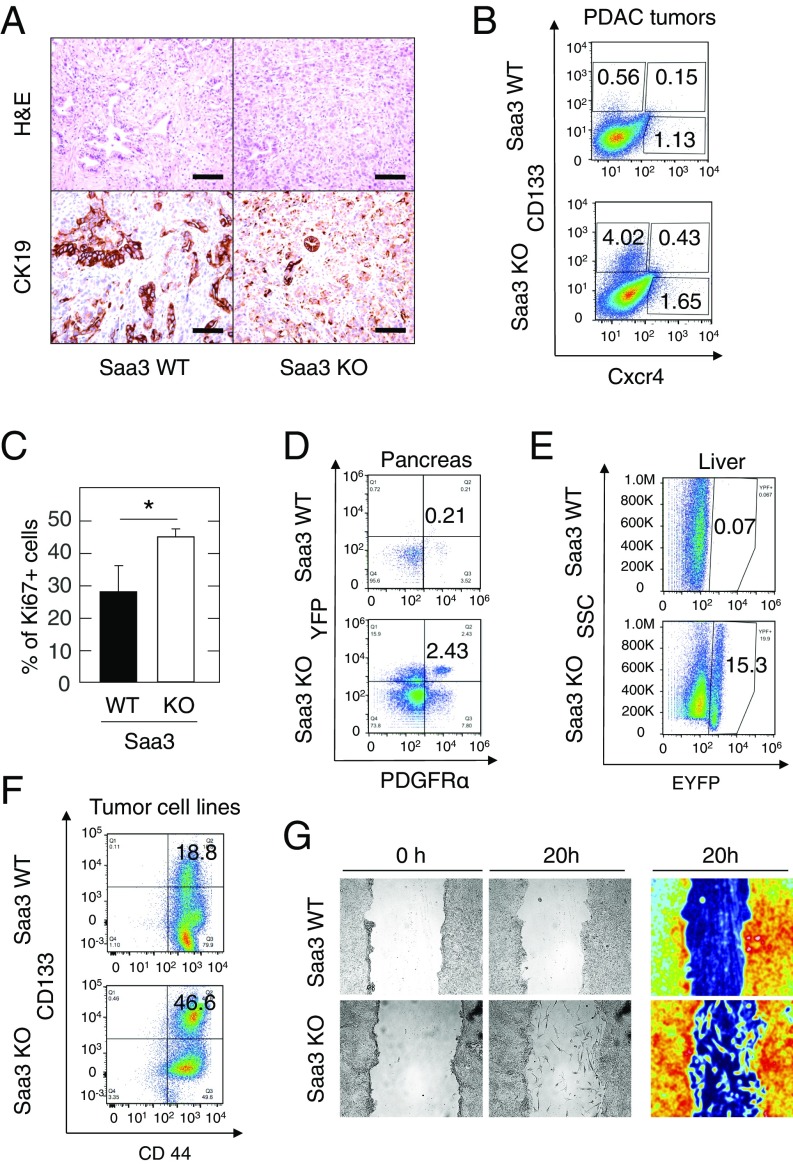
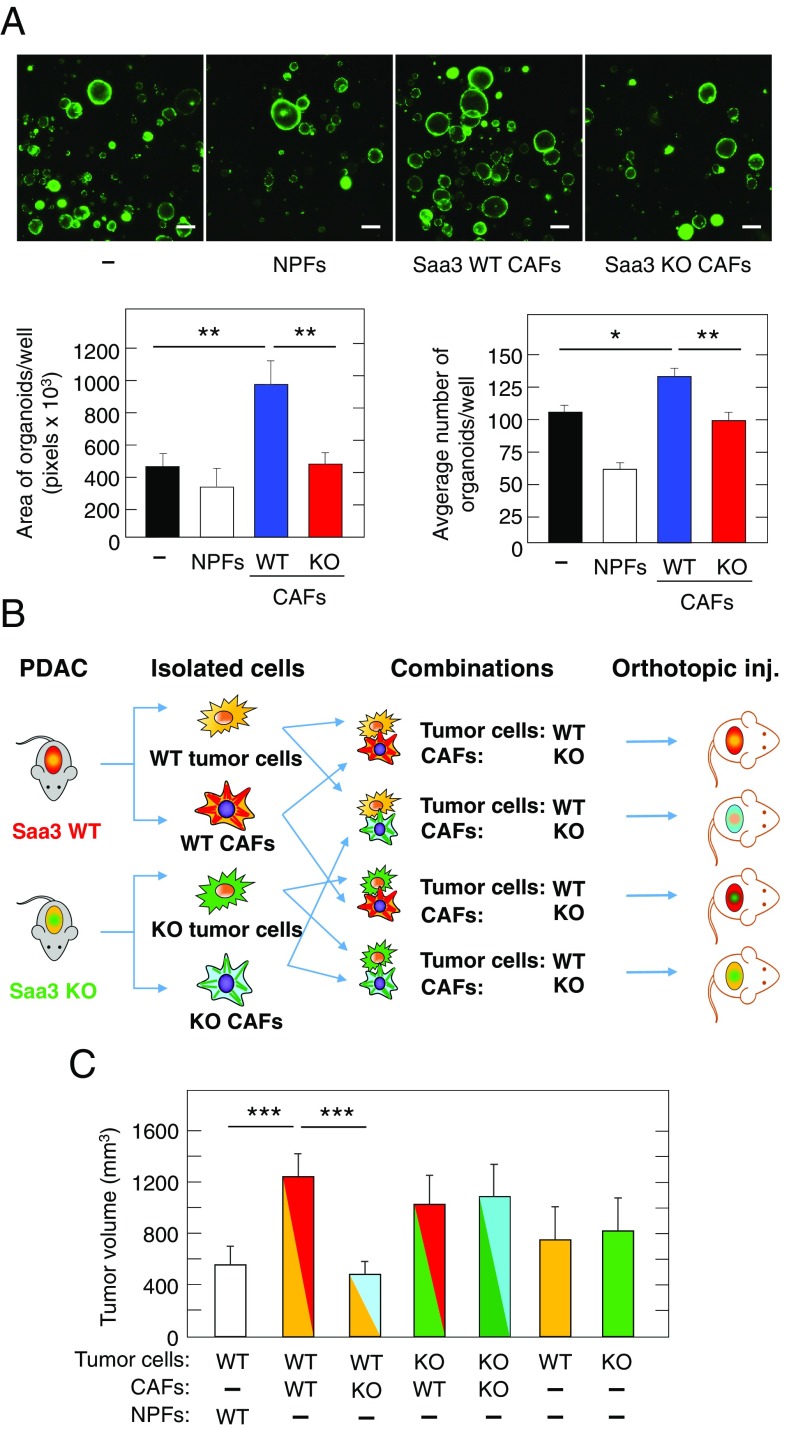
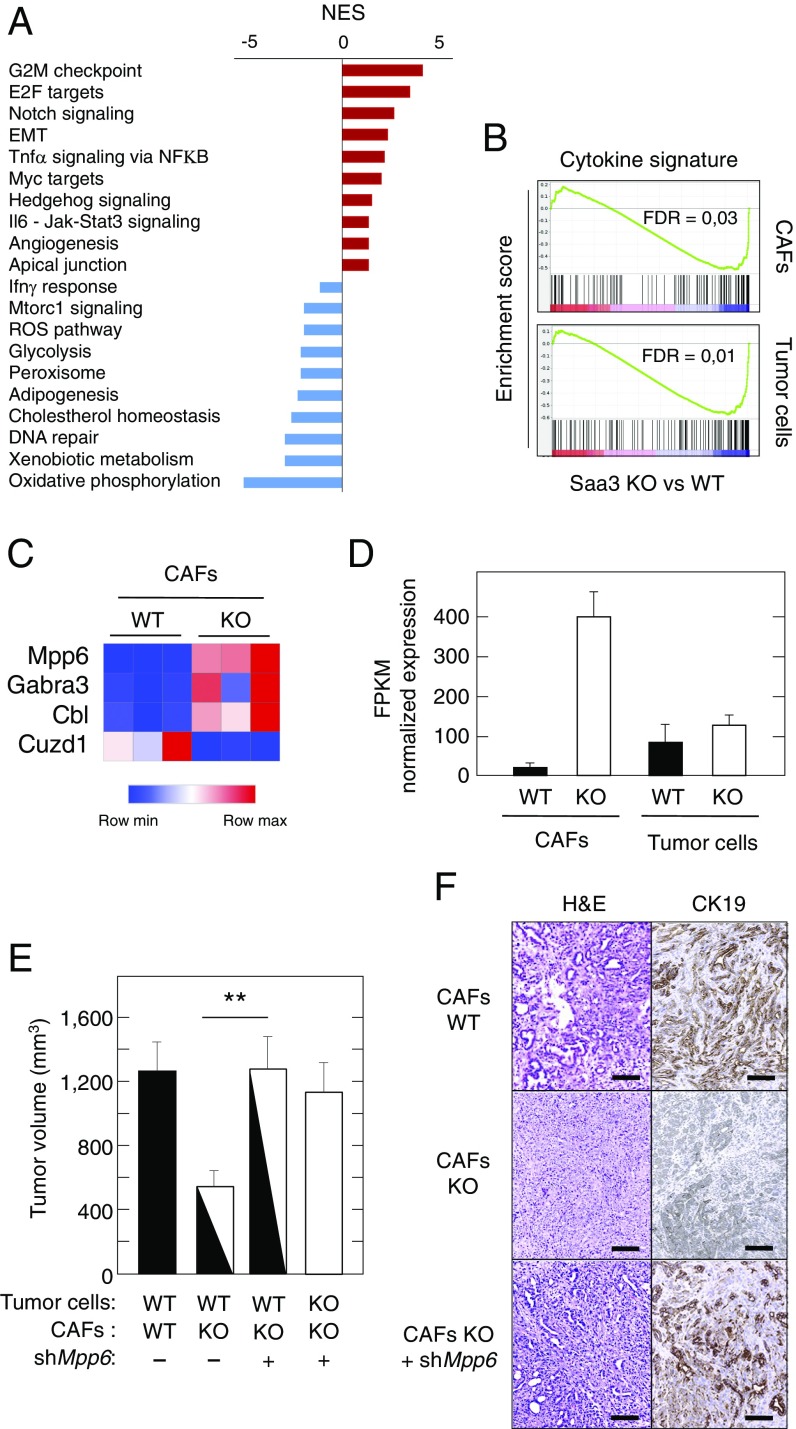
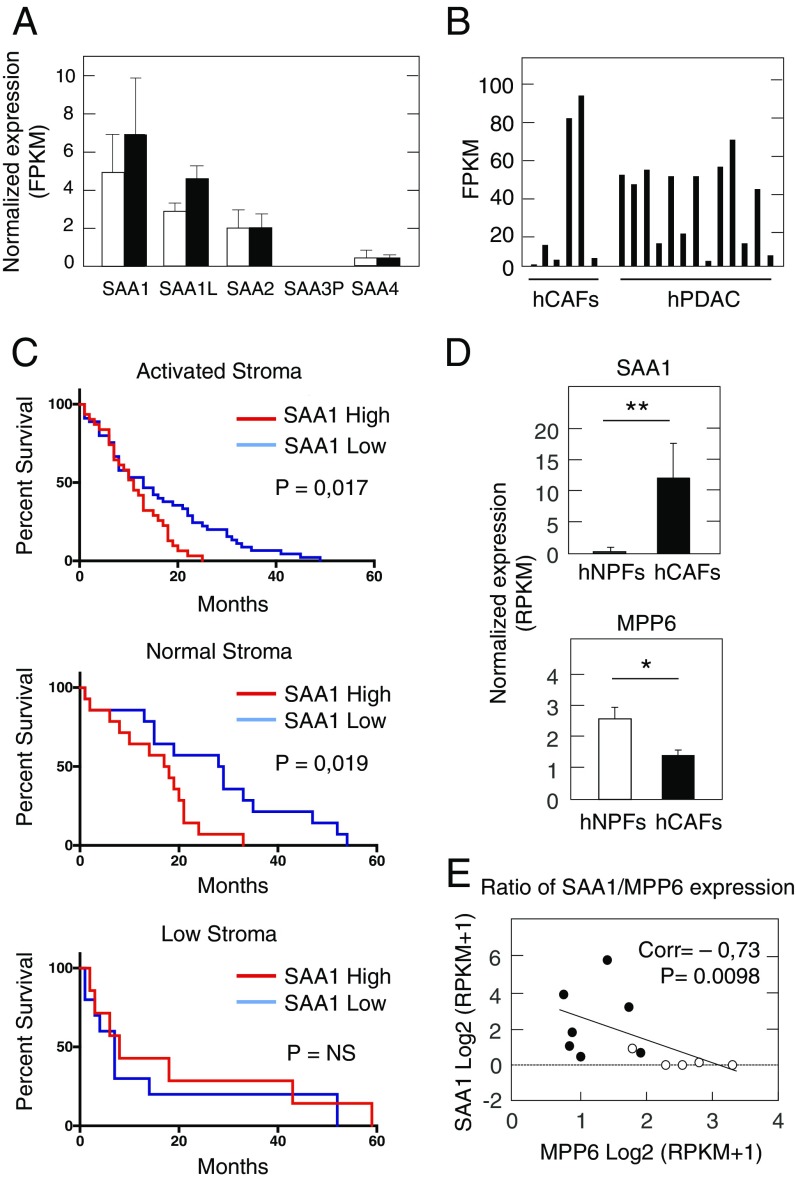
Pancreatic ductal adenocarcinoma (PDAC) is characterized by the presence of abundant desmoplastic stroma primarily composed of cancer-associated fibroblasts (CAFs). It is generally accepted that CAFs stimulate tumor progression and might be implicated in drug resistance and immunosuppression. Here, we have compared the transcriptional profile of PDGFRα+ CAFs isolated from genetically engineered mouse PDAC tumors with that of normal pancreatic fibroblasts to identify genes potentially implicated in their protumorigenic properties. We report that the most differentially expressed gene, Saa3, a member of the serum amyloid A (SAA) apolipoprotein family, is a key mediator of the protumorigenic activity of PDGFRα+ CAFs. Whereas Saa3-competent CAFs stimulate the growth of tumor cells in an orthotopic model, Saa3-null CAFs inhibit tumor growth. Saa3 also plays a role in the cross talk between CAFs and tumor cells. Ablation of Saa3 in pancreatic tumor cells makes them insensitive to the inhibitory effect of Saa3-null CAFs. As a consequence, germline ablation of Saa3 does not prevent PDAC development in mice. The protumorigenic activity of Saa3 in CAFs is mediated by Mpp6, a member of the palmitoylated membrane protein subfamily of the peripheral membrane-associated guanylate kinases (MAGUK). Finally, we interrogated whether these observations could be translated to a human scenario. Indeed, SAA1, the ortholog of murine Saa3, is overexpressed in human CAFs. Moreover, high levels of SAA1 in the stromal component correlate with worse survival. These findings support the concept that selective inhibition of SAA1 in CAFs may provide potential therapeutic benefit to PDAC patients.

Keywords: CAFs; PDAC; Saa3; mouse models; stroma.


Conflict of interest statement

The authors declare no conflict of interest.

Figures

Fig. 1.
Fig. 1.
Protumorigenic properties of PDGFRα+ CAFs. (A, Left) Immunofluorescence staining with anti-αSMA (green) and anti-PDGFRα (red) antibodies and with EYFP (yellow) of a KPeCY PDAC tumor. (Right) Higher magnification of PDGFRα+ (red) and EYFP+ (yellow) cells. (Scale bars, 100 μm.) (B, Left) FACS analysis of fresh tumor samples with CD31/CD45 and EYFP markers. (Right) FACS analysis of CD31/CD45/EYFP cells with anti-αSMA and anti-PDGFRα antibodies. The percentages of αSMA and PDGFRα single-positive cells as well as αSMA/PDGFRα double-negative and double-positive cells are indicated. (C) Cell sorting of KPeCY PDAC tumors and normal pancreata from control Elas-tTA/tetO-Cre;Rosa26+/LSLEYFP mice selected with DAPI, anti-CD31 and anti-CD45, anti-EpCAM, and anti-PDGFRα and EYFP. The percentages of NPFs and CAFs are indicated. (D) Immunofluorescence staining of sorted CAFs and NPFs after expansion in culture with anti-αSMA (green) and anti-PDGFRα (red) antibodies. (Scale bars, 50 μm.) (E) Growth of PDAC tumor cells (0.5 × 10⁶) injected s.c. into immunocompromised mice either alone (red circles) or coinjected with the same amount of CAFs (black circles) or NPFs (open circles). *P < 0.05; **P < 0.001.
Fig. 2.
Fig. 2.
Transcriptional profiling of CAFs. (A) Heat map representing color-coded expression levels of differentially expressed inflammatory genes in CAFs (n = 5) vs. NPFs (n = 3). The heat map was generated from differential expression analysis, in which data were sorted by FPKM (fragments per kilobase of transcript per million mapped reads) expression value and log2 fold change with a q-value ≤0.05. The specific inflammatory gene set was selected from publicly available databases. (B) GSEA of CAFs significantly up-regulated in inflammatory and cell-adhesion pathways.
Fig. 3.
Fig. 3.
Characterization of the stromal component of Saa3-null tumors. (A, Left) Masson’s trichrome and Sirius Red staining of collagen in Saa3-competent (WT) and Saa3-null (KO) tumors. (Scale bars, 50 μm.) (Right) Quantitative analysis of Masson’s trichrome-stained sections of Saa3-competent (WT) and Saa3-null (KO) tumors (n = 4). (B, Left) Representative images of F4/80 and CD31 immunostaining in Saa3-competent (WT) and Saa3-null (KO) tumors. (Scale bars, 50 μm.) (Right) Quantitative analysis of F4/80- and CD31-stained sections of Saa3-competent (WT) and Saa3-null (KO) tumors (n = 5). (C, Left) FACS analysis of fresh Saa3-competent (WT) and Saa3-null (KO) tumor samples with anti-F4/80 and anti-CD11b antibodies. (Center) FACS analysis of F4/80+/CD11b+ double-positive macrophages with anti-CD11c and anti-CD206 antibodies. The percentage of M1 (CD11chigh/CD206low) (blue square) and M2 (CD11clow/CD206high) (red square) macrophage populations is indicated for each tumor type. (Right) Quantitative analysis of M1 and M2 macrophages in Saa3-competent (WT) and Saa3-null (KO) tumors (n = 2). (D, Left) Micro-ultrasound images of Saa3-competent (WT) and Saa3-null (KO) tumors after injection of contrast agent. (Right) Quantitative analysis of vessel density in Saa3-competent (WT) and Saa3-null KO) tumors (n = 5). *P < 0.05; **P < 0.001; ***P < 0.001.
Fig. 4.
Fig. 4.
Phenotypic properties of Saa3-null tumor cells. (A) H&E staining (Upper) and CK19 immunostaining (Lower) of Saa3-competent (WT) and Saa3-null (KO) tumors. (Scale bars, 50 μm.) (B) FACS analysis of fresh tumor samples of Saa3-competent (WT) and Saa3-null (KO) tumors from KPeCY mice with anti-CD133 and anti-CXCR4. (C) Quantitative analysis of Ki67+ cells in Saa3-competent (WT) and Saa3-null (KO) tumor sections. (D) FACS analysis of EYFP-expressing PDGFRα+ pancreatic tumor cells in pancreas isolated from 8-wk-old Saa3-competent (WT) and Saa3-null (KO) KPeCY mice. (E) FACS analysis of EYPF-expressing cells in livers isolated from the same mice. (F) FACS analysis of pancreatic tumor cell lines with anti-CD133 and anti-CD44. (G, Left and Center) Migratory properties of Saa3-competent (WT) and Saa3-null (KO) tumor cells in an in vitro scratch assay. (Right) A color-enhanced picture for better visualization. *P < 0.05.
Fig. 5.
Fig. 5.
Cross talk between pancreatic tumor cells and CAFs in the presence and absence of Saa3. (A, Upper) Cultures of EYFP tumor organoids grown in the presence of NPFs or Saa3-competent (WT) or Saa3-null (KO) CAFs. (Scale bars, 100 μm.) (Lower) Quantification of area (Left) and number of organoids (Right) under the indicated culture conditions. (B) Diagram depicting the in vivo orthotopic tumor assays in immunodeficient mice carried out to determine the protumorigenic properties of Saa3-competent (WT) (red) and Saa3-null KO) (light blue) CAFs on pancreatic tumor cells isolated from Saa3-competent (WT) (yellow) and Saa3-null (KO) (green) tumors. (C) Quantitative analysis of orthotopic tumor growth in immunodeficient mice inoculated with the indicated combinations of Saa3-competent (WT) and Saa3-null (KO) CAFs and pancreatic tumor cells. Color coding is as in B. NPFs (open bar) were used as a negative control. *P < 0.05; **P < 0.001; ***P < 0.001.
Fig. 6.
Fig. 6.
Transcriptional profiling of Saa3-null CAFs and pancreatic tumor cells. (A) GSEA pathway analysis of Saa3-null vs. Saa3-proficient CAFs. The normalized enrichment score (NES) ranking was generated by the GSEA. (B) GSEA analysis of a specific cytokine signature (144 cytokines) in Saa3-null (KO) CAFs and pancreatic tumor cells. (C) Heat map of the differentially expressed genes in Saa3-null (KO) CAFs compared with Saa3-competent (WT) CAFs. (D) RNAseq analysis of Mpp6 expression in Saa3-competent (WT, solid bars) and Saa3-null (KO, open bars) CAFs and tumor cells. (E) Tumor growth of orthotopic allografts of immunocompromised mice of Saa3-competent (WT) and Saa3-null (KO) pancreatic tumor cells in the presence of Saa3-competent (WT) and Saa3-null (KO) CAFs treated (+) or nontreated (−) with a shRNA against Mpp6. Tumor volume is indicated by solid (WT cells), open (KO cells), and mixed solid/open (WT and KO cells) bars. (F) Images of H&E and CK19 staining of orthotopic tumors illustrated in E. (Scale bars, 100 μm.) **P < 0.001.
Fig. 7.
Fig. 7.
SAA1 and MPP6 expression in human PDAC tumors. (A) Normalized gene-expression values of SAA family members in human NPFs (open bars) and CAFs (solid bars) by RNAseq. (B) FPKM values of SAA1 expression by RNAseq in human CAFs and PDAC samples obtained from Moffitt’s dataset (7). (C) Kaplan–Meier survival analysis of PDAC patients with high (red) or low (blue) SAA1 expression levels classified by the presence of activated (Top) or normal (Middle) stroma signatures and in PDAC tumors with low stroma content (Bottom) based on microarray data from Moffitt’s dataset (7). (D) SAA1 (Upper) and MPP6 (Lower) expression in freshly sorted human NPFs (open bars) (n = 5) and CAFs (solid bars) (n = 7). (E) Correlation of SAA1 and MPP6 expression in freshly sorted human CAFs (solid circles) (n = 7) and human NPFs (open circles) (n = 5). Spearman’s correlation (Corr) and the P value are indicated. *P < 0.05;**P < 0.001.

References

    1. Siegel RL, Miller KD, Jemal A. Cancer statistics, 2017. CA Cancer J Clin. 2017;67:7–30. - PubMed
    1. Rahib L, et al. Projecting cancer incidence and deaths to 2030: The unexpected burden of thyroid, liver, and pancreas cancers in the United States. Cancer Res. 2014;74:2913–2921. - PubMed
    1. Hidalgo M. Pancreatic cancer. N Engl J Med. 2010;362:1605–1617. - PubMed
    1. Xing F, Saidou J, Watabe K. Cancer associated fibroblasts (CAFs) in tumor microenvironment. Front Biosci (Landmark Ed) 2010;15:166–179. - PMC - PubMed
    1. von Ahrens D, Bhagat TD, Nagrath D, Maitra A, Verma A. The role of stromal cancer-associated fibroblasts in pancreatic cancer. J Hematol Oncol. 2017;10:76. - PMC - PubMed

Publication types

MeSH terms