. 2018 Mar 5;217(3):1113-1128.
doi: 10.1083/jcb.201709064. Epub 2018 Jan 19.

Spatiotemporal organization of exocytosis emerges during neuronal shape change

Affiliations

Spatiotemporal organization of exocytosis emerges during neuronal shape change

Fabio L Urbina et al. J Cell Biol. .

Abstract

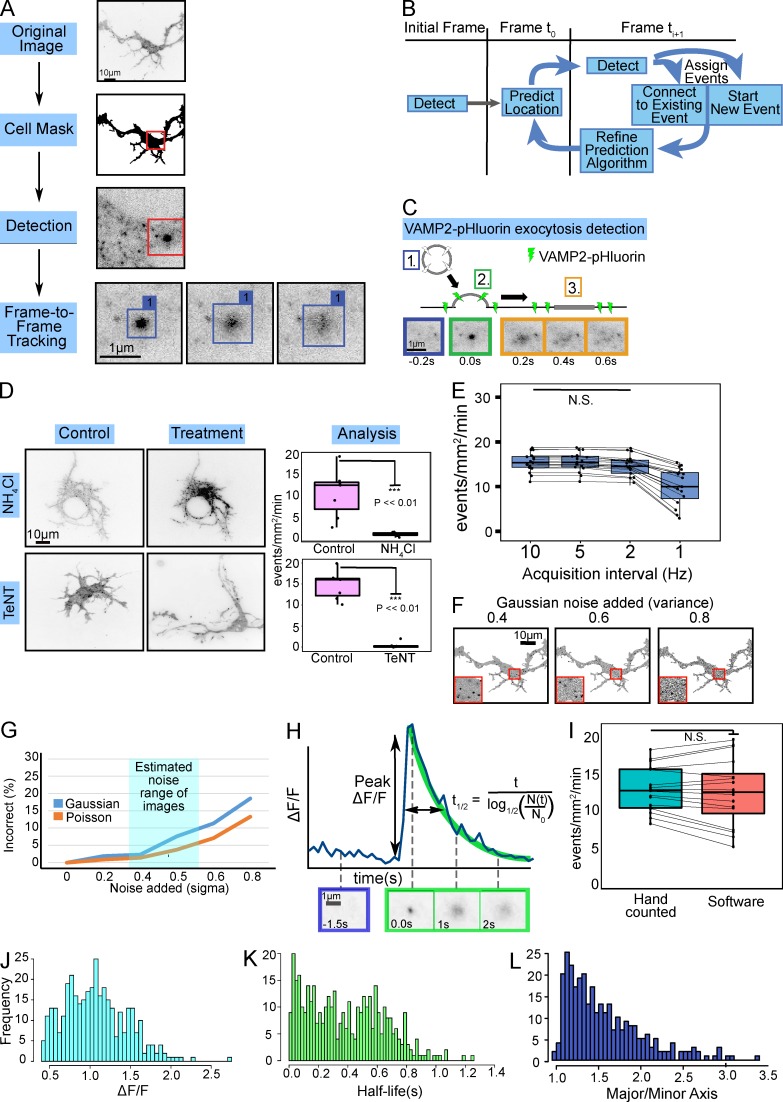
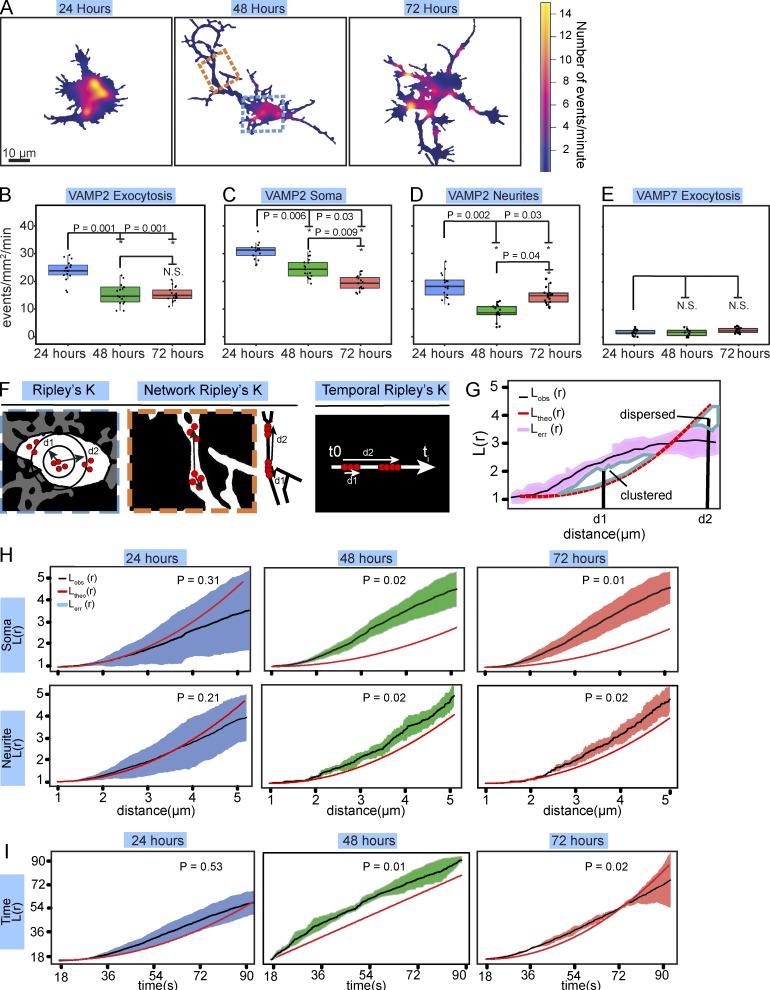
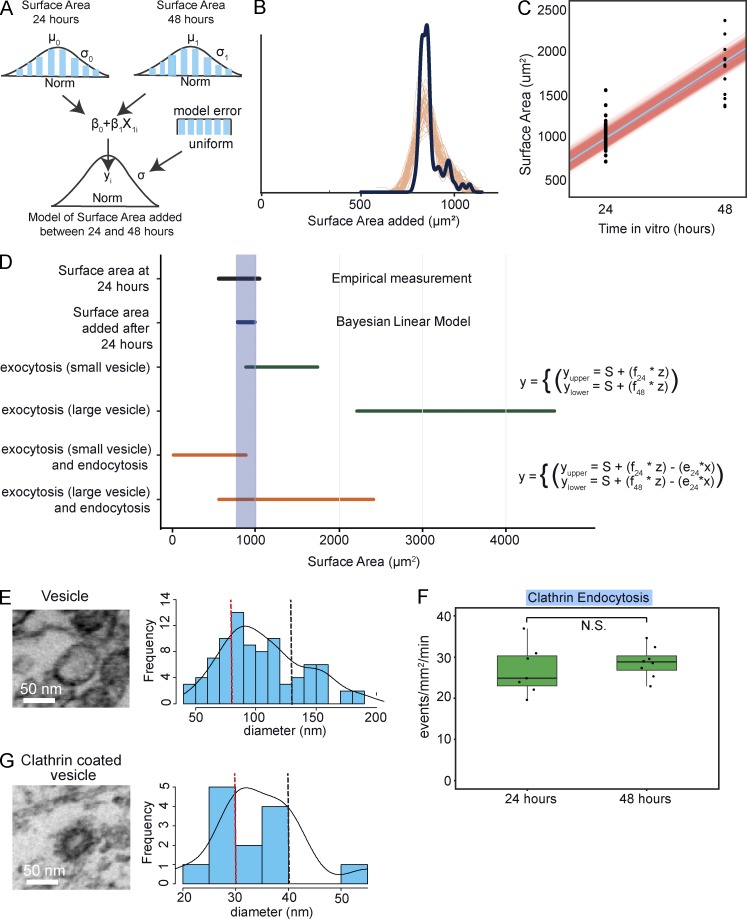
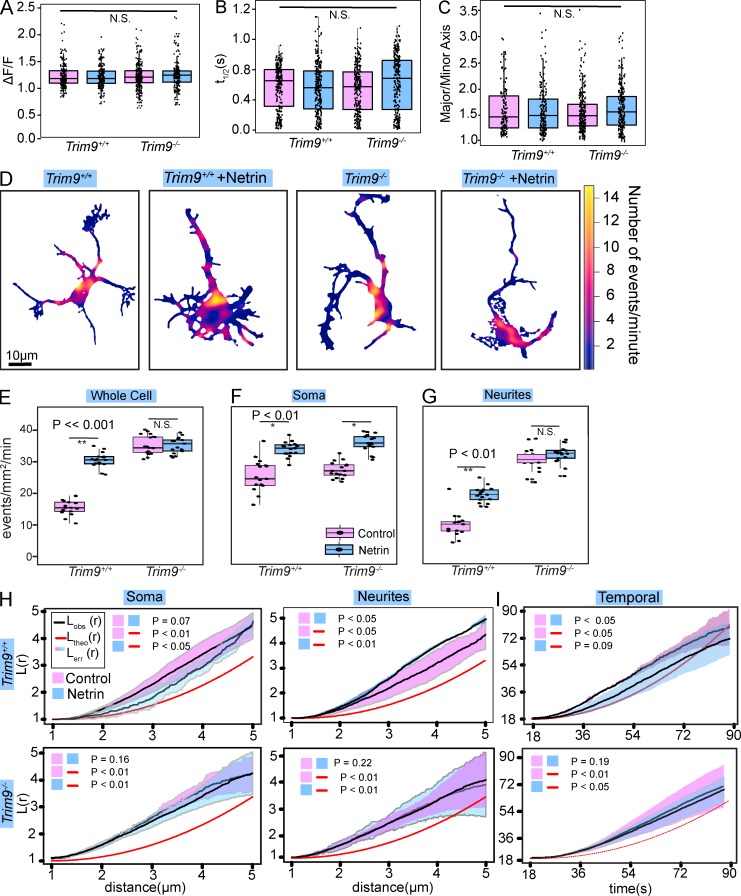
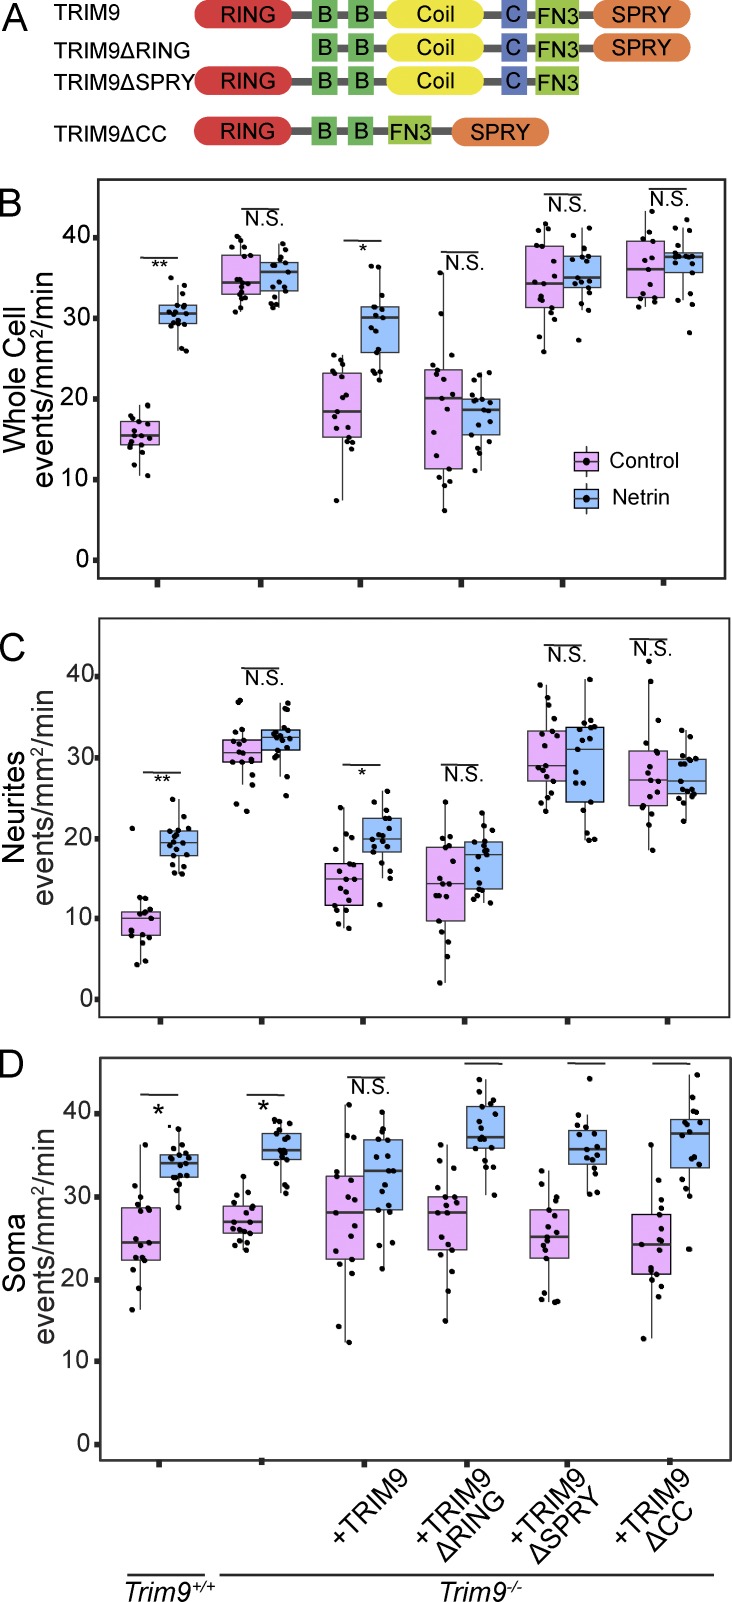
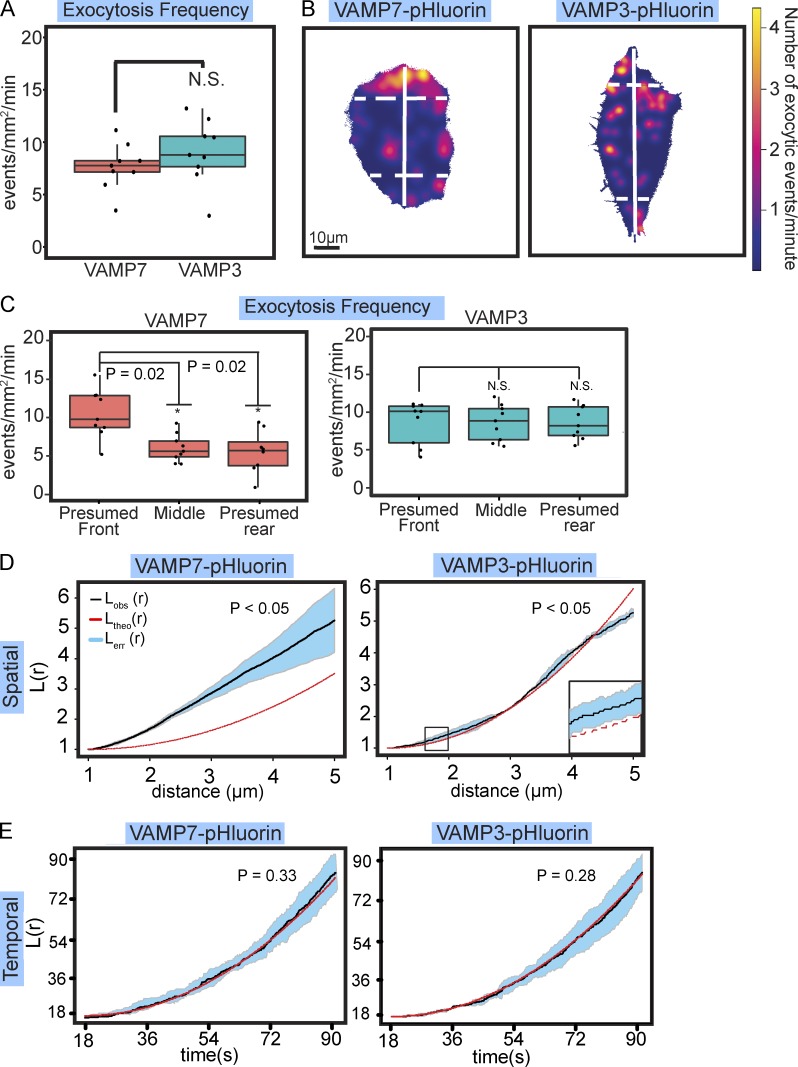
Neurite elongation and branching in developing neurons requires plasmalemma expansion, hypothesized to occur primarily via exocytosis. We posited that exocytosis in developing neurons and nonneuronal cells would exhibit distinct spatiotemporal organization. We exploited total internal reflection fluorescence microscopy to image vesicle-associated membrane protein (VAMP)-pHluorin-mediated exocytosis in mouse embryonic cortical neurons and interphase melanoma cells, and developed computer-vision software and statistical tools to uncover spatiotemporal aspects of exocytosis. Vesicle fusion behavior differed between vesicle types, cell types, developmental stages, and extracellular environments. Experiment-based mathematical calculations indicated that VAMP2-mediated vesicle fusion supplied excess material for the plasma membrane expansion that occurred early in neuronal morphogenesis, which was balanced by clathrin-mediated endocytosis. Spatial statistics uncovered distinct spatiotemporal regulation of exocytosis in the soma and neurites of developing neurons that was modulated by developmental stage, exposure to the guidance cue netrin-1, and the brain-enriched ubiquitin ligase tripartite motif 9. In melanoma cells, exocytosis occurred less frequently, with distinct spatial clustering patterns.


Figures

Figure 1.
Figure 1.
Automated identification and analysis of VAMP-pHluorin mediated exocytosis. (A) Overview of automated software. A cell mask is generated, followed by fluorescent maxima detection. A tracking matrix connects candidate events over time (Frame-to-Frame Tracking). (B) The tracking matrix was constructed using a Kalman filter to link a single exocytic event into a track over multiple frames. (C) Schematic and TIRF image montage show a typical exocytic event. Prefusion, VAMP2-pHluorin is not fluorescent (1, blue). Upon fusion pore opening (2, green), a bright fluorescent diffraction-limited spot appears. The VAMP2-pHluorin diffuses in the membrane over time (3, orange). (D) Example minimum projections of inverted TIRF time-lapse images before or after treatment with NH4Cl or TeNT. NH4Cl or TeNT treatment reduced the number of events detected (box plot, median ± interquartile range (IQR); whiskers reach minimum and maximum values within 1.5 times the IQR; n = 6 neurons per condition). See Video 2. (E) Box and whisker plots of effect of acquisition rate on exocytic detection (n = 17). (F) Examples of simulated images with noise of increasing Gaussian intensity. (G) Six simulations of exocytic events with increasing Gaussian or Poisson intensity demonstrate the robustness of the algorithm to image background and system noise. Typical experimental signal-to-background is highlighted in cyan. (H) ΔF/F for an individual exocytic event. Fusion pore opening occurs at time = 0 s. The normalized peak change in fluorescence intensity (peak ΔF/F) and event t1/2 (in s) are indicated. Initial fluorescence is estimated from 10 frames (1 s) before peak of fluorescence (initiation of exocytosis). t1/2 is estimated using a negative exponential decay. (I) Box and whisker plots of user-based and automated detection of the frequency of VAMP2-pHluorin–mediated exocytosis were not different (n = 16, paired t test, P = 0.56). Data points represent frequency per cell. Histograms of measured peak ΔF/F (J), event t1/2 (K), and major/minor axis of the first frame of each detected exocytic event (L). n = 462 exocytic events for each.
Figure 2.
Figure 2.
Spatiotemporal changes in exocytosis during neuronal development. (A) Heat maps of the density of VAMP2-mediated exocytosis in cortical neurons cultured in vitro for 24, 48, or 72 h before imaging. The blue and orange boxes demarcate soma and neurite examples used in F, respectively. (B) Frequency of VAMP2-pHluorin mediated exocytosis for basal plasma membrane of cortical neurons over developmental time. (*, P < 0.05; n = 17 cells per condition and 464, 455, and 466 exocytic events per condition; box and whiskers plots, box shows median ± IQR and whiskers reach minimum and maximum values within 1.5 times the IQR). See Video 3. (C and D) Box and whiskers plots of frequency of VAMP2-pHluorin–mediated exocytosis in the soma (C) and neurites (D) of cortical neurons. (E) Box and whiskers plots of frequency of VAMP7-pHluorin–mediated exocytosis for basal plasma membrane was not significantly different between time points (n = 14 cells per condition). See Video 4. (F) Schematics of Ripley’s L(r) function in spatial and temporal dimensions. Red dots represent exocytic events. (G) Example of Ripley’s L(r) analyses. The mean L(r) value of the aggregated data from multiple replicates (LObs[r], black line) and standard error of the data (Lerr[r], pink) is compared with the expected L(r) value of completely random exocytic events (Ltheo[r], red dashed line). (H) Spatial Ripley’s L(r) function analysis revealed that events were randomly distributed in the soma at 24 h, whereas exocytosis occurred in spatial clusters in the soma at 48 and 72 h. Exocytosis followed a similar pattern in the neurites (LObs[r] = mean of 17 per condition). (I) Temporal Ripley’s L(r) function of exocytic events over time in mouse cortical neurons, yet temporal bursts of exocytosis at 48 and 72 h in vitro (LObs[r] = mean of 17 per condition). See Video 3.
Figure 3.
Figure 3.
A mathematical estimation of membrane expansion. (A) Hierarchical diagram of the Bayesian linear model of neuronal surface area increases. Probability distributions (blue) of surface areas at 24 and 48 h represent priors imposed, with mean μ and SD σ for the normal distributions, and a uniform distribution for the model error. (B) Posterior predictions of surface area expansion by the model (orange lines) were compared with actual data (black line) to check for model fit. (C) Credible regression lines (orange) and mean (blue line) regression line of predicted plasma membrane expansion (n = 400 credible regression lines, n = 62 cells). (D) Estimates of membrane addition between 24 and 48 h. The black line is the measured surface area at 24 h in vitro. The blue line and blue shaded area represent predicted amount of plasma membrane expansion using a Bayesian linear model (A–C). Green lines represent predicted membrane added by VAMP2-mediated exocytosis. Orange lines represent predicted net membrane addition from VAMP2-mediated exocytosis after accounting for clathrin-mediated membrane removal. (E) Example transmission electron micrograph and histogram of measured diameters of non–clathrin-coated vesicles with density line overlaid (black solid line), 25th percentile (red dotted line), and 75th percentile (black dotted line) of the interquartile range (n = 88). (F) Box and whisker plots of frequency of clathrin-mediated endocytosis (n = 7 cells at 24 h and n = 8 cells at 24 h; box represents median ± IQR and whiskers reach minimum and maximum values within 1.5 times the IQR). (G) Example transmission electron micrograph and histogram of measured diameters of clathrin-coated vesicles with a density line overlaid (black solid line). The 25th percentile of the interquartile range (red dotted line, 30 nm) and 75th percentile of the interquartile range (black dotted vertical line, 40 nm; n = 13).
Figure 4.
Figure 4.
Netrin and TRIM9-dependent changes in the distribution of exocytosis. (A–C) Individual data points and box and whisker plots of peak ΔF/F (A), t1/2 (B), and major/minor axis (C) of VAMP2-mediated exocytosis in Trim9+/+ and Trim9−/− cortical neurons, treated or untreated with netrin-1 (n = 562, 632, 643, and 673 exocytic events per condition, respectively; box represents median ± IQR, whiskers reach minimum and maximum values within 1.5 times the IQR). (D) Heat maps of density of exocytosis. (E) Individual data points and box and whisker plots of frequency of VAMP2-pHluorin–mediated exocytosis (n = 17 cells per condition). (F and G) Frequency of VAMP2-pHluorin–mediated exocytic events in the soma (F) and neurites (G). (H) Ripley’s L(r) function applied to the soma and neurites. The data line and pink surrounding SEM represent untreated, and the data line and surrounding blue SEM represent netrin-1–treated neurons (n = 17 cells per condition). (I) 1D Ripley’s L(r) function of exocytic events over time (n = 17 cells per condition).
Figure 5.
Figure 5.
Different domains of TRIM9 modulate specific parameters of exocytosis in neurites. (A) Domain organization of mouse TRIM9 (top) and domain mutants that lack the ubiquitin ligase containing RING domain (TRIM9ΔRING), the DCC binding SPRY domain (TRIM9ΔSPRY), or the CC motif (TRIM9ΔCC), which mediates TRIM9 multimerization and interaction with SNAP25. (B–D) Box and whisker plots of frequency of VAMP2-pHluorin–mediated exocytosis across basal plasma membrane of neurons (box shows median ± IQR, whiskers reach minimum and maximum values within 1.5 times the IQR). (B), neurites (C), or soma (D) in Trim9+/+ and Trim9−/− neurons expressing the indicated TRIM9 domain mutants (n = 17 for each condition; *, P < 0.05; **, P < 0.005). See Fig. S5.
Figure 6.
Figure 6.
Distinct spatiotemporal organization of fusion of different vesicles pools in melanoma cells. (A) Box and whisker plots of frequency of VAMP7-pHluorin– and VAMP3-pHluorin–mediated exocytosis in VMM39 melanoma cells (n = 9 cells/condition; box shows median ± IQR, whiskers reach minimum and maximum values within 1.5 times the IQR). (B) Heat maps of density of VAMP7- and VAMP3-mediated exocytosis in representative VMM39 melanoma cells. Solid white line demarcates longest axis of the cell. Dashed perpendicular lines indicate minor axes 10 µm from the tips of the longest axis. The area encompassed from the edge of the cell to the dotted lines were measured to define a larger and smaller end of the cell. (C) Box and whiskers plots of number of exocytic events normalized to the larger end, middle, and smaller end of the cell. VAMP7-mediated exocytosis was polarized to the larger end of the cell (n = 9 cells). (D) 2D Ripley’s L(r) function applied to the spatial occurrence of VAMP7- and VAMP3-mediated exocytic events (n = 9). VAMP7-mediated events exhibited nonrandom clustering at all distances measured, whereas VAMP3-mediated events were dispersed at larger distances in regularly spaced clusters 1.5–2.5 µm in size. (E) 1D Ripley’s L(r) function applied to the temporal occurrence of VAMP7- and VAMP3-mediated exocytic events. Both VAMP7 and VAMP3-mediated events exhibited random temporal occurrence. See Video 5.

References

    1. Aalto M.K., Ronne H., and Keränen S.. 1993. Yeast syntaxins Sso1p and Sso2p belong to a family of related membrane proteins that function in vesicular transport. EMBO J. 12:4095–4104. - PMC - PubMed
    1. Advani R.J., Bae H.R., Bock J.B., Chao D.S., Doung Y.C., Prekeris R., Yoo J.S., and Scheller R.H.. 1998. Seven novel mammalian SNARE proteins localize to distinct membrane compartments. J. Biol. Chem. 273:10317–10324. 10.1074/jbc.273.17.10317 - DOI - PubMed
    1. Alberts P., Rudge R., Irinopoulou T., Danglot L., Gauthier-Rouvière C., and Galli T.. 2006. Cdc42 and actin control polarized expression of TI-VAMP vesicles to neuronal growth cones and their fusion with the plasma membrane. Mol. Biol. Cell. 17:1194–1203. 10.1091/mbc.E05-07-0643 - DOI - PMC - PubMed
    1. Arantes R.M.E., and Andrews N.W.. 2006. A role for synaptotagmin VII-regulated exocytosis of lysosomes in neurite outgrowth from primary sympathetic neurons. J. Neurosci. 26:4630–4637. 10.1523/JNEUROSCI.0009-06.2006 - DOI - PMC - PubMed
    1. Bentley M., and Banker G.. 2015. A Novel Assay to Identify the Trafficking Proteins that Bind to Specific Vesicle Populations. Curr. Protoc. Cell Biol. 69:13.8.1–13.8.12. - PMC - PubMed

Publication types

MeSH terms