. 2018 Feb 21;38(8):2015-2028.
doi: 10.1523/JNEUROSCI.0141-17.2018. Epub 2018 Jan 19.

Eliminating Glutamatergic Input onto Horizontal Cells Changes the Dynamic Range and Receptive Field Organization of Mouse Retinal Ganglion Cells

Affiliations

Eliminating Glutamatergic Input onto Horizontal Cells Changes the Dynamic Range and Receptive Field Organization of Mouse Retinal Ganglion Cells

Sebastian Ströh et al. J Neurosci. .

Abstract

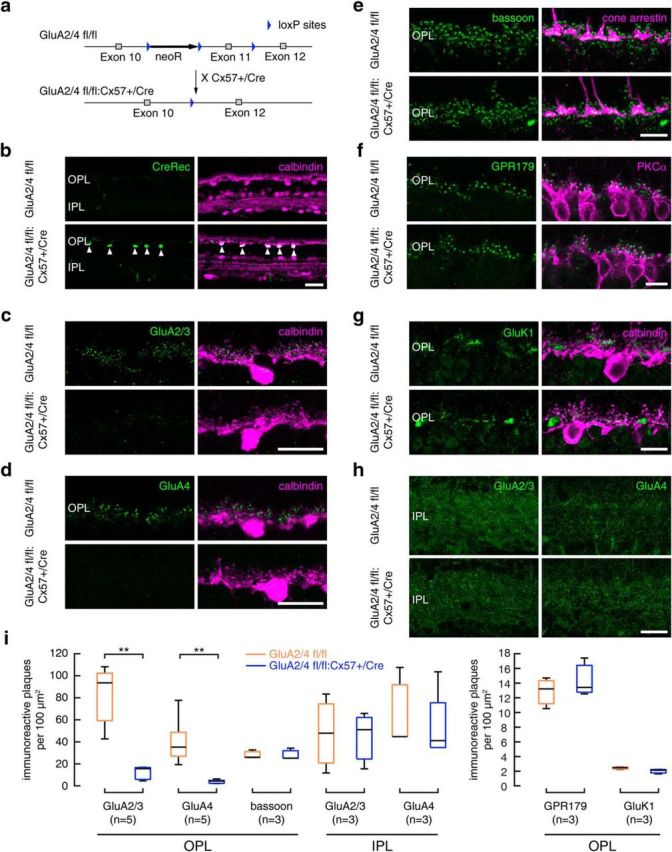
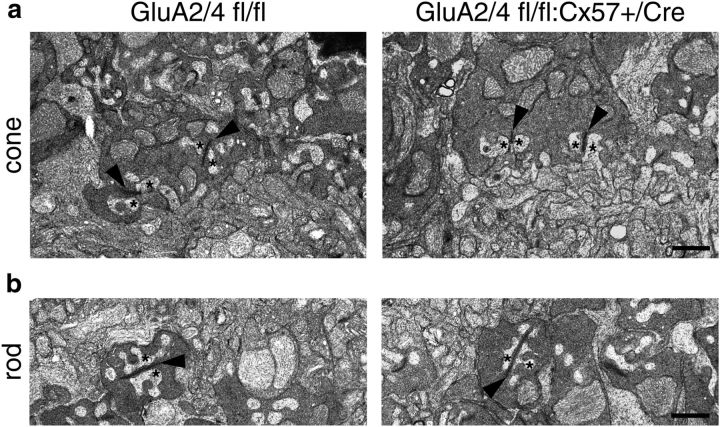
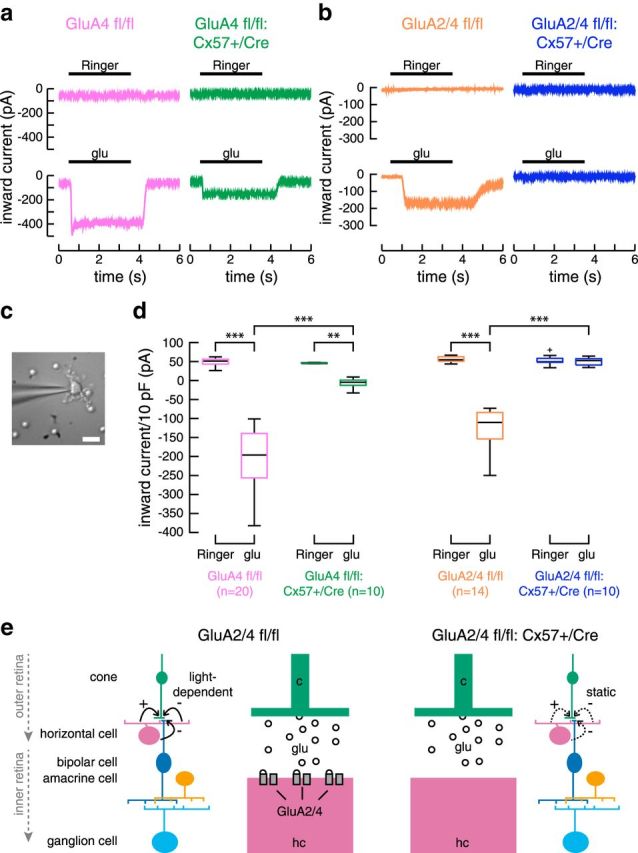
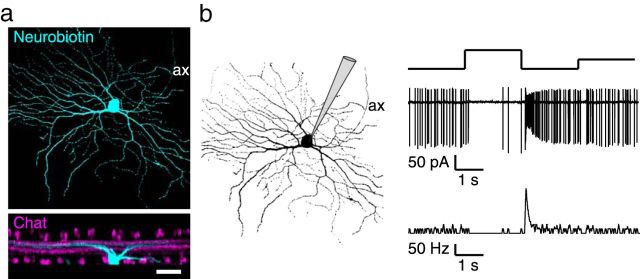
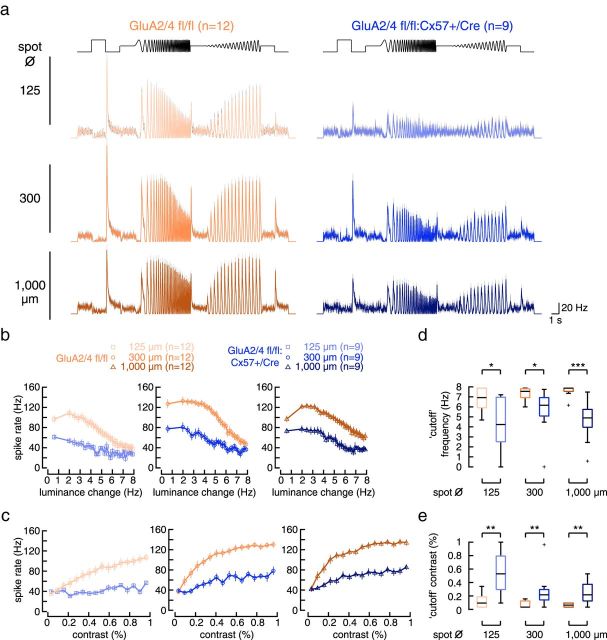
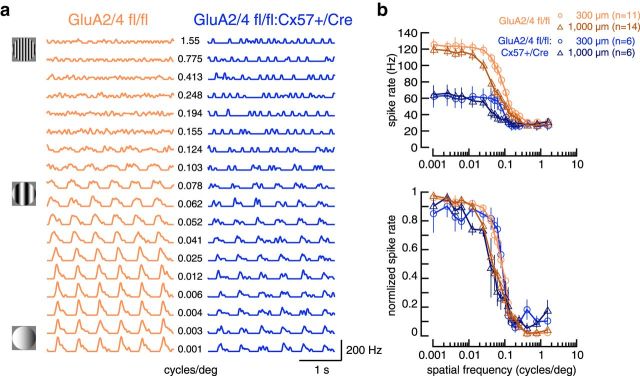
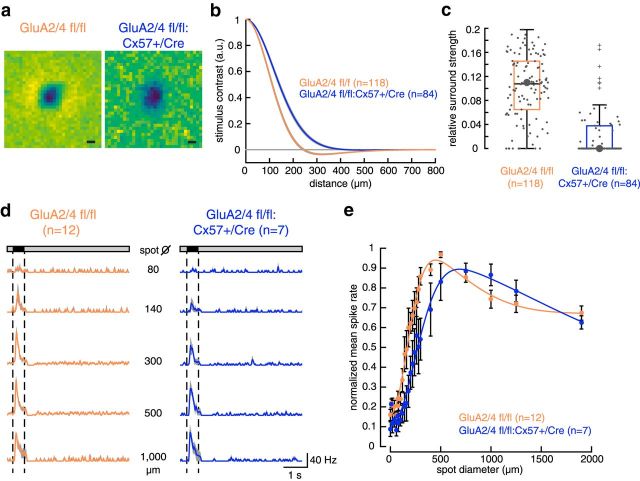
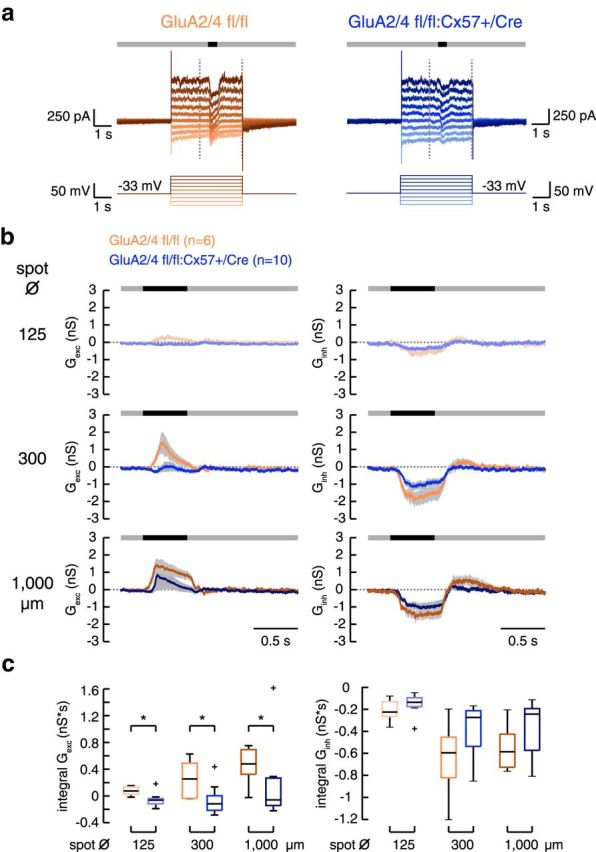
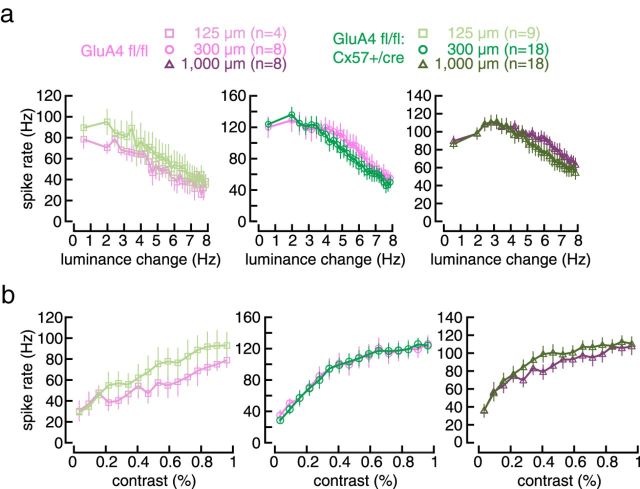
In the mammalian retina, horizontal cells receive glutamatergic inputs from many rod and cone photoreceptors and return feedback signals to them, thereby changing photoreceptor glutamate release in a light-dependent manner. Horizontal cells also provide feedforward signals to bipolar cells. It is unclear, however, how horizontal cell signals also affect the temporal, spatial, and contrast tuning in retinal output neurons, the ganglion cells. To study this, we generated a genetically modified mouse line in which we eliminated the light dependency of feedback by deleting glutamate receptors from mouse horizontal cells. This genetic modification allowed us to investigate the impact of horizontal cells on ganglion cell signaling independent of the actual mode of feedback in the outer retina and without pharmacological manipulation of signal transmission. In control and genetically modified mice (both sexes), we recorded the light responses of transient OFF-α retinal ganglion cells in the intact retina. Excitatory postsynaptic currents (EPSCs) were reduced and the cells were tuned to lower temporal frequencies and higher contrasts, presumably because photoreceptor output was attenuated. Moreover, receptive fields of recorded cells showed a significantly altered surround structure. Our data thus suggest that horizontal cells are responsible for adjusting the dynamic range of retinal ganglion cells and, together with amacrine cells, contribute to the center/surround organization of ganglion cell receptive fields in the mouse.SIGNIFICANCE STATEMENT Horizontal cells represent a major neuronal class in the mammalian retina and provide lateral feedback and feedforward signals to photoreceptors and bipolar cells, respectively. The mode of signal transmission remains controversial and, moreover, the contribution of horizontal cells to visual processing is still elusive. To address the question of how horizontal cells affect retinal output signals, we recorded the light responses of transient OFF-α retinal ganglion cells in a newly generated mouse line. In this mouse line, horizontal cell signals were no longer modulated by light. With light response recordings, we show that horizontal cells increase the dynamic range of retinal ganglion cells for contrast and temporal changes and contribute to the center/surround organization of their receptive fields.

Keywords: gain control; ganglion cells; glutamate receptor; horizontal cells; receptive field; retina.


Figures

Figure 1.
Figure 1.
Targeted deletion of GluA2 and GluA4 in horizontal cells did not change outer retina morphology. a, Targeting scheme. Exon 11 of the GluA2 and GluA4 genes was each flanked with loxP sites and deleted by crossing GluA2/4 fl/fl mice with Cx57+/Cre mice (Ströh et al., 2013). b, Cre expression was restricted to horizontal cells, as revealed by double staining with the horizontal cell marker calbindin. c, d, In the outer retina of Cre-expressing mice, GluA2/3 (c) and GluA4 immunoreactivities (d) were reduced to background levels. e, Cone pedicle morphology and bassoon labeling were normal in Cre-expressing mice. f, Rod bipolar cell dendrites and GPR179 labeling, which reveals part of the mGluR6 signaling complex in ON bipolar cells, were unchanged in Cre-expressing mice. g, Labeling for kainic acid receptors (GluK1) was normal in Cre-expressing mice. h, In the inner retina of Cre-expressing mice, GluA2/3 and GluA4 immunoreactivities were unchanged. i, Boxplots for the quantification of GluA2/3, GluA4, GluK1, GPR179, and bassoon immunoreactivity (IR) in the OPL and GluA2/3 and GluA4 immunoreactivity in the IPL. Quantification confirmed the expected reduction in GluA2/3- and GluA4-positive plaques in the outer retina of Cre-expressing mice (GluA2/4 fl/fl vs +/Cre: Wilcoxon rank sum test, p < 0.01, n = 5 mice per genotype). The number of bassoon-labeled ribbon synapses, GluK1- and GPR179-positive plaques were unchanged compared with controls (GluA2/4 fl/fl vs +/Cre: Wilcoxon rank sum test; bassoon: p = 0.7; GPR179: p = 0.8; GluK1: p = 0.2, n = 3 mice per genotype). Likewise, GluA2/3 and GluA4 immunoreactivities were unchanged in the IPL of Cre-expressing mice, confirming the specificity of the deletion (GluA2/4 fl/fl vs +/Cre: Wilcoxon rank sum test, GluA2/3: p = 1; GluA4: p = 0.9, n = 3 mice per genotype). **p < 0.01. Scale bars, 20 μm.
Figure 2.
Figure 2.
No evidence for alterations in triad synapses when GluA2 and GluA4 are deleted from horizontal cells. a, b, Representative electron micrographs from the outer plexiform layer of control and GluA2/4-deficient mice. Cone (a) and rod synapses (b) appeared unchanged in GluA2/4-deficient mice: two lateral horizontal cell processes (asterisks) flanked the synaptic ribbons (arrowheads), like in controls. Scale bar, 1 μm.
Figure 3.
Figure 3.
Targeted deletion of GluA2 and GluA4 in horizontal cells completely eliminated glutamate-induced inward currents. a, When only GluA4 was deleted from horizontal cells, glutamate-induced currents were reduced but not abolished. Example traces for application of Ringer's solution and 1 mm glutamate (glu). Data replotted after Ströh et al., 2013. b, Deletion of both, GluA2 and GluA4, from horizontal cells eliminated glutamate-induced currents. Representative recordings with application of Ringer's solution and 1 mm glutamate. c, Dissociated horizontal cell with its typical morphology, targeted with a patch electrode. Scale bar, 10 μm. d, Boxplots of inward currents for control and GluA-deficient mice. Currents were normalized to 10 pF of membrane capacitance to account for differences in cell size. The cross represents an outlier. Differences between genotypes were significant (glu application, GluA2/4 fl/fl vs +/Cre: Wilcoxon rank sum test, p = 4.7 × 10⁻⁵). No difference was found between the application of Ringer's solution and 1 mm glutamate for GluA2/4-deficient mice (+/Cre, Ringer's vs glu: Wilcoxon sign rank test, p = 0.847). **p < 0.01; ***p < 0.001. e, Simplified diagram of the mammalian retina, showing the rationale of this study. Glutamate receptors are deleted from horizontal cells to deprive them from photoreceptor inputs. Please note that the strength of horizontal cell feedback (solid black arrows) is dependent on light intensity. Thus, depriving horizontal cells from photoreceptor inputs likely does not abolish feedback but eliminates its light-dependent modulation, leading to static feedback in GluA2/4-deficient mice (dashed black arrows).
Figure 4.
Figure 4.
Targeted ganglion cells showed the characteristic morphology and light response of tOFF-αRGCs. a, Neurobiotin-injected ganglion cell, showing the characteristic morphology of tOFF-αRGCs with a large soma and dendritic field. Scale bar, 40 μm. ax, Axon. b, Characteristic light response of a tOFF-αRGCs, showing only few spikes during light increment and a transient series of spikes at light decrement (Pang et al., 2003; Van Wyk et al., 2009; Baden et al., 2016; Krieger et al., 2017).
Figure 5.
Figure 5.
In GluA2/4-deficient mice, the dynamic range of light responses in tOFF-αRGCs was compressed. a, Spike rates (bin size, 20 ms) of tOFF-αRGCs from control and GluA2/4-deficient mice to chirp stimuli of 125, 300, and 1000 μm diameter. Values are shown as mean ± SEM, with means presented as solid colored lines and SEM as gray shades. b, c, Peak spike rate plotted against temporal frequency (b) or contrast (c) for the two genotypes and all three spot sizes (values are presented as mean ± SEM). Differences between genotypes were significant at all spot sizes (frequency: genotype effect: p < 0.0011 for all comparisons; contrast: genotype effect: p < 0.0026 for all comparisons; two-way ANOVA for repeated measures). d, e, “Cutoff” frequency (d) and contrast (e), i.e., the highest frequency and the lowest contrast that elicited a response (see Materials and Methods) were determined. Crosses represent outliers. Differences between genotypes were significant at all spot sizes (frequency: p < 0.02 for all comparisons; contrast: p < 0.0086 for all comparisons; Wilcoxon rank sum test), indicating that cells from GluA2/4-deficient mice failed to respond to high-frequency or low-contrast stimuli. *p < 0.05; **p < 0.01; ***p < 0.001.
Figure 6.
Figure 6.
In GluA2/4-deficient mice, tOFF-αRGCs showed reduced peak spike rates but no change in spatial tuning in response to drifting sine-wave gratings. a, Representative responses of tOFF-αRGCs from control and GluA2/4-deficient mice to drifting sine-wave gratings (300 μm diameter) with spatial frequencies ranging from 0.001 to 1.55 cycles/deg. b, Peak spike rates plotted versus spatial frequency for two different stimulus diameters (300 and 1000 μm, top). tOFF-αRGCs from GluA2/4-deficient mice showed much lower spike rates than controls. To compare responses independent of the absolute spike rate, we normalized spike rates to values between 0 and 1. This revealed that spatial tuning showed a very similar dependence on spatial frequency and spot diameter in both genotypes: responses to the larger spot, which also covered part of the surround, fell off at lower spatial frequencies than for the small spot, which only covered the center of the receptive field. Values in b are shown as mean ± SEM.
Figure 7.
Figure 7.
In GluA2/4-deficient mice, tOFF-αRGCs showed altered centers and surrounds. a, Representative examples of spatial receptive fields of tOFF-αRGCs from control and GluA2/4-deficient mice obtained by a logistic regression model (see Materials and Methods). The dark region, indicating a dominant OFF response, was surrounded by an aggregation of light regions in the control (left), indicating an antagonistic receptive field surround, which is absent in the spatial receptive field of GluA2/4-deficient mice (right). Scale bar, 100 μm. b, Cross-sectional profile of receptive fields for 118 control and 84 GluA2/4-deficient tOFF-αRGCs. Mean across difference of Gaussians fits is shown. Shaded area represents 1 SEM. c, Box plots showing the ratio of center and surround amplitude. Large points represent cells shown in a. Crosses represent outliers. d, Averaged spike rates (bin size 20 ms) of tOFF-αRGCs from control and GluA2/4-deficient mice in response to selected spots of increasing diameter. Data are plotted as mean ± SEM, with means presented as solid colored lines and SEM as gray shades. Dotted lines represent the stimulus. e, Mean normalized spike rates were fit with a difference of two Gaussians model. Both genotypes showed the characteristic feature of antagonistic receptive field organization: increase in firing with increasing spots until a maximum was reached and a successive decline in firing rates with further increasing spot sizes. However, center and surround sizes were larger in GluA2/4-deficient mice. Also, the ratio of center/surround strength was larger in GluA2/4-expressing mice (2.3) than in GluA2/4-deficient mice (1.5). Fit parameters: GluA2/4 fl/fl: R0 = 0.16; kc = 0.9; σc = 83 μm; ks = 0.39; σs = 295 μm; R2 = 0.98; +/Cre: R0 = 0.1; kc = 0.87; σc = 121 μm; ks = 0.57; σs = 700 μm; R2 = 0.98. Values are shown as mean ± SEM.
Figure 8.
Figure 8.
In GluA2/4-deficient mice, excitatory input to tOFF-αRGCs was strongly reduced. a, Examples of light-evoked membrane currents in tOFF-αRGCs from control and GluA2/4-deficient retinas. The cells were clamped from a holding potential of −33 mV to different potentials (−87 to +42 mV) in 15 mV steps. A spot of light decrement (here with a diameter of 300 μm) was presented on a gray background 2 s after clamping the cell to the new potential. The vertical dashed lines represent the time span shown in b. b, Mean excitatory and inhibitory conductances calculated from 6 and 10 tOFF-αRGCs from control and GluA2/4-deficient mice, respectively, for three different spot diameters. Shaded areas give SEM. c, Boxplots for the integrals of excitatory and inhibitory conductances in both genotypes. Outliers are represented by crosses. Excitatory conductances were significantly smaller in GluA2/4-deficient mice at all spot sizes (GluA2/4 fl/fl vs +/Cre, Wilcoxon rank sum test, p < 0.0225 for all comparisons). In contrast, inhibitory conductances were not significantly different (p > 0.1806 for all genotype comparisons, Wilcoxon rank sum test). *p < 0.05.
Figure 9.
Figure 9.
No change in temporal and contrast tuning in tOFF-αRGCs in GluA4 fl/fl:Cx57+/Cre mice. a, b, Peak spike rate plotted against temporal frequency (a) or contrast (b) for controls and GluA4-deficient mice and all three spot sizes (values are presented as mean ± SEM). Two-way ANOVA for repeated measures showed no significant differences between genotypes (GluA4 fl/fl vs +/Cre, frequency: effect of genotype: p > 0.557 for all genotype comparisons; contrast: effect of genotype: p > 0.652 for all genotype comparisons).

References

    1. Baden T, Berens P, Franke K, Román Rosón M, Bethge M, Euler T (2016) The functional diversity of retinal ganglion cells in the mouse. Nature 529:345–350. 10.1038/nature16468 - DOI - PMC - PubMed
    1. Bleckert A, Schwartz GW, Turner MH, Rieke F, Wong RO (2014) Visual space is represented by nonmatching topographies of distinct mouse retinal ganglion cell types. Curr Biol 24:310–315. 10.1016/j.cub.2013.12.020 - DOI - PMC - PubMed
    1. Chaya T, Matsumoto A, Sugita Y, Watanabe S, Kuwahara R, Tachibana M, Furukawa T (2017) Versatile functional roles of horizontal cells in the retinal circuit. Sci Rep 7:5540. 10.1038/s41598-017-05543-2 - DOI - PMC - PubMed
    1. Conover WJ, Iman RL (1981) Rank transformations as a bridge between parametric and nonparametric statistics. Am Stat 35:124–129. 10.1080/00031305.1981.10479327 - DOI
    1. Crook JD, Packer OS, Dacey DM (2014) A synaptic signature for ON- and OFF-center parasol ganglion cells of the primate retina. Vis Neurosci 31:57–84. 10.1017/S0952523813000461 - DOI - PMC - PubMed

Publication types