. 2018 Jan 19;9(1):300.
doi: 10.1038/s41467-017-02541-w.

Direct cell-cell contact between mature osteoblasts and osteoclasts dynamically controls their functions in vivo

Affiliations

Direct cell-cell contact between mature osteoblasts and osteoclasts dynamically controls their functions in vivo

Masayuki Furuya et al. Nat Commun. .

Abstract

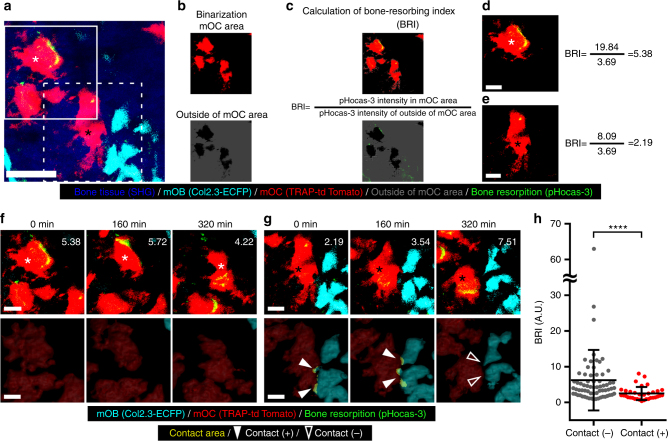
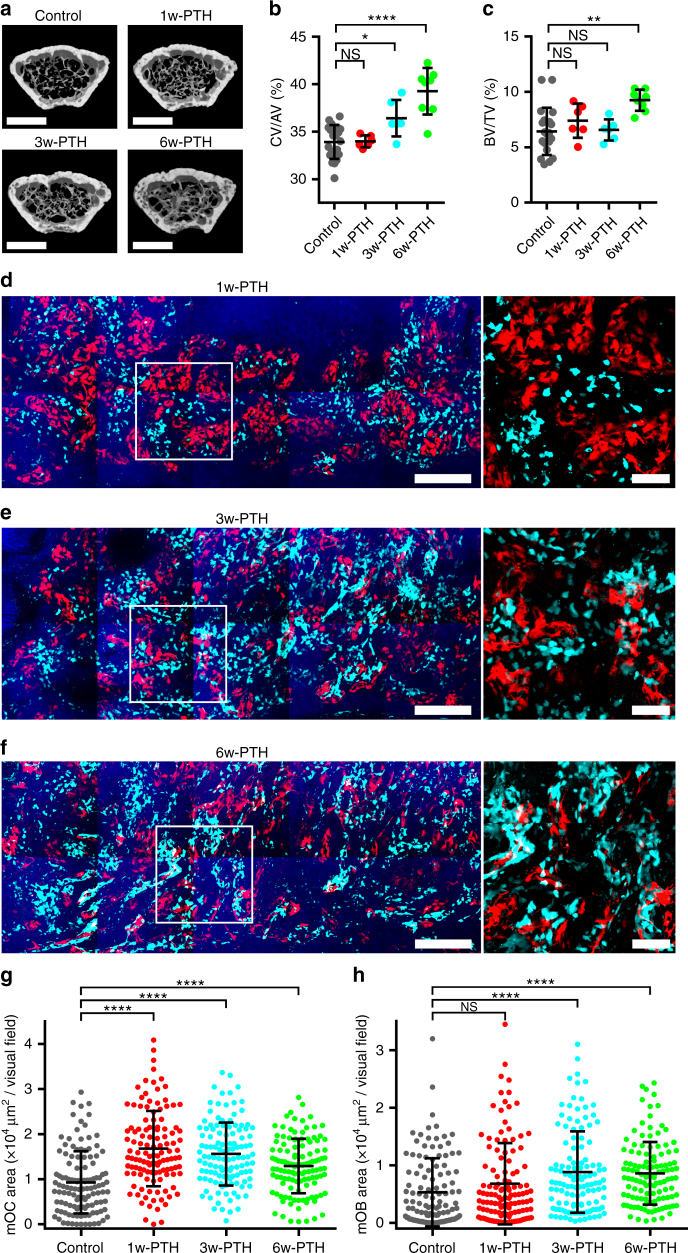
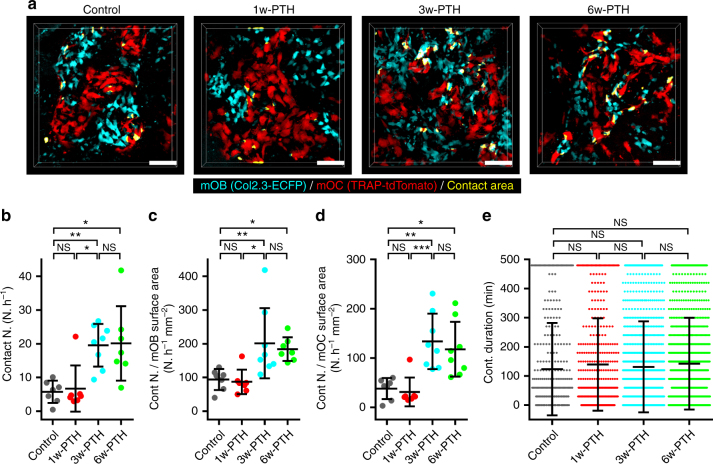
Bone homeostasis is regulated by communication between bone-forming mature osteoblasts (mOBs) and bone-resorptive mature osteoclasts (mOCs). However, the spatial-temporal relationship and mode of interaction in vivo remain elusive. Here we show, by using an intravital imaging technique, that mOB and mOC functions are regulated via direct cell-cell contact between these cell types. The mOBs and mOCs mainly occupy discrete territories in the steady state, although direct cell-cell contact is detected in spatiotemporally limited areas. In addition, a pH-sensing fluorescence probe reveals that mOCs secrete protons for bone resorption when they are not in contact with mOBs, whereas mOCs contacting mOBs are non-resorptive, suggesting that mOBs can inhibit bone resorption by direct contact. Intermittent administration of parathyroid hormone causes bone anabolic effects, which lead to a mixed distribution of mOBs and mOCs, and increase cell-cell contact. This study reveals spatiotemporal intercellular interactions between mOBs and mOCs affecting bone homeostasis in vivo.


Conflict of interest statement

T.I. and Y. Isogai are full-time employees of Asahi Kasei Pharma Corporation. The remaining authors declare no competing financial interests.

Figures

Fig. 1
Fig. 1
Simultaneous visualization of intact mOBs and mOCs in living bones. a Schematic representation of mouse skull bone. Each small boxed region represents a single visual field and each tiling image contains 10 contiguous boxed regions. b A representative, intravital, two-photon, microscopic tiling maximum-intensity projection (MIP) image of skull bone tissues from Col2.3-ECFP/TRAP-tdTomato mice held under control conditions. Cyan, mOBs expressing Col2.3-ECFP; red, mOCs expressing TRAP-tdTomato; blue, bone tissues (second harmonic generation, SHG). Scale bar, 300 µm. c, d Magnified images from b reveal two representative modes of communication between mOBs and mOCs. Scale bar, 20 µm. c Representative images of a colony region (the region outlined in b). Open arrowheads represent mOBs and mOCs that are separated. d Representative images of a contact area (the region delineated by dotted lines in b). The filled arrowheads indicate areas of direct mOB–mOC contact. eg Intravital two-photon microscopy time-lapse MIP images of skull bone tissues from Col2.3-ECFP/TRAP-tdTomato mice held under control conditions. e A representative MIP image captured at 0 min. Scale bar, 100 µm. f Magnified images of a colony area (the region outlined in e) captured at 0, 120, 240, 360, and 480 min. Scale bar, 20 µm. g Magnified images of the contact area captured at 0, 30, 60, 90, 120, 150, and 180 min (the region delineated by dotted lines in e). Scale bar, 15 µm. h 3D colocalization analysis of the images shown in g. The contact area is the region of colocalization of mOBs and mOCs and is shown in yellow. Scale bar, 15 µm
Fig. 2
Fig. 2
Direct contact with mOBs inhibits the bone-resorbing activity of mOCs. a A representative MIP image of bone-resorptive activity in skull bone tissue of a Col2.3-ECFP/TRAP-tdTomato mouse injected with a pH-sensing chemical probe, pHocas-3. Green, pHocas-3; cyan, mOBs expressing Col2.3-ECFP; red, mOCs expressing TRAP-tdTomato; blue, bone tissues (SHG). Scale bar, 50 µm. b, c Assessment of mOC bone-resorbing activity. b Areas containing mOCs were automatically binarized from the original images. Red, mOC areas; gray, regions outside the mOC areas. c Mean pHocas-3 fluorescence intensities were measured inside (pHocas-3 signal) and outside the mOC areas (pHocas-3 noise). The bone resorbing index (BRI) was the ratio of the pHocas-3 signal to the pHocas-3 noise. d, e Images processed for BRI calculations (d for the mOC indicated with white asterisk in the outlined region of a, and e for the mOC indicated with black asterisk in the region delineated with a dotted line in a). Scale bar, 20 µm. f, g Magnified MIP images from the region outlined in a and f, and the region delineated by the dotted line in a and g, captured at 0, 160, and 320 min (upper panels). The 3D images yielded by colocalization analysis (bottom panels). Scale bar, 20 µm. The contact areas were those where mOBs and mOCs colocalized and are shown in yellow. The filled arrowheads show areas of mOB–mOC contact. The open arrowheads indicate separated mOBs and mOCs. The actual BRI values are shown to the right of the images. h BRI of mOCs in contact, or not, with mOBs. Snapshot MIP images were collected from 14 independent experiments; n = 34 (mOCs in contact with mOBs), n = 67 (mOCs not in such contact). Data are presented as means ± SDs. ****p < 0.0001 (Mann–Whitney test)
Fig. 3
Fig. 3
Intermittent PTH treatment induces merged distribution in vivo. ac Micro-computed tomography (micro-CT) analysis of the distal, femoral metaphyseal regions. Twelve-week-old female mice were given the vehicle or PTH (40 µg kg−1 per day, 5 days per week) via subcutaneous (s.c.) injection and were evaluated 1, 3, and 6 weeks later; n = 20 in the control group, n = 6–8 in each PTH-treated group. Data are presented as means ± SDs. *p < 0.05; **p < 0.01; ****p < 0.0001; NS, not significant (one-way ANOVA). a Representative micro-CT three-dimensional (3D) images. Scale bar, 1,000 µm. b Cortical bone ratios (cortical bone volume/total bone volume; CV/TV). c Bone matrix densities (bone volume/total volume, BV/TV). df Representative, intravital, two-photon, microscopy tiling MIP images of skull bone tissues of Col2.3-ECFP/TRAP-tdTomato mice taken 1, 3, or 6 weeks after PTH treatment (d, 1w-PTH; e, 3w-PTH; f, 6w-PTH). Cyan, mOBs expressing Col2.3-ECFP; red, mOCs expressing TRAP-tdTomato; blue, bone tissues (SHG). Scale bar, 300 µm. Magnified images of representative distributions of mOBs and mOCs in either group (right panels). Scale bar, 100 µm. g, h Areas of mOCs and mOBs per visual field; n = 120, collected from 12 tiling images from the six mice in each group. Data are presented as means ± SDs. ****p < 0.0001; NS, not significant (Kruskal–Wallis test)
Fig. 4
Fig. 4
Quantitative analysis of PTH-induced merged distribution. ae The procedure used for cell mixture analysis. a A representative, intravital, two-photon microscopy MIP image of the skull bone tissue of a Col2.3-ECFP/TRAP-tdTomato mouse held under control conditions. Cyan, mOBs expressing Col2.3-ECFP; red, mOCs expressing TRAP-tdTomato. Scale bar, 100 µm. b The areas of mOBs and mOCs shown in a were automatically binarized and the binarized image were resized (smaller). c Hierarchical clustering was performed based on the between-pixel differences, regardless of color. d To derive a threshold allowing the number of clusters to be determined, the Gini-like impurity (GLI) was calculated as the weighted averages of the mOB/mOC area ratios of each cluster at particular levels of the tree. As examples, we present the calculations for the cases in which the cluster numbers were 2, 4, and 8. The clusters used to calculate each threshold are shown in the same colors on the image. The ratios between the mOC and mOB areas are indicated by red and cyan in the circular charts; the areas of the circles reflect the areas occupied by the cells. e The GLI curves and the cell mixture index (CMI) values were calculated for the image shown in 4a (left graph) and the magnified image shown in 3f (right graph). The CMI was defined as the area under the GLI curve, which indicated the extent of mixing of the two types of cells within an image. f The CMI values per visual field in control mice and 1-w-, 3-w-, or 6-w-PTH-treated Col2.3-ECFP/TRAP-tdTomato mice; n = 120; collected from 12 tiling images from the six mice of each group. Data are presented as means ± SDs. **p < 0.01; ****p < 0.0001; NS, not significant (Kruskal–Wallis test)
Fig. 5
Fig. 5
Intermittent PTH treatment increases the number of contact. a 3D colocalization analysis of representative images from control mice and 1-w-, 3-w-, and 6-w-PTH-treated Col2.3-ECFP/TRAP-tdTomato mice. Cyan, mOBs expressing Col2.3-ECFP; red, mOCs expressing TRAP-tdTomato. The contact areas were defined as the areas of colocalization of mOBs and mOCs, and are shown in yellow. Scale bar, 100 µm. b The number of mOB–mOC contacts. The duration of a mOB–mOC contact event was defined as the time from initial attachment to the end of mOB–mOC contact. c The numbers of contact events normalized by the surface areas of the mOBs. d The numbers of contact events normalized by the surface areas of the mOCs. bd The data were collected from seven to eight independent experiments per group (control; n = 7, 1-w-PTH; n = 7, 3-w-PTH; n = 8, 6-w-PTH; n = 7). e The duration of mOB–mOC contact. Data were collected in seven to eight independent experiments performed per group (control; n = 322, 1-w-PTH; n = 375, 3-w-PTH; n = 1,252, 6-w-PTH; n = 1,126). Data are presented as means ± SDs. *p < 0.05; **p < 0.01; ***p < 0.001; NS, not significant (Kruskal–Wallis test)
Fig. 6
Fig. 6
Direct contact attenuates resorbing activity in PTH-treated bone. ad Representative MIP images of the bone-resorptive activities of control and 1-w-, 3-w-, and 6-w-PTH-treated Col2.3-ECFP/TRAP-tdTomato mice using a pH-sensing chemical probe, pHocas-3. The binarized mOC areas and the pHocas-3 signals are indicated in the bottom panels. Green, fluorescent signals from pHocas-3; Cyan, mOBs expressing Col2.3-ECFP; red, mOCs expressing TRAP-tdTomato; blue, bone tissues (SHG). Scale bar, 50 µm. e BRI time courses for the visual fields shown in ad. f Correlations between CMI and the mean BRI values over 4 h; n = 12, collected from 8 to 10 mice per group. Data are presented as means ± SDs. ***p < 0.001 (Spearman’s correlation coefficient, r = −0.5717; tests for no correlation, p = 0.0003.)

References

    1. Hattner R, Epker BN, Frost HM. Suggested sequential mode of control of changes in cell behavior in adult bone remodeling. Nature. 1965;206:489–490. doi: 10.1038/206489a0. - DOI - PubMed
    1. Takahashi H, Epker BN, Frost HM. Resorption precedes formative activity. Surg. Forum. 1964;15:437–438. - PubMed
    1. Sims NA, Martin TJ. Coupling the activities of bone formation and resorption: a multitude of signals within the basic multicellular unit. Bone Rep. 2014;3:481. - PMC - PubMed
    1. Matsuo K, Irie N. Osteoclast-osteoblast communication. Arch. Biochem. Biophys. 2008;473:201–209. doi: 10.1016/j.abb.2008.03.027. - DOI - PubMed
    1. Denk W, Strickler JH, Webb WW. Two-photon laser scanning fluorescence microscopy. Science. 1990;248:73–76. doi: 10.1126/science.2321027. - DOI - PubMed

Publication types

MeSH terms

Substances