. 2018 Jan 19;9(1):299.
doi: 10.1038/s41467-017-02582-1.

Binding of NUFIP2 to Roquin promotes recognition and regulation of ICOS mRNA

Affiliations

Binding of NUFIP2 to Roquin promotes recognition and regulation of ICOS mRNA

Nina Rehage et al. Nat Commun. .

Abstract

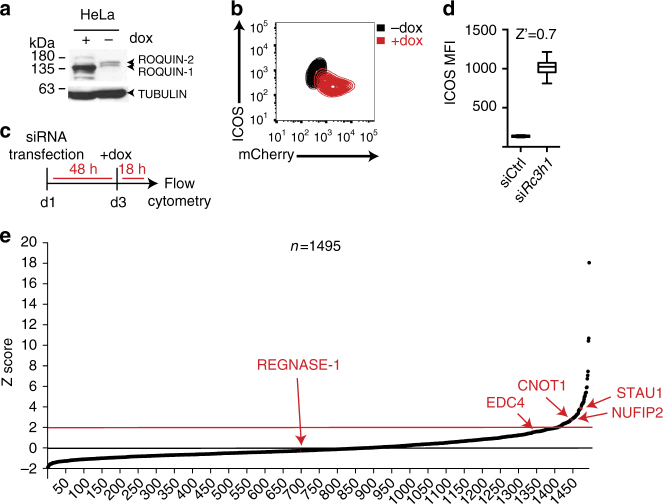
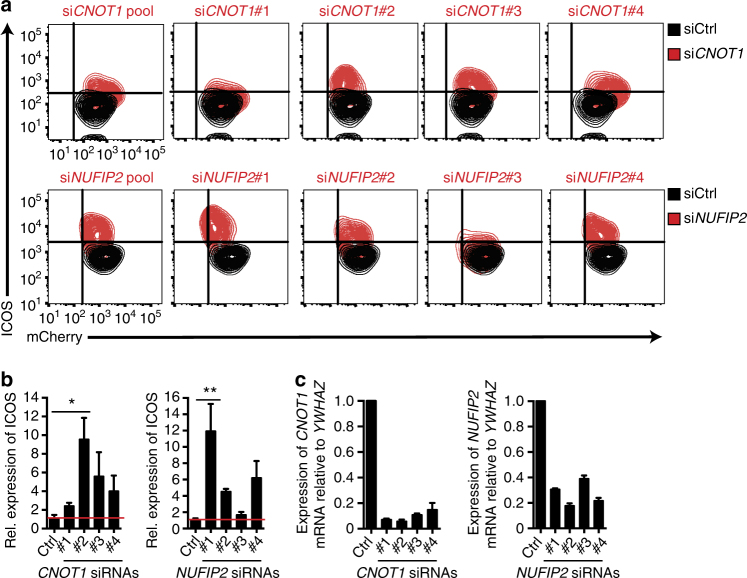
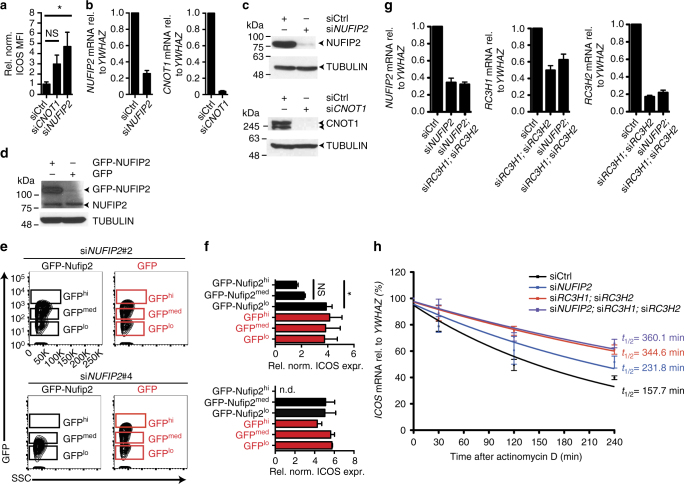
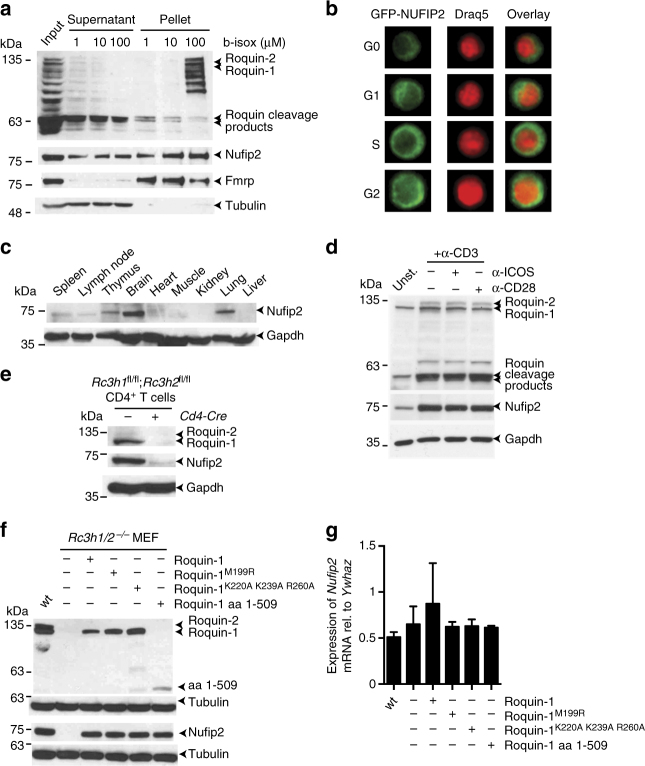
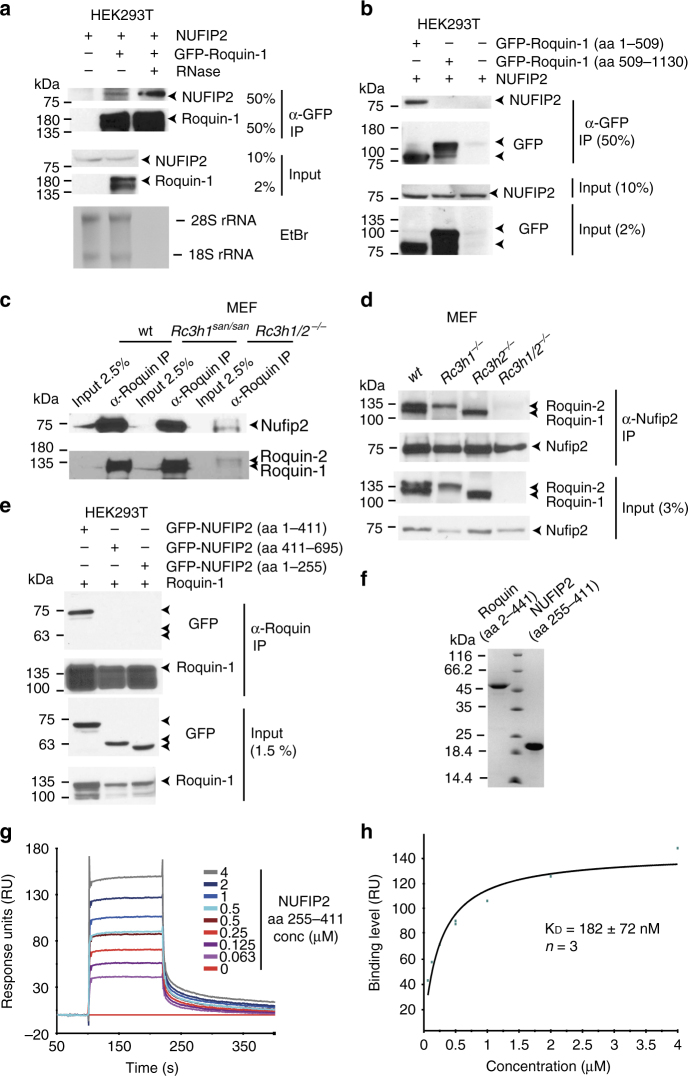
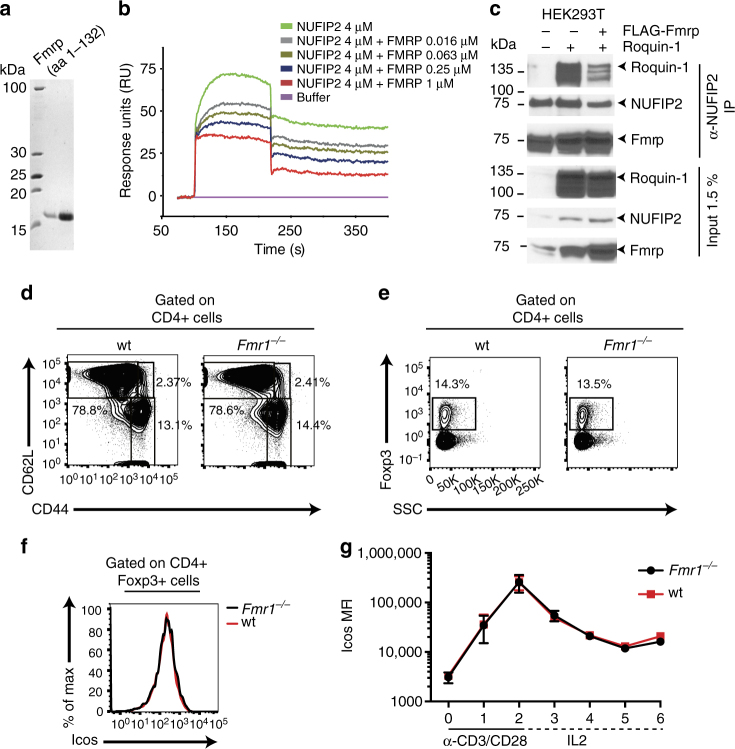
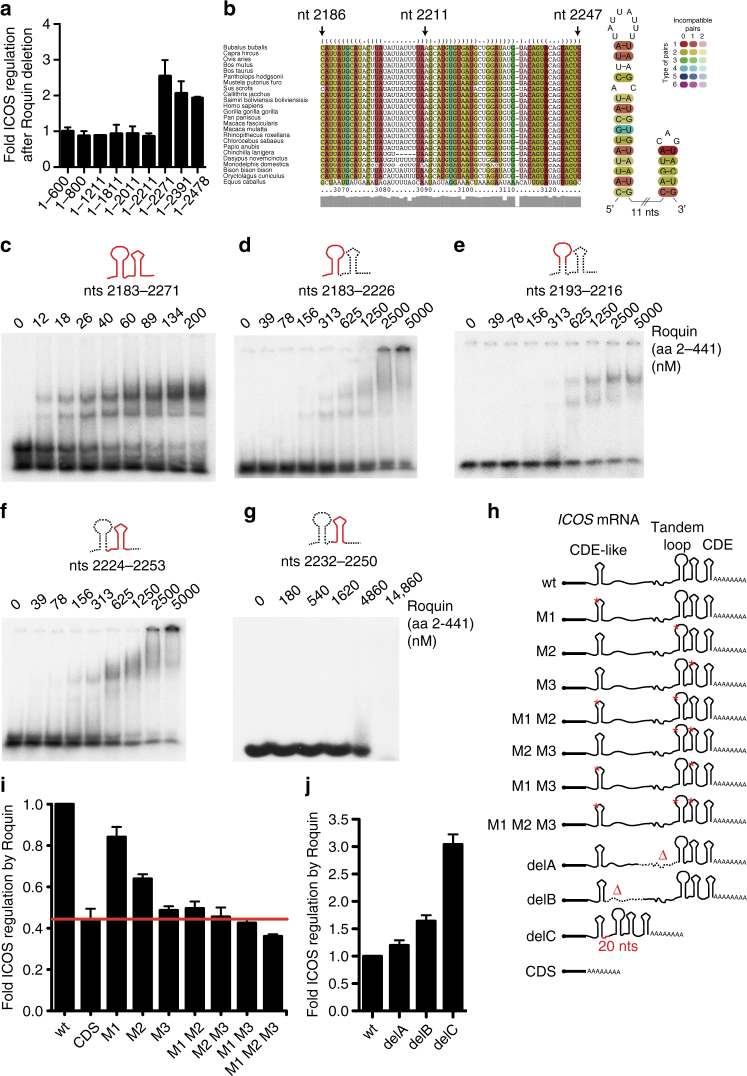
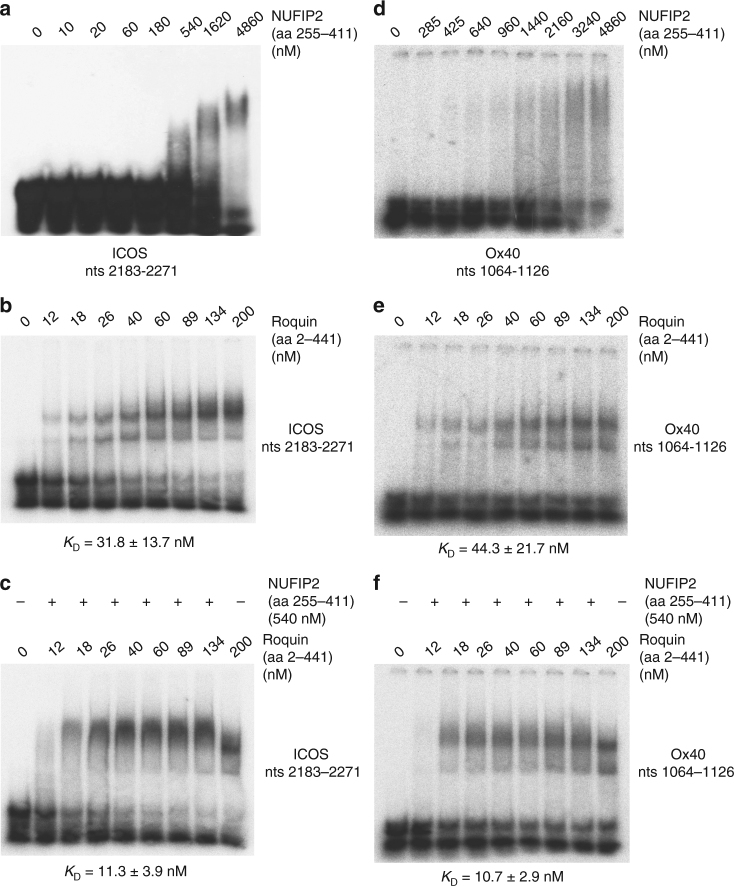
The ubiquitously expressed RNA-binding proteins Roquin-1 and Roquin-2 are essential for appropriate immune cell function and postnatal survival of mice. Roquin proteins repress target mRNAs by recognizing secondary structures in their 3'-UTRs and by inducing mRNA decay. However, it is unknown if other cellular proteins contribute to target control. To identify cofactors of Roquin, we used RNA interference to screen ~1500 genes involved in RNA-binding or mRNA degradation, and identified NUFIP2 as a cofactor of Roquin-induced mRNA decay. NUFIP2 binds directly and with high affinity to Roquin, which stabilizes NUFIP2 in cells. Post-transcriptional repression of human ICOS by endogenous Roquin proteins requires two neighboring non-canonical stem-loops in the ICOS 3'-UTR. This unconventional cis-element as well as another tandem loop known to confer Roquin-mediated regulation of the Ox40 3'-UTR, are bound cooperatively by Roquin and NUFIP2. NUFIP2 therefore emerges as a cofactor that contributes to mRNA target recognition by Roquin.


Conflict of interest statement

The authors declare no competing financial interests.

Figures

Fig. 1
Fig. 1
A targeted siRNA screen to identify cofactors of Roquin-mediated post-transcriptional gene regulation. a Immunoblot analysis of Roquin-1, Roquin-2, and α-Tubulin expression or b flow cytometry of ICOS and mCherry expression in HeLa reporter cells containing cassettes for stable ICOS and doxycycline-inducible Roquin-1-P2A-mCherry overexpression. Cells were either treated with doxycycline (dox) for 18 h or left untreated. c Schematic representation of the screen workflow. d Distribution of ICOS mean fluorescence intensity (MFI) in HeLa reporter cells after transfection with Roquin-1-targeting siRNA pools (siRc3h1) or non-targeting control siRNAs (siCtrl) in a 96-well plate. The Z′ factor was calculated from mean and SDs of positive (siRc3h1) and negative (siCtrl) control data. e Normalized screen data of the customized siRNA library for Roquin-1 cofactors. ICOS MFI of each sample was normalized into a Z score based on plate mean and SD. Ranked Z scores are shown for each siRNA pool. Each data point with an average Z score >2 was considered a hit
Fig. 2
Fig. 2
Deconvolution of siRNA pools to validate genuine hits. a Flow cytometry analysis of ICOS and mCherry expression in HeLa reporter cells treated with individual or pooled CNOT1 or NUFIP2 siRNAs (red) or non-targeting control siRNAs (siCtrl) (black). Prior to analysis, cells were treated with doxycycline for 18 h to induce Roquin-1 overexpression. b Quantified ICOS MFI of cells shown in a. Expression levels were normalized to siCtrl-treated cells. c qPCR analysis of CNOT1 or NUFIP2 mRNA expression in cells from a. Expression was calculated relative to the reference gene YWHAZ and normalized to siCtrl-treated cells. Error bars in b and c represent mean and SD of three independent experiments. In a representatives of three independent experiments are shown. Statistical significance in b was calculated with one-way ANOVA Kruskal−Wallis test followed by Dunn’s multiple comparisons test (*p < 0.05, **p < 0.01)
Fig. 3
Fig. 3
ICOS repression by NUFIP2 depends on Roquin expression. a MFI of ICOS expression or b qPCR analysis of NUFIP2 and CNOT1 relative to YWHAZ mRNA expression after siRNA knockdown of NUFIP2 or CNOT1 in HeLa reporter cells using siGENOME siRNA pools. c Immunoblot analysis of NUFIP2 and CNOT1 expression in HeLa reporter cells after treatment with the siGENOME NUFIP2 or CNOT1 siRNA pool, respectively. d Immunoblot analysis of NUFIP2 expression in reporter cells that were transduced with GFP- or GFP-NUFIP2 by retroviral infection. e Flow cytometry analysis of GFP expression in HeLa reporter cells that were transduced with different amounts of GFP- or siRNA-resistant GFP-NUFIP2 by retroviral infection. f GFP- or siRNA-resistant GFP-NUFIP2-expressing reporter cells from e were transfected with NUFIP2-targeting or control siRNAs and Roquin expression was induced with doxycycline. ICOS expression was measured by flow cytometry and normalized to siCtrl-treated cells. ICOS expression in cells with high (hi) or intermediate (med) GFP-expression is compared with that of low (lo) GFP-expressing cells. g qPCR analysis of NUFIP2, RC3H1, and RC3H2 mRNA expression in HeLa reporter cells after transfection with the indicated siRNAs. Expression relative to the reference gene YWHAZ was normalized to the non-targeting control. h ICOS mRNA decay curves of HeLa reporter cells after treatment with the siGENOME NUFIP2-targeting siRNA pool, a combination of siRNAs against RC3H1 and RC3H2 (Invitrogen) or a combination of all three targets or a non-targeting control siRNA. Forty-eight hours after transfection, cells were seeded for treatment with 5 µg/mL actinomycin D the next day. Cells were treated for 30–240 min and ICOS expression was determined by qPCR analysis and normalized to YWHAZ. In c and e representatives of three independent experiments are shown. Error bars in a, b, d, f, g, and h represent mean and SDs of three (a, b, f, g) or four (d, g, h) independent experiments. mRNA half-life in h was calculated with Graph Pad Prism from four independent experiments. In a and f statistical significance was calculated with one-way ANOVA Kruskal−Wallis test followed by Dunn’s multiple comparisons test (*p < 0.05)
Fig. 4
Fig. 4
Nufip2 protein is stabilized by Roquin. a Immunoblot analysis of Roquin, Nufip2, and Fmrp proteins in MEF lysates and supernatants or precipitates of b-isox-treated extracts. b Flow cytometry imaging analysis of GFP-Nufip2 localization in activated Th1 cells from Rc3h1fl/fl; Rc3h2fl/fl; Cd4-Cre-ERT2; rtTA mice. Before analysis, retrovirally transduced cells were treated with doxycycline for 24 h to induce GFP-NUFIP2 expression. cf Immunoblot analysis of Nufip2 (c) or Nufip2 and Roquin (df) in c different mouse tissues, d mouse CD4+ T cells left untreated or stimulated for 12 h with (α-CD3) alone or in combination with anti-CD28 (α-CD28) or anti-ICOS (α-ICOS), e mouse CD4+ T cells with (Rc3h1/2fl/fl) or without (Rc3h1/2fl/fl; Cd4-Cre) Roquin expression, or f in lysates from wild-type and Roquin–deficient MEF cells, reconstituted with wild-type or Roquin-1 mutants as indicated. Gapdh (ce) or α-tubulin (f) served as loading controls. g qPCR analysis of Nufip2 mRNA expression in cells from f. Expression was calculated relative to the reference gene Ywhaz and normalized to untransduced cells. Error bars in g represent mean and SD of two independent experiments. In a, b, d, e and f representatives of two (d, e, f) or three (a, b) independent experiments are shown
Fig. 5
Fig. 5
Direct physical interaction between Nufip2 and Roquin. Immunoblots were analyzed with antibodies against Nufip2 and Roquin, Roquin and GFP or Nufip2 and GFP. Anti-GFP or anti-Roquin immunoprecipitation from lysates of HEK293T cells transfected with the indicated expression vectors (a, b, e) and anti-Roquin (c) or anti-Nufip2 (d) immunoprecipitation of endogenous proteins from MEF cells of the indicated genotypes are shown. a Extracts were treated during immunoprecipitation with or without RNase as indicated and degradation of rRNA by RNase treatment was confirmed by ethidium bromide (EtBr) staining of RNA extracts from IP supernatants. f Representative coomassie-stained PAGE of purified Roquin-1 (aa 2–441) and NUFIP2 (aa 255–411) proteins. g, h Surface plasmon resonance study of the binding of NUFIP2 (aa 255–411) to immobilized Roquin-1 (aa 2–441). g Biacore sensogram recording the binding of NUFIP2 (aa 255–441) injected at two-fold serial dilutions ranging from 0.063 to 4 μM to Roquin-1 (aa 2–441). After the highest concentration, the 0.5 μM sample dilution was re-injected to assess potential accumulation of unspecific background binding. h Steady-state affinity analysis of the binding level in response units (RUs) against the Nufip2 (aa 255–411) protein concentration shown in a representative fitting curve. In ae and gh one representative of two (d) or three (ac, e, gh) independent experiments is shown. The KD in h was calculated from mean and SD of three independent experiments
Fig. 6
Fig. 6
Mutually exclusive interaction of Nufip2 with Fmrp or Roquin. a Representative coomassie-stained PAGE of purified mFmrp (aa 1–132). b Biacore sensogram recording of the binding of NUFIP2 (aa 255–441) injected at 4 μM to surface-coupled Roquin-1 (aa 2–441) in the presence of increasing amounts (0.016–1 μM) of Fmrp (aa 1–132). The quality of Biacore experiments was assessed by two independent injections of 1 µm Fmrp and 4 µm NUFIP2 at different time points during each experiment. c Immunoprecipitation of endogenous NUFIP2 from lysates of HEK293T cells that were transiently transfected with Roquin-1 with or without co-transfection of FLAG-Fmrp using a monoclonal Nufip2 antibody. Immunoblot analysis to detect Nufip2, Fmrp and Roquin-1/2 after Nufip2 immunoprecipitation (IP) is shown. dg Analysis of splenic CD4+ T cells from wild-type (wt) and Fmrp-deficient (Fmr1−/−) mice. d, e Flow cytometry analysis of CD4+ T cells showing naive (CD62Lhi CD44lo), effector-memory (CD62Llo CD44hi), or central-memory (CD62Lhi CD44hi) (d) or e Foxp3+ Tregs among CD4+ pre-gated T cells. f Flow cytometry analysis of ICOS expression on the surface of Foxp3+ splenic CD4+ T cells. g Quantified ICOS expression on CD4+ T cells isolated from Fmrp-deficient or wild-type mice in a 6-day in vitro culture. One representative of two (c) or three (b) independent experiments are shown in b and c. In df data are representative of four mice per genotype and g shows mean and SD of four mice per genotype
Fig. 7
Fig. 7
An unconventional cis-element in the ICOS mRNA is recognized by Roquin and critical for post-transcriptional repression. a Reporter regulation of gradually shortened ICOS 3′-UTR fragments in response to 4′ OH-tamoxifen (4′ OH-TAM) induced deletion of endogenous Roquin in Rc3h1fl/fl; Rc3h2fl/fl; Cre-ERT2 MEF cells. ICOS expression was quantified by flow cytometry. Fold regulation was determined by dividing (ICOS MFI +4′ OH-TAM)/(ICOS MFI –4′ OH-TAM) and normalized to the regulation of ICOS 1–600 (CDS). b Sequence-structure alignment of the putative Roquin-active ICOS cis-element and consensus secondary structure of putative Roquin-binding stem-loop motifs are shown. The number of different types of base pairs for a consensus pair is indicated by different colors, the number of incompatible pairs by the saturation of the consensus base pair. A consensus secondary structure is depicted on the right. cg Electrophoretic mobility-shift assays (EMSAs) with increasing amounts of Roquin-1 (aa 2–441) incubated with ICOS RNA fragments as indicated. Labeled in red is the part of the consensus secondary structure shown in b that is included in the respective ICOS RNA fragment. g At the highest protein concentration unspecific RNA binding was observed, as detected by a broad smear of retarded RNA. h Schematic representation of ICOS reporter constructs bearing mutant stem-loops. Mutations designed to destroy the secondary structure of selected RNA elements are indicated by asterisks. i, j Reporter regulation of the stem-loop and deletion mutants from h in response to 4′ OH-TAM induced deletion of endogenous Roquin in Rc3h1fl/fl; Rc3h2fl/fl; Cre-ERT2 MEF cells. Fold regulation was determined by dividing (ICOS MFI +4′ OH-TAM)/(ICOS MFI –4′ OH-TAM) and normalized to the regulation of ICOS wt. Error bars in a, i and j indicate mean and SDs of two (a) or four (i, j) independent experiments. In cg representatives of three independent experiments are shown
Fig. 8
Fig. 8
Cooperative binding of NUFIP2 and Roquin to response elements in ICOS and Ox40 mRNA. a EMSA performed with the ICOS (nt 2183–2271) RNA (ac) or Ox40 (nt 1064–1126) RNA (df) using increasing amounts (0–4860 nm) of NUFIP2 (aa 255–411) (a, d) or increasing amounts (0–200 nm) of Roquin-1 (aa 2–441) (b, e), or using increasing amounts (0–200 nm) of Roquin-1 (aa 2–441) in the presence or absence of 540 nm NUFIP2 (c, f)

Similar articles

Cited by

References

    1. Janowski R, et al. Roquin recognizes a non-canonical hexaloop structure in the 3’-UTR of Ox40. Nat. Commun. 2016;7:11032. doi: 10.1038/ncomms11032. - DOI - PMC - PubMed
    1. Sakurai S, Ohto U, Shimizu T. Structure of human Roquin-2 and its complex with constitutive-decay element RNA. Acta Crystallogr. F. Struct. Biol. Commun. 2015;71:1048–1054. doi: 10.1107/S2053230X15011887. - DOI - PMC - PubMed
    1. Schlundt A, et al. Structural basis for RNA recognition in roquin-mediated post-transcriptional gene regulation. Nat. Struct. Mol. Biol. 2014;21:671–678. doi: 10.1038/nsmb.2855. - DOI - PubMed
    1. Tan D, Zhou M, Kiledjian M, Tong L. The ROQ domain of Roquin recognizes mRNA constitutive-decay element and double-stranded RNA. Nat. Struct. Mol. Biol. 2014;21:679–685. doi: 10.1038/nsmb.2857. - DOI - PMC - PubMed
    1. Sgromo A, et al. A CAF40-binding motif facilitates recruitment of the CCR4-NOT complex to mRNAs targeted by Drosophila Roquin. Nat. Commun. 2017;8:14307. doi: 10.1038/ncomms14307. - DOI - PMC - PubMed

Publication types

MeSH terms