. 2018 Jan 19;8(1):1189.
doi: 10.1038/s41598-017-19114-y.

Efficient differentiation of human pluripotent stem cells into skeletal muscle cells by combining RNA-based MYOD1-expression and POU5F1-silencing

Affiliations

Efficient differentiation of human pluripotent stem cells into skeletal muscle cells by combining RNA-based MYOD1-expression and POU5F1-silencing

Tomohiko Akiyama et al. Sci Rep. .

Abstract

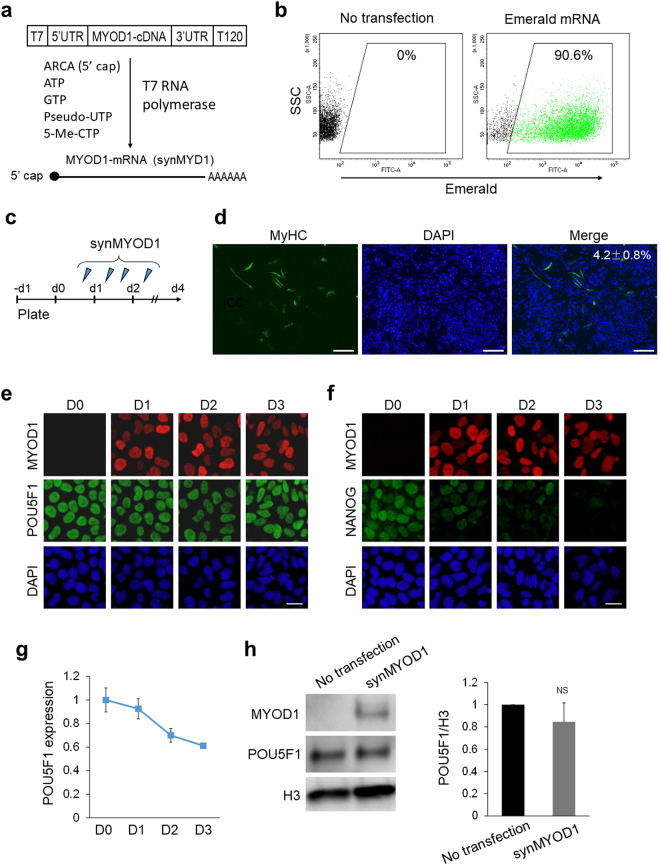
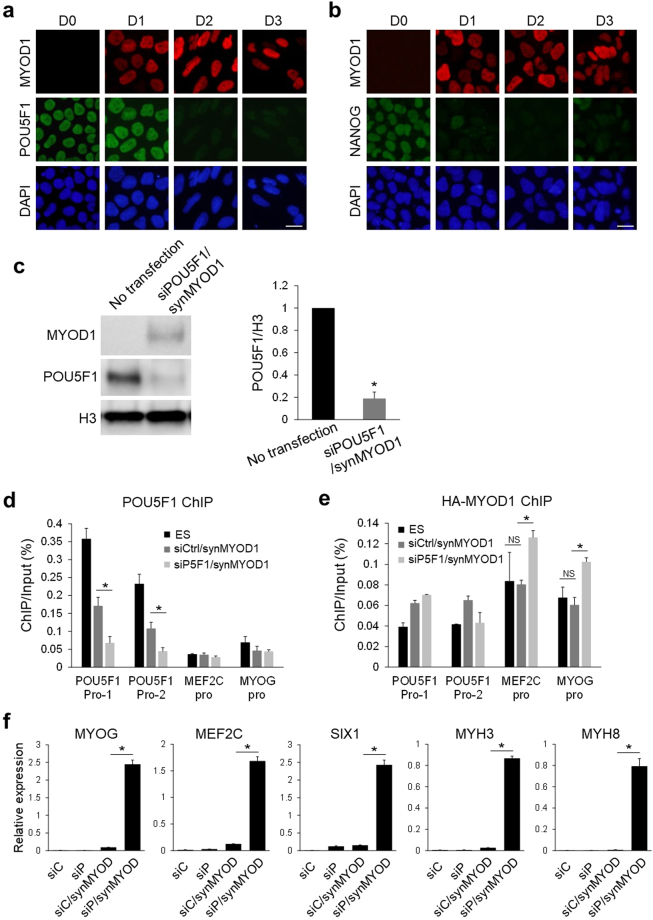
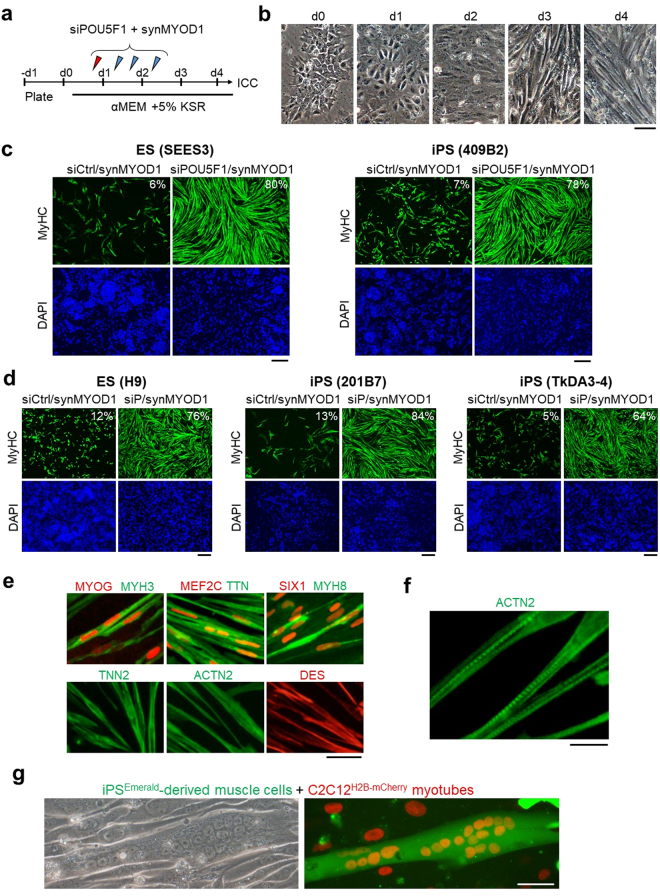
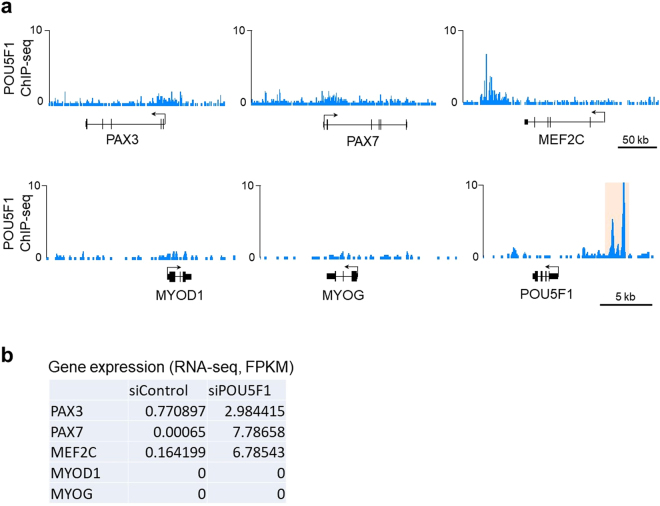
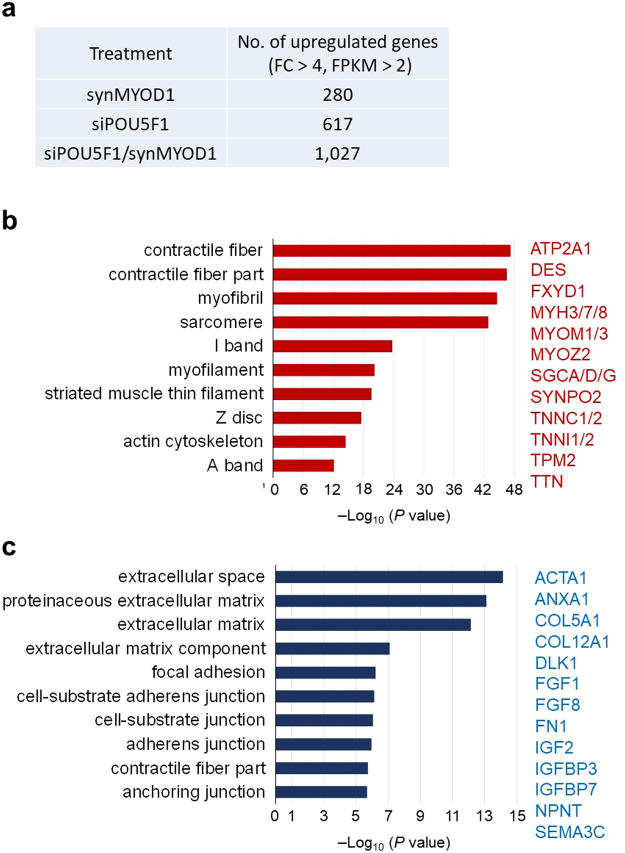
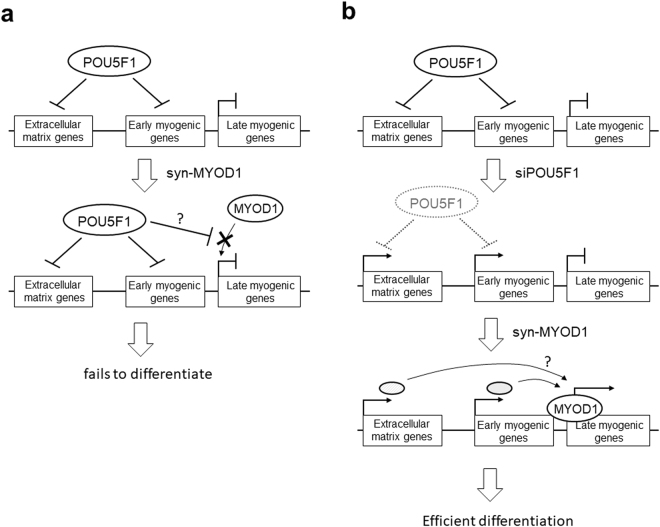
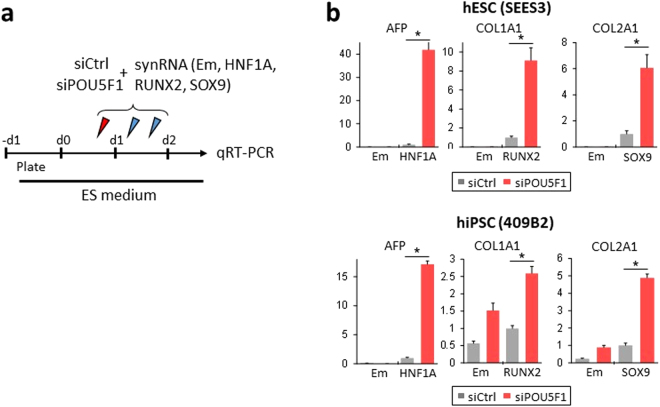
Direct generation of skeletal muscle cells from human pluripotent stem cells (hPSCs) would be beneficial for drug testing, drug discovery, and disease modelling in vitro. Here we show a rapid and robust method to induce myogenic differentiation of hPSCs by introducing mRNA encoding MYOD1 together with siRNA-mediated knockdown of POU5F1 (also known as OCT4 or OCT3/4). This integration-free approach generates functional skeletal myotubes with sarcomere-like structure and a fusion capacity in several days. The POU5F1 silencing facilitates MYOD1 recruitment to the target promoters, which results in the significant activation of myogenic genes in hPSCs. Furthermore, deep sequencing transcriptome analyses demonstrated that POU5F1-knockdown upregulates the genes associated with IGF- and FGF-signaling and extracellular matrix that may also support myogenic differentiation. This rapid and direct differentiation method may have potential applications in regenerative medicine and disease therapeutics for muscle disorders such as muscular dystrophy.


Conflict of interest statement

The authors declare that they have no competing interests.

Figures

Figure 1
Figure 1
POU5F1 expression is stably sustained in MYOD1-mRNA (synMYOD1)-treated hESCs. (a) synMYOD1 was synthesized in vitro with T7 RNA polymerase. The template cDNA was flanked by 5′UTR and 3′UTR of alpha-globin with an oligo(T)120 for adding a polyA tail. ARCA (5′cap analog), pseudo-UTP, and 5-methyl-CTP were incorporated to increase mRNA stability and translation efficiency. (b) The percentage of mRNA transfection in hESCs was tested using synthetic mRNA encoding Emerald GFP by FACS analysis. (c) Schematic diagram of the transfection protocol. hESCs were transfected with synMYOD1 once on day 0, twice on day 1, and once on day 2. (d) Immunostaining analysis for MyHC in the synMYOD1-transfected cells. Nuclei were stained with DAPI. The percentage of MyHC-stained cells is shown (mean ± SEM from four independent biological replicates). Scale bar: 200 μm. (e) Immunostaining analysis for POU5F1 in the synMYOD1-transfected cells at day 0 to day 3 post transfection. MYOD1 was detected by a MYOD1 specific antibody. Nuclei were stained with DAPI. Scale bar: 10 μm. (f) Immunostaining analysis for NANOG in the synMYOD1-transfected cells at day 0 to day 3 post transfection. MYOD1 was detected by the specific antibody. Nuclei were stained with DAPI. Scale bar: 10 μm. (g) qRT-PCR analysis for POU5F1 expression day 0 to day 3 after transfection (mean ± SEM from two independent biological replicates). (h) Immunoblotting analysis for POU5F1 in the synMYOD1-transfected cells at day 3 post transfection. MYOD1 was detected by the specific antibody. The H3 antibody was used as a loading control. The relative intensities of POU5F1 signals normalized by H3 were compared between no transfection and synMYOD1 transfection (mean ± SEM from three independent biological replicates). NS: not significant. Uncropped images of the blots for Fig. 1h are shown in Supplementary Figure 7.
Figure 2
Figure 2
POU5F1 knockdown facilitates synMYOD1-induced myogenic gene activation. (a) Immunostaining analysis for POU5F1 in the siPOU5F1 and synMYOD1 (siPOU5F1/synMYOD1)-transfected cells at day 0 to day 3 post transfection. MYOD1 was detected by the specific antibody. Nuclei were stained with DAPI. Scale bar: 10 μm. (b) Immunostaining analysis for NANOG in the siPOU5F1/synMYOD1-transfected cells at day 0 to day 3 post transfection. MYOD1 was detected by the specific antibody. Nuclei were stained with DAPI. Scale bar: 10 μm. (c) Immunoblotting analysis for POU5F1 in the siPOU5F1/synMYOD1-transfected cells at day 3 post transfection. MYOD1 was detected by the specific antibody. The H3 antibody was used as a loading control. The relative intensities of POU5F1 signals normalized by H3 were compared between no transfection and siPOU5F1/synMYOD1 transfection (mean ± SEM from three independent biological replicates). *P < 0.01, t-test. (d) ChIP analysis showing POU5F1 enrichment at the promoter regions (Pro-1 and Pro-2) of POU5F1 in hESCs, siControl/synMYOD1-treated cells, and siPOU5F1/synMYOD1-treated cells. The promoter regions of MEF2C and MYOG were used as negative controls. The error bars indicate the SEM from three independent biological replicates. *P < 0.05, t-test. (e) ChIP analysis showing MYOD1 enrichment at the promoter regions of MEF2C and MYOG in hESCs, siControl/synMYOD1-treated cells, and siPOU5F1/synMYOD1-treated cells. mRNA encoding HA-tagged MYOD1 and anti-HA antibody was used in this experiment as the anti-MYOD1 antibody suitable for ChIP was not available. The promoter regions of POU5F1 were used as negative controls. The error bars indicate the SEM from two independent biological replicates. *P < 0.05, t-test. NS: not significant. (f) qPT-PCR analysis for the expression of myogenic markers in the siControl (siC), siPOU5F1 (siP), siC/synMYOD1, and siP/synMYOD1-treated cells. The expression levels were normalized to GAPDH. The error bars indicate the SEM from two independent biological replicates. *P < 0.01, t-test. Uncropped images of the blots for Fig. 2c are shown in Supplementary Figure 7.
Figure 3
Figure 3
siPOU5F1/synMYOD1 treatment induces efficient myogenic conversion of hPSCs. (a) Schematic of the myogenic differentiation protocol. hPSCs were transfected with siPOU5F1 together with synMYOD1 at the indicated time points. The mixture of siPOU5F1/synMYOD1 was transfected on day 0. synMYOD1 was transfected on days 1 and 2. The cells were cultured in αMEM + 5% KSR. (b) Morphological changes in the transfected cells. Scale bar, 50 μm. (c) Immunostaining analysis for MyHC in the hPSCs (SEES3 ESCs and 409B2 iPSCs) after the treatment with siControl/synMYOD1 or siPOU5F1/synMYOD1. Nuclei were stained with DAPI. The representative images are shown. The average percentages of MyHC-stained cells are obtained from three independent biological replicates. Scale bar: 200 μm. (d) Immunostaining analysis for MyHC in the hPSCs (H9 ESCs, 201B7 iPSCs, and TkDA3-4 iPSCs) after treatment with siControl/synMYOD1 or siPOU5F1/synMYOD1. Nuclei were stained with DAPI. The representative images are shown. The average percentages of MyHC-stained cells are obtained from three independent biological replicates. Scale bar: 200 μm. (e) Immunostaining analysis for MYOG, MEF2C, SIX1, MYH3, MYH8, titin (TTN), troponin T (TNN2), actinin alpha 2 (ACTN2), and desmin (DES) in the siPOU5F1/synMYOD1-treated cells. Scale bar: 50 μm. (f) Higher magnification of ACTN2 staining. Scale bar: 20 μm. (g) 409B2-iPSCs expressing Emerald GFP were differentiated into myogenic cells and co-cultured with mouse C2C12 myotubes, nuclei of which were labeled with red fluorescence. Next day after co-culturing, cell fusions were detected. Scale bar: 50 μm.
Figure 4
Figure 4
POU5F1 binding profiles around the myogenic gene loci and the effect of POU5F1 knockdown on the expression of the genes. (a) ChIP-sequencing tracks of POU5F1 for the loci of myogenic genes: PAX3, PAX7, MEF2C, MYOD1, and MYOG. The POU5F1 locus is shown as a positive control for the POU5F1 binding sites (orange). The data was obtained from a previous study (b) Expression levels of myogenic genes in the siControl- and siPOU5F1-treated cells were analyzed by RNA-sequencing. The FPKM values are shown.
Figure 5
Figure 5
Transcriptome analysis of the synMYOD1-, siPOU5F1-, and siPOU5F1/synMYOD1-treated cells. (a) The number of upregulated genes in the synMYOD1-, siPOU5F1-, and siPOU5F1/synMYOD1-treated cells (fold change (FC) > 4 compared with the control ESCs, FPKM values > 2). The number of total genes examined is 20,563. (b) Functional annotation analysis of the upregulated genes following siPOU5F1/synMYOD1 transfection. The highly upregulated genes (289 genes, FC > 10 compared with the control ESCs, FPKM > 10) were analyzed to annotate the GO terms related to the cellular component. The P-value indicates the significance of the GO term enrichment. Representative genes are shown. (c) Functional annotation analysis of the upregulated genes following siPOU5F1 transfection that were also upregulated in the siPOU5F1/synMYOD1 treatment (273 genes). The genes were analyzed to annotate the GO terms related to the cellular component. The P-value indicates the significance of the GO term enrichment. Representative genes are shown.
Figure 6
Figure 6
A model of the mechanism for the effective myogenic differentiation of hPSCs with siPOU5F1 and synMYOD1. (a) In hPSCs, POU5F1 directly represses the expression of the genes related to extracellular matrix and early myogenic genes such as PAX3 and PAX7. Additionally, when synMYOD1 alone is introduced in hPSCs, POU5F1 inhibits the access of the translated MYOD1 protein to the target late myogenic genes such as MEF2C and MYOG, which results in the failure of myogenic differentiation. (b) Knockdown of POU5F1 with siPOU5F1 causes the activation of extracellular matrix genes and early myogenic genes. Consequently, when synMYOD1 is introduced, the translated MYOD1 protein can access to the promoters of the late myogenic genes to activate terminal myogenic gene activation. These mechanisms facilitate the rapid and highly efficient myogenic differentiation in hPSCs.
Figure 7
Figure 7
siPOU5F1 facilitates the upregulation of relevant tissue-specific markers mediated by other transcription factor synRNAs. (a) Experimental schematic for (b). hESC/iPSCs were transfected with siCtrl or siPOU5F1 and synRNAs for HNF1A, RUNX2, and SOX9 at the indicated time points. Emerald synRNA was used as a control. A mixture of siRNA and synRNA was transfected on the first day. On day 2, only synRNA was transfected twice. The cells were cultured in ES maintenance medium and sampled for qRT-PCR analysis on day 2. (b) Relative gene expression levels of tissue-specific genes (AFP, COL1A1, and COL2A1) in hESCs (SEES3) and hiPSCs (409B2) transfected with siCtrl or siPOU5F1 and synRNA. The transfected synRNA of transcription factors are indicated on the horizontal axis. Em indicates Emerald synRNA. The expression levels were normalized against that of GAPDH. Error bars indicate SEM (n = 3). *P < 0.05, t-test.

References

    1. Zheng JK, et al. Skeletal myogenesis by human embryonic stem cells. Cell Res. 2006;16:713–722. doi: 10.1038/sj.cr.7310080. - DOI - PubMed
    1. Hwang Y, et al. Directed in vitro myogenesis of human embryonic stem cells and their in vivo engraftment. PLoS One. 2013;8:e72023. doi: 10.1371/journal.pone.0072023. - DOI - PMC - PubMed
    1. Davis RL, Weintraub H, Lassar AB. Expression of a single transfected cDNA converts fibroblasts to myoblasts. Cell. 1987;51:987–1000. doi: 10.1016/0092-8674(87)90585-X. - DOI - PubMed
    1. Goudenege S, et al. Myoblasts derived from normal hESCs and dystrophic hiPSCs efficiently fuse with existing muscle fibers following transplantation. Mol Ther. 2012;20:2153–2167. doi: 10.1038/mt.2012.188. - DOI - PMC - PubMed
    1. Tedesco FS, et al. Transplantation of genetically corrected human iPSC-derived progenitors in mice with limb-girdle muscular dystrophy. Sci Transl Med. 2012;4:140ra189. doi: 10.1126/scitranslmed.3003541. - DOI - PubMed

Publication types

MeSH terms

Substances