. 2018 Jan 19;8(1):1187.
doi: 10.1038/s41598-018-19459-y.

Early impoverished environment delays the maturation of cerebral cortex

Affiliations

Early impoverished environment delays the maturation of cerebral cortex

Roberta Narducci et al. Sci Rep. .

Erratum in

Abstract

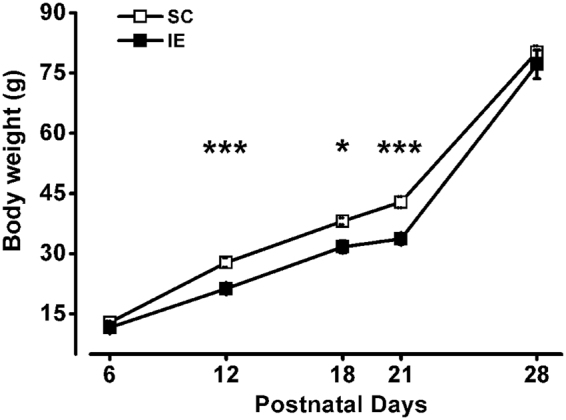
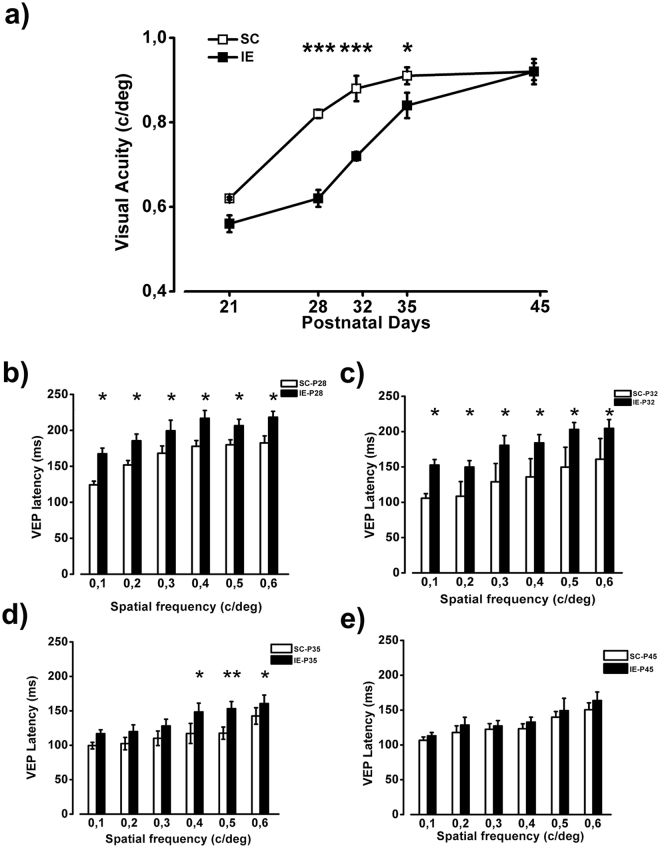
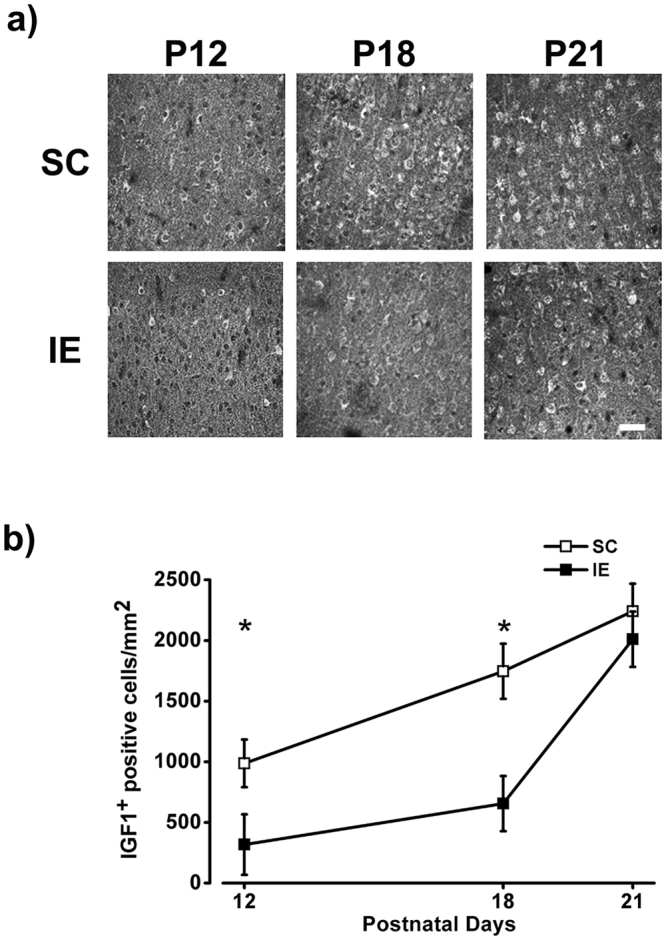
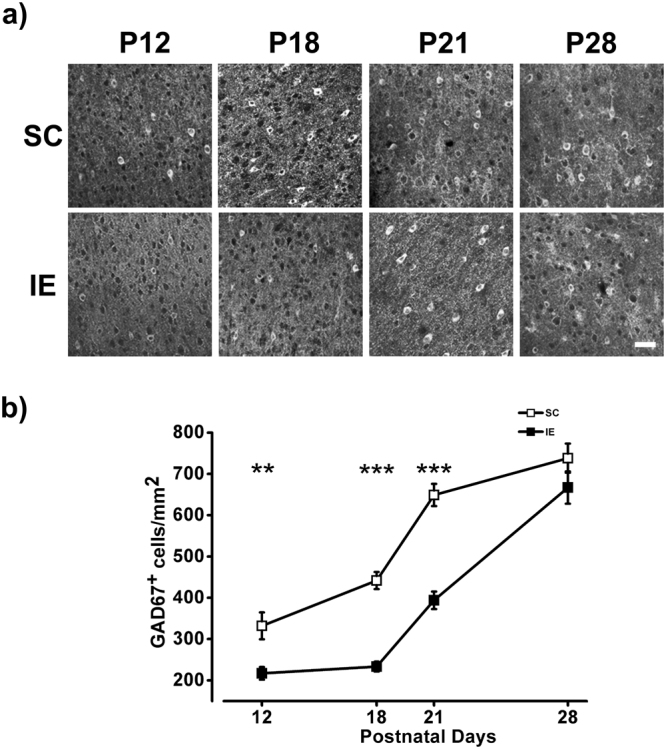
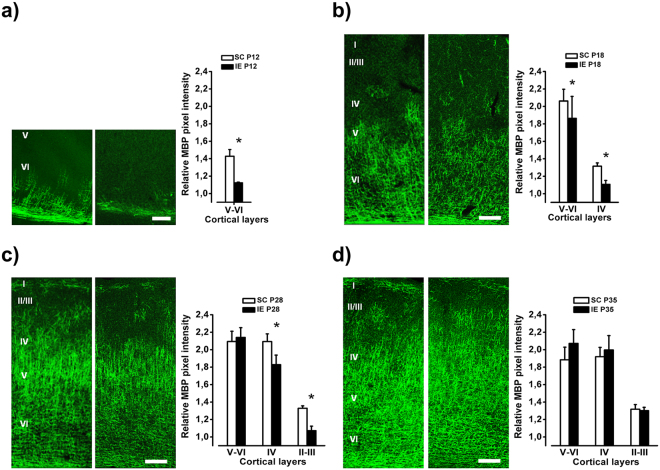
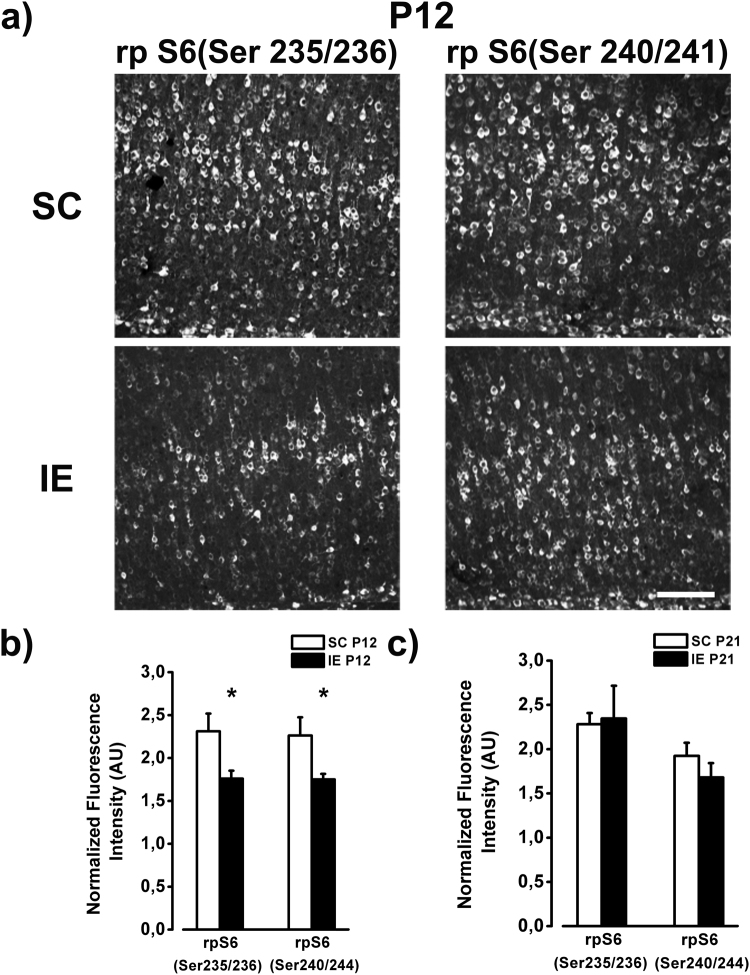
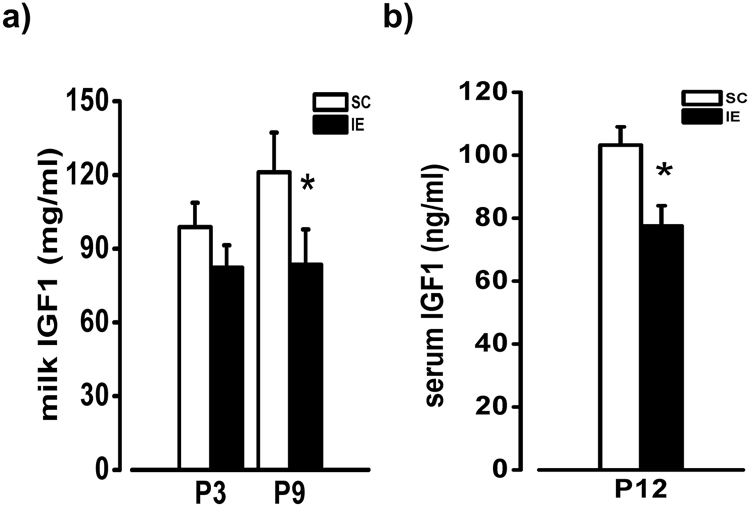
The influence of exposure to impoverished environments on brain development is unexplored since most studies investigated how environmental impoverishment affects adult brain. To shed light on the impact of early impoverishment on developmental trajectories of the nervous system, we developed a protocol of environmental impoverishment in which dams and pups lived from birth in a condition of reduced sensory-motor stimulation. Focusing on visual system, we measured two indexes of functional development, that is visual acuity, assessed by using Visual Evoked Potentials (VEPs), and VEP latency. In addition, we assessed in the visual cortex levels of Insulin-Like Growth Factor 1 (IGF-1) and myelin maturation, together with the expression of the GABA biosynthetic enzyme GAD67. We found that early impoverishment strongly delays visual acuity and VEP latency development. These functional changes were accompanied by a significant reduction of IGF-1 protein and GAD67 expression, as well as by delayed myelination of nerve fibers, in the visual cortex of impoverished pups. Thus, exposure to impoverished living conditions causes a significant alteration of developmental trajectories leading to a prominent delay of brain maturation. These results underscore the significance of adequate levels of environmental stimulation for the maturation of central nervous system.


Conflict of interest statement

The authors declare that they have no competing interests.

Figures

Figure 1
Figure 1
Developmental body-weight gain is delayed by impoverished environment. Body weight of IE animals was significantly decreased compared to that of SC rats at P12 (SC P12, n = 27; IE P12, n = 32; Two Way ANOVA, post-hoc Holm-Sidak method, p < 0.001), P18 (SC P18, n = 10; IE P18, n = 16; p < 0.05) and P21 (SC P21, n = 49; IE P21, n = 37; p < 0.001); no significant difference was found in the weight of SC and IE animals at P6 (SC P6, n = 50; IE P6, n = 36; Two Way ANOVA, post-hoc Holm-Sidak method, p = 0.35) and P28 (SC P28, n = 20; IE P28, n = 15; post-hoc Holm-Sidak method, p = 0.15). Symbols represent average values ± SEM. Error bars are smaller than the size of the symbols for most data points. Asterisks denote significant difference (*p < 0.05; ***p < 0.001).
Figure 2
Figure 2
Delayed functional maturation of visual cortex in IE rats. (a) Visual acuity (VA) of IE animals was significantly decreased compared to that of SC rats at P28 (SC P28, n = 6; IE P28, n = 6; Two Way ANOVA, post-hoc Holm-Sidak method, p < 0.001), P32 (SC P32, n = 5; IE P32, n = 7; p < 0.001) and P35 (SC P35, n = 5; IE P35, n = 6, p < 0.05) but not at P21 (SC P21, n = 3; IE P21, n = 6; Two Way ANOVA, post-hoc Holm-Sidak method, p = 0.09) and P45 (SC P45, n = 6; IE P45, n = 5; post-hoc Holm-Sidak method, p = 0.81). Symbols represent average VA values ± SEM. Error bars are smaller than the size of the symbols for some data points. (b,c) At P28 and P32 VEP latency of IE rats was increased with respect to SC animals at 0.1 c\deg, 0.2 c\deg, 0.3 c\deg, 0.4 c\deg, 0.5 c\deg and 0.6 c\deg (Two way RM ANOVA, post-hoc Holm-Sidak method, p < 0.05 for all comparisons). (d) At P35 P100 latency of IE rats was increased with respect to SC animals at 0.4 c\deg, 0.5 c\deg and 0.6 c\deg (Two way RM ANOVA, post-hoc Holm-Sidak method, p < 0.05 for all comparisons, except for p < 0.01 at 0.5 c/deg). e) VEP latencies at P45 were not different between SC and IE animals (Two way RM ANOVA, p = 0.42). Histograms represent latency average values ± SEM. *p < 0.05; **p < 0.01; ***p < 0.001.
Figure 3
Figure 3
Behavioral assessment of motor and cognitive functions in IE rats. (a–d) Open field test (OFT). (a) IE and SC animals performed similarly in the open field arena when the exploration was measured as mean distance to the arena border (SC P30, n = 16; IE P30, n = 16; t-test, p = 0.84). (b,c) T-test revealed that the IE behavior was different from that of SC animals both in terms of total distance moved and mean velocity in the open field maze (t-test, p < 0.001 and p < 0.001 respectively). (d) The percentage of time spent in the center part of the arena was not different between SC and IE rats (t-test, p = 0.933). (e) Assessment of sensorimotor coordination through vertical ladder climbing (VLT) confirmed a motor deficit in IE animals respect to SC (SC P30, n = 12; IE P30, n = 12; t-test, p < 0.05). (f–h) Object recognition task (ORT). (f) Both SC and IE rats spent equal amount of time exploring the two objects (OBJ1 and OBJ2) during the familiarization phase of the Object Recognition Test (SC P30, n = 16; IE P30, n = 16; paired t-test, p = 0.46 and p = 0.097). (g,h) SC showed a good information retention after both 1 and 24 hours (paired t-test, p < 0.01 and p < 0.001 respectively), while IE animals did not recognize the new object (NEW) with respect to the old one (OLD) either after 1 or after 24 hours (paired t-test, p = 0.06 and p = 0.08, respectively). Histograms represent average values ± SEM. *p < 0.05; **p < 0.01; ***p < 0.001.
Figure 4
Figure 4
IE affects IGF-1 expression in the visual cortex. (a) Representative examples of IGF-1 labeling from fields taken in the layers V/VI of the visual cortex of SC and IE rats at P12, P18 and P21. Calibration bar: 50 µm. (b) Number of IGF-1 positive (IGF-1+) cells/mm2 in the visual cortex of SC and IE animals. IGF-1+ cell density was lower in IE animals at P12 (SC P12, n = 7; IE P12, n = 4) and P18 (SC P18, n = 6; IE P18, n = 6; Two Way ANOVA, post-hoc Holm-Sidak method, p < 0.05 for both comparisons). The number IGF-1+ cells did not differ between SC and IE at P21 (SC P21, n = 5; IE P21, n = 5; Two Way ANOVA, post-hoc Holm-Sidak method, p = 0.48). Symbols represent average values ± SEM. *p < 0.05.
Figure 5
Figure 5
IE affects the density of inhibitory neurons in the visual cortex (a) Representative fields of GAD67 labeling taken in the layers V/VI of the visual cortex of SC and IE rats at P12, P18, P21 and P28. Calibration bar: 50 µm. (b) Quantification of GAD67 levels, in terms of number of GAD67 positive (GAD67+ cells/mm2), in the visual cortex of SC and IE animals. GAD67+ cell density was lower in IE animals at P12 (SC P12, n = 4; IE P12, n = 4; Two Way ANOVA, post-hoc Holm-Sidak method, p < 0.01), P18 (SC P18, n = 6; IE P18, n = 6; p < 0.001) and P21 (SC P21, n = 3; IE P21, n = 3; p < 0.001). The number GAD67 positive cells did not differ between SC and IE at P28 (SC P28, n = 3; IE P28, n = 3; Two Way ANOVA, post-hoc Holm-Sidak method, p = 0.1). Symbols represent average values ± SEM. **p < 0.01; ***p < 0.001.
Figure 6
Figure 6
IE delays axonal myelination in the visual cortex. (a) Left: Example of MBP labeling from fields taken in layers V/VI of the visual cortex of P12 SC and IE rats. Calibration bar: 50 μm. Right: Quantitative analysis of MBP immunofluorescence intensity in layers V/VI of the visual cortex of P12 animals. SC animals showed higher MBP expression in comparison to IE animals in the layers V/VI (SC P12, n = 4; IE P12, n = 6; Mann-Whitney Rank Sum Test, p < 0.05). (bd) Left: Example of MBP labeling from fields taken through all layers of the visual cortex in P18, P28 and P35 SC and IE rats. Calibration bar: 100 μm. Right: Quantitative analysis of MBP immunofluorescence intensity in all layers of the visual cortex of P18, P28 and P35 animals. At P18 SC animals showed higher MBP immunofluorescence in layers V/VI and IV (SC P18, n = 5; IE P18, n = 6; Two way RM ANOVA, Post-hoc Holm-Sidak method, p < 0.05). At P28 SC animals showed higher MBP expression in comparison to IE animals in the layers IV and II-III (SC P28, n = 6; IE P28, n = 6; Two way RM ANOVA, Post-hoc Holm-Sidak method, p < 0.05). The layers V-VI were completely myelinated and MBP expression did not differ between groups (p = 0.74). At P35 MBP immunofluorescence did not differ between SC and IE animals in any cortical layer (SC P35, n = 5; IE P35, n = 6; Two way RM ANOVA, p = 0.63). Histograms represent average values ± SEM. *p < 0.05.
Figure 7
Figure 7
Hypophosphorylation of rpS6 in IE brain. (a) Example of rp S6 labeling (Ser235/236 and Ser 240/241) from fields taken in the layers V/VI of the visual cortex of P12 SC and IE rats. Calibration bar: 100 µm. (b) Quantitative analysis of rp S6 immunofluorescence intensity in the visual cortex of P12 animals. SC animals showed higher rpS6 expression in comparison to IE animals both for the site Ser235/236 and for the site Ser240/244 (SC P12, n = 5; IE P12, n = 5, Two way ANOVA, post-hoc Holm-Sidak method, p < 0.05). (c) At P21 rp S6 expression did not differ between SC and IE animals (SC P21, n = 5; IE P21, n = 6; p = 0.48). Histograms represent average values ± SEM. *p < 0.05.
Figure 8
Figure 8
Decreased IGF-I concentration in the maternal milk and in pup serum. (a) RIA determination of IGF-I concentration in the milk of SC and IE dams. T-test revealed a difference at P9 (SC, n = 8; IE, n = 7; p < 0.05), but not at P3 (p  =  0.105) between SC and IE animals. (b) IGF-I levels in the serum of SC and IE pups at P12. T-test revealed a significant difference between SC and IE animals (SC, n = 9; IE, n = 9; p < 0.05). Histograms represent average values ± SEM. *p < 0.05.

References

    1. Rosenzweig MR. Environmental complexity, cerebral change, and behavior. Am. Psychol. 1966;21:321–332. - PubMed
    1. Berardi N, Nicoletta B, Alessandro S, Lamberto M. Brain structural and functional development: genetics and experience. Developmental Medicine & Child Neurology. 2015;57:4–9. - PubMed
    1. Cancedda L, et al. Acceleration of visual system development by environmental enrichment. J. Neurosci. 2004;24:4840–4848. - PMC - PubMed
    1. Landi S, et al. Retinal functional development is sensitive to environmental enrichment: a role for BDNF. FASEB J. 2007;21:130–139. - PubMed
    1. Brainard MS, Knudsen EI. Sensitive periods for visual calibration of the auditory space map in the barn owl optic tectum. J. Neurosci. 1998;18:3929–3942. - PMC - PubMed

Publication types

MeSH terms

LinkOut - more resources