. 2018 Jan 19;8(1):1214.
doi: 10.1038/s41598-018-19439-2.

Compositional Bias in Naïve and Chemically-modified Phage-Displayed Libraries uncovered by Paired-end Deep Sequencing

Affiliations

Compositional Bias in Naïve and Chemically-modified Phage-Displayed Libraries uncovered by Paired-end Deep Sequencing

Bifang He et al. Sci Rep. .

Abstract

Understanding the composition of a genetically-encoded (GE) library is instrumental to the success of ligand discovery. In this manuscript, we investigate the bias in GE-libraries of linear, macrocyclic and chemically post-translationally modified (cPTM) tetrapeptides displayed on the M13KE platform, which are produced via trinucleotide cassette synthesis (19 codons) and NNK-randomized codon. Differential enrichment of synthetic DNA {S}, ligated vector {L} (extension and ligation of synthetic DNA into the vector), naïve libraries {N} (transformation of the ligated vector into the bacteria followed by expression of the library for 4.5 hours to yield a "naïve" library), and libraries chemically modified by aldehyde ligation and cysteine macrocyclization {M} characterized by paired-end deep sequencing, detected a significant drop in diversity in {L} → {N}, but only a minor compositional difference in {S} → {L} and {N} → {M}. Libraries expressed at the N-terminus of phage protein pIII censored positively charged amino acids Arg and Lys; libraries expressed between pIII domains N1 and N2 overcame Arg/Lys-censorship but introduced new bias towards Gly and Ser. Interrogation of biases arising from cPTM by aldehyde ligation and cysteine macrocyclization unveiled censorship of sequences with Ser/Phe. Analogous analysis can be used to explore library diversity in new display platforms and optimize cPTM of these libraries.


Conflict of interest statement

The authors declare that they have no competing interests.

Figures

Figure 1
Figure 1
Analysis of diversity in naïve libraries. (a) The libraries were sequenced at every step of standard production of phage libraries: (i) synthesis of random oligonucleotide (“oligo”); (ii) extension and ligation into the vector; (iii) transformation into bacteria and expression of the library for 4.5 hours. After extension and ligation of synthesized oligonucleotides into the vector, the library was sequenced before the transformation into bacteria. (b) Synthetic NT-TriNuc library. (c) Primers used for amplifying ligated or naïve oligonucleotide DNA. (d) Generation of PCR product. Alignment of forward and reverse primers to 18-bp and 14-bp sequences flanking the variable region at the N-terminus of the pIII gene in M13KE vector, respectively.
Figure 2
Figure 2
Workflow of the paired-end processing pipeline. The MATLAB script converts FASTQ files to the final table files via several steps: (a) combining F and R reads and mapping of sequencing barcodes; (b) tiling alignment of F and R FASTQ files to yield a FASTQ-like aligned format; (c) Addition of F + R reads. (d) parsing to match FA and RA sequences, permitting one mutation in each of the FA or RA regions; discarding reads with FR-mismatches in the library region; (e) translating the library reads and converting to a frequency table. A FASTQ file (in a) has four lines for each sequence: Line 1 begins with a ‘@’ character and is followed by a sequence identifier and an optional description; Line 2 is the raw sequence letters; Line 3 begins with a ‘ + ’ character and is optionally followed by the same sequence identifier (and any description) again; Line 4 encodes the quality values for the sequence in Line 2, and must contain the same number of symbols as letters in the sequence. “/AAAAEEEE.” (in a) is part of the standard FASTQ-format for ASCII-encoding of Phred quality scores. “Stuffers” (in c) are added symbols to find an optimal alignment between the F and R reads.
Figure 3
Figure 3
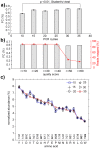
Effect of PCR parameters on quality of deep sequencing. (a) Increasing the number of PCR cycles from 10 to 35 led to only subtle changes in percentage (0.5% to 0.7%) of forbidden codons (FC). (b) The percentage of FC did not change significantly when reads were filtered by quality scores, but the overall fraction of mapped reads decreased dramatically when over-stringent quality filtering was employed. (c) We observed minor drift in the relative ratio of each TriNuc codon in all four positions of the synthetic libraries of Ser-X-Cys-XXX-Cys peptides when the number of PCR cycles was increased from 10 to 35.
Figure 4
Figure 4
Composition of NT-TriNuc library before and after expression. (a) Distribution of TriNuc codons in all four positions of the synthetic, ligated and naïve Ser-X-Cys-XXX-Cys tetrapeptide libraries. (b) The distribution of copy numbers in the libraries was calculated using random samples of 60,000 reads from the library. Error bars are standard deviations. For reference, we used random libraries of 60,000 peptides with a uniform ratio of 19 amino acids. (c) Description of a plot showing each peptide in the library as a unique pixel in a specific location. A model 5 × 5 letter plot with 25 × 25 = 625 pixels describes the location of common 4-letter words that contain the letters A, B, C, D and E. (df) In the 20:20 plot, the top left quadrant has all peptides of sequence RRxx, top right: RCxx; bottom left: CRxx and bottom right: CCxx. Color indicates the copy number. Each plot contains a random sample of 886,000 reads from deep sequencing for synthetic, ligated and naïve libraries (this number represents ~7 × coverage of theoretical peptide diversity (194 = 1.3 × 105)).
Figure 5
Figure 5
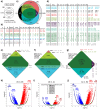
Differential enrichment analysis of NT-TriNuc and NT-SX4 libraries. (a) Venn Diagram comparison of Naïve {N} and Synthetic {S} sets and definitions of common (COM) and uniquely present sequences (UPS, UPN). (b) Table of sequences and their copy numbers observed in sequencing highlights that sequences from COM, UPS, UPN subsets can be differentially enriched (DE) and non-DE. (c) Comparison of {S}, {N} and ligated {L} sets, and definition of “uniquely absent” sets (UAS, UAL and UAN). (d) Example of reads, their copy numbers and their classifications; there exist several DE-classes (see Figure S13 for further classification). (e) To-scale representation of the entire NT-TriNuc library, in which the area of each segment is proportional to the number of unique sequences in each type listed in (b). For example, there are 95,373 (COM1: 72,078, COM2: 11,645, COM3: 11,650) unique sequences present both in {S} and {N} sets. (f) Analogous description of NT-NNK library. 38% of the library contains sequences that are neither significantly enriched nor depleted between {S} and {N} (COM1: 38.3%). About 27% of library sequences are uniquely present in {S} (UPS1: 6.9% and UPS2: 20%). (g) Analogous to-scale representation of an overlay of {S} and {L} and {N} from NT-TriNuc library shows that of 26% of sequences identified as UPN in (e), 22% are present in both {S} and {L} (i.e., “Uniquely Absent from Naïve” or UAN) and only 3.2% and 0.4% are unique to {S} or {L}. Note that in the COM set in (g), DE-information is omitted for clarity. (hj) Volcano plots describing DE-comparison of {S}, {N} and {L}. {S} and {L} are most similar to one another whereas {N} is different from both {S} and {L}. The sequences listed in (b) are mapped on each volcano plot. Abbreviations: DES – differentially enriched in synthetic, DEL – differentially enriched in ligated, DEN – differentially enriched in naïve, 0S – not present in synthetic, 0L – not present in ligated, 0N– not present in naïve. For details and algorithm for DE-analysis see R.zip file in the Supplementary Information for *RMD R-code. A detailed description of the terms is available in Figure S16.
Figure 6
Figure 6
Diversity of libraries cloned in different locations of phage capsid. (a) Description of a plot describing each peptide in the library as a unique pixel in a specific location. A model 5 × 5 letter plot with 25 × 25 = 625 pixels describes the location of common 4-letter words that contain the letters A, B, C, D and E. (bd) The 20:20 plot, where color indicates the copy number and each plot contains a random sample of 1.4 million reads from deep sequencing of (b) naïve NT-SX4 libraries, (c) synthetic SX4 libraries and (d) naïve ID-SX4 libraries. In 20:20 plot, as in 5 × 5 plot in panel (a), each tetrapeptide is represented by a unique pixel in a specific location. The top left quadrant has all peptides of sequence RRxx, top right: RCxx; bottom left: CRxx and bottom right: CCxx. The number of reads sampled (1.4 × 106) represents 0.08 × coverage of theoretical nucleotide sequence diversity (414 = 1.67 × 107) and ~10 fold average coverage of theoretical peptide diversity (204 = 1.6 × 105). (e) Schematic comparison of NT-SX4 and ID-SX4 library production. In the NT-SX4 library (left), the SX4 library is expressed at the N-terminus of the N1 domain of pIII, while in the ID-SX4 library (right), the same library is expressed between N1 and N2 domains of pIII.
Figure 7
Figure 7
Diversity of libraries before and after chemical modification. (ac) Workflow of chemical modification of the NT-TriNuc library. (df) Comparison of the peptide sequence composition of libraries before (e) and after chemical modification by AOB (d) or bDCO (e) and capture of the reacted populations. Compared to the library before modification, an interesting lack of Phe/Ser-containing peptides was observed in chemically modified libraries. This bias was more pronounced in N-terminal modification with AOB, compared to Cys-mediated cyclization with bDCO. (gi) Visualization of the normalized ratio of “captured” populations compared to the population before modification. (h) The shape of distribution produced by comparing unmodified and bDCO-modified populations was similar to the ratio of sequences randomly sampled ten times from a sum of populations described in (d), (e) and (f) (red diamonds).

Similar articles

Cited by

References

    1. Nelson AL, Dhimolea E, Reichert JM. Development trends for human monoclonal antibody therapeutics. Nat Rev Drug Discov. 2010;9:767–774. doi: 10.1038/nrd3229. - DOI - PubMed
    1. Hamzeh-Mivehroud M, Alizadeh AA, Morris MB, Church WB, Dastmalchi S. Phage display as a technology delivering on the promise of peptide drug discovery. Drug Discov Today. 2013;18:1144–1157. doi: 10.1016/j.drudis.2013.09.001. - DOI - PubMed
    1. Liu, R., Li, X., Xiao, W. & Lam, K. S. Tumor-targeting peptides from combinatorial libraries. Adv Drug Deliv Rev (2016). - PMC - PubMed
    1. Martins IM, Reis RL, Azevedo HS. Phage Display Technology in Biomaterials Engineering: Progress and Opportunities for Applications in Regenerative Medicine. ACS Chem Biol. 2016;11:2962–2980. doi: 10.1021/acschembio.5b00717. - DOI - PubMed
    1. Lee YJ, et al. Fabricating genetically engineered high-power lithium-ion batteries using multiple virus genes. Science. 2009;324:1051–1055. - PubMed

Publication types