. 2018 Jan 19;8(1):1171.
doi: 10.1038/s41598-018-19211-6.

Efficient scalable production of therapeutic microvesicles derived from human mesenchymal stem cells

Affiliations

Efficient scalable production of therapeutic microvesicles derived from human mesenchymal stem cells

Jae Min Cha et al. Sci Rep. .

Abstract

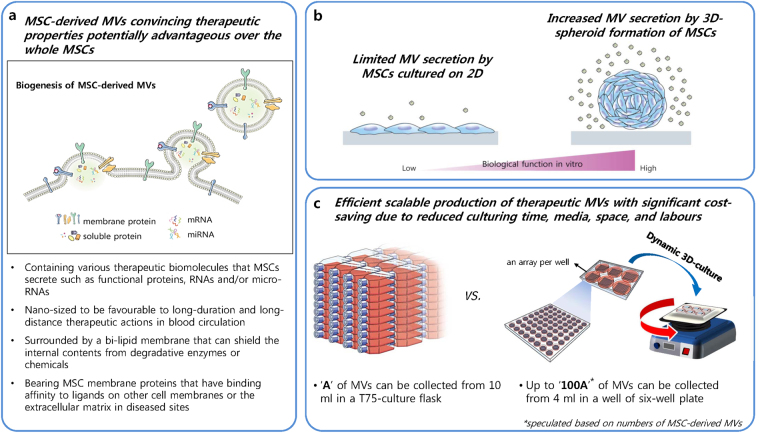
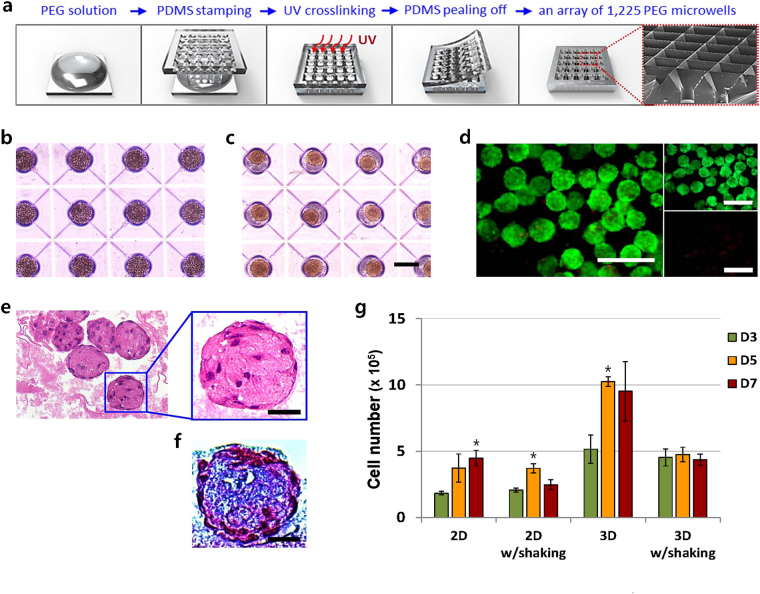
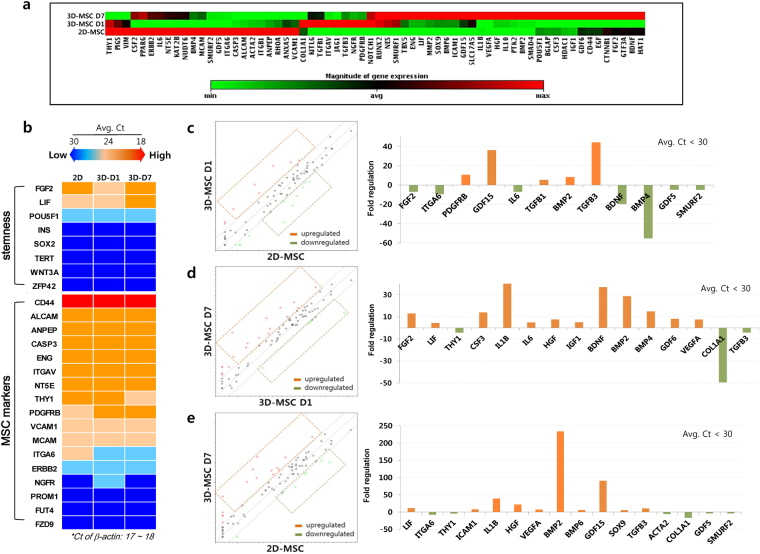
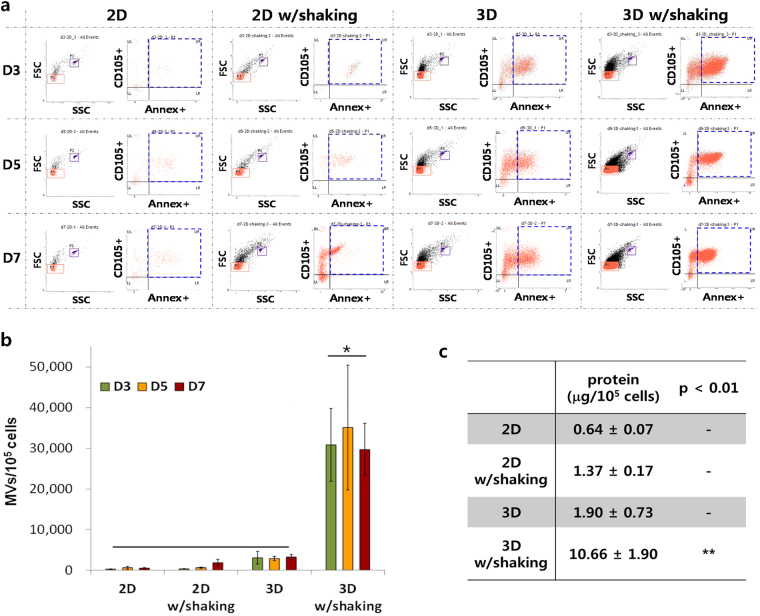
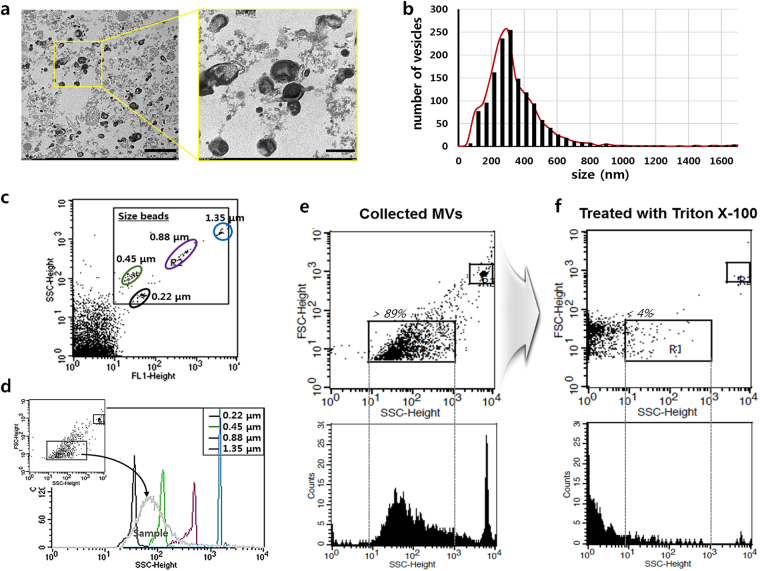
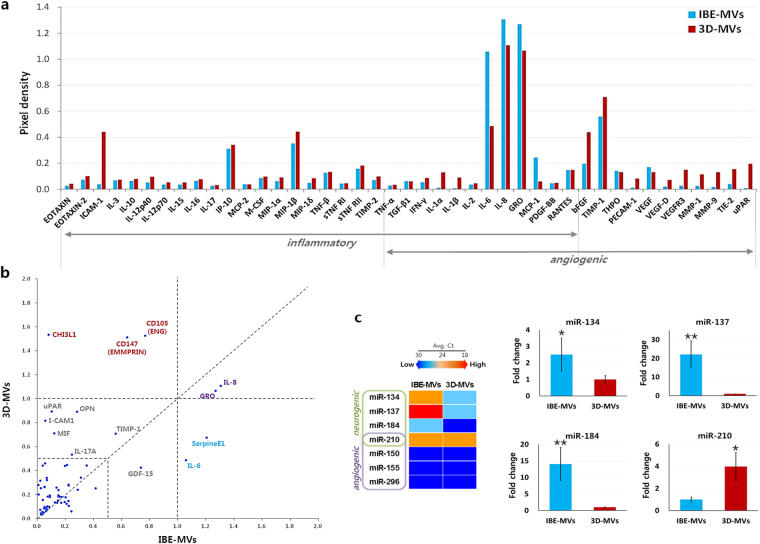
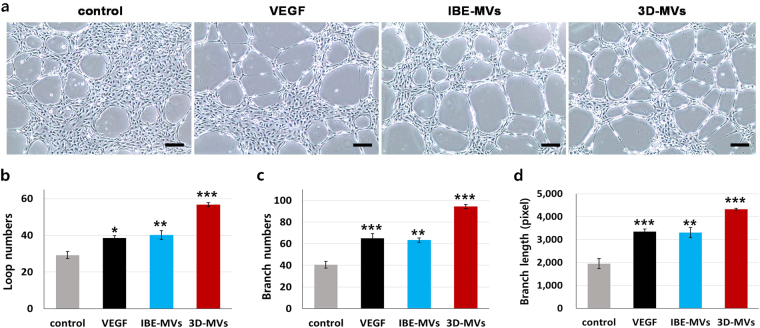
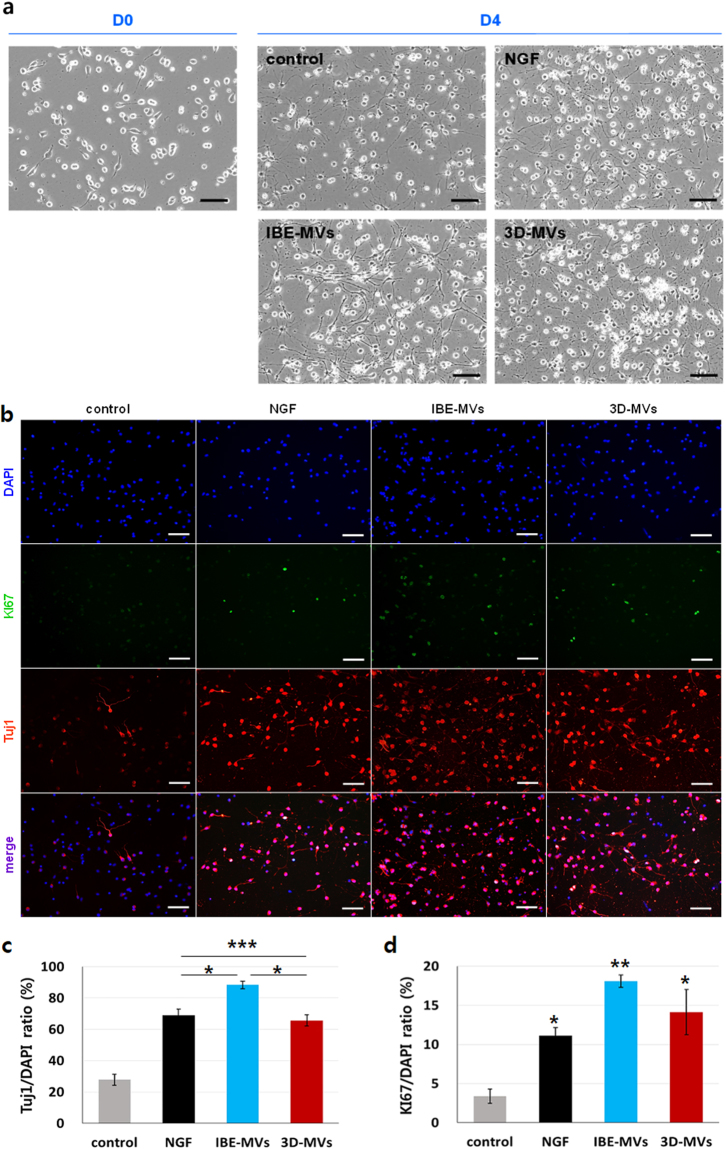
Microvesicles (MVs) released by cells are involved in a multitude of physiological events as important mediators of intercellular communication. MVs derived from mesenchymal stem cells (MSCs) contain various paracrine factors from the cells that primarily contribute to their therapeutic efficacy observed in numerous clinical trials. As nano-sized and bi-lipid layered vesicles retaining therapeutic potency equivalent to that of MSCs, MSC-derived MVs have been in focus as ideal medicinal candidates for regenerative medicine, and are preferred over MSC infusion therapy with their improved safety profiles. However, technical challenges in obtaining sufficient amounts of MVs have limited further progress in studies and clinical application. Of the multiple efforts to reinforce the therapeutic capacity of MSCs, few studies have reportedly examined the scale-up of MSC-derived MV production. In this study, we successfully amplified MV secretion from MSCs compared to the conventional culture method using a simple and efficient 3D-bioprocessing method. The MSC-derived MVs produced in our dynamic 3D-culture contained numerous therapeutic factors such as cytokines and micro-RNAs, and showed their therapeutic potency in in vitro efficacy evaluation. Our results may facilitate diverse applications of MSC-derived MVs from the bench to the bedside, which requires the large-scale production of MVs.


Conflict of interest statement

The authors declare that they have no competing interests.

Figures

Figure 1
Figure 1
Schematic summary of the study. (a) MSC-derived MVs are a promising therapeutic tool, with several advantages over current MSC-therapies and soluble biomolecular medications. (b) 3D MSC-culture can address the technical challenges facing conventional culture methods to obtain sufficient amounts of MSC-derived MVs for research and clinical use. (c) Scalable production of therapeutic MSC-derived MVs can be achieved by the simple and effectual 3D MSC-bioprocessing method presented in this study.
Figure 2
Figure 2
Large-scale formation of hMSC-spheroids with precisely controlled size and cell number. (a) Fabrication of a PEG hydrogel microwell array with inverted-pyramidal openings adjoined to cylindrical microwells. (b) Seeded hMSCs, at a density of 5 × 105 cells/array, were evenly entrapped within microwells 20 min after seeding. (c) 12 hours after cell seeding, hMSCs entrapped within microwells were well agglomerated in the shape of a spheroid with a controlled size of approximately 150 μm. The size bar indicates 200 μm. The microwell arrays were inserted in the commercial six-well plates and cultured for 7 days in a CO2 incubator under a 30-rpm orbital-shaking condition. (d) A live (green) and dead (red) assay of the 3D w/shaking group on D5 revealed that most cells in the 3D hMSC-aggregates were highly viable. The size bar indicates 400 μm. (e and f) Histological images after H&E (e) and M&T (f) staining showed that hMSC-spheroids of the 3D w/shaking group on D5 were compactly integrated with cells and secreted ECM, respectively. The size bar indicates 50 μm. (g) Cell growth kinetics was examined by a DNA quantification method. The cell numbers in the 3D w/shaking group were not increased during the culture period from the initial seeding density. Data are presented as the mean ± SEM. Differences among culture days in each group were evaluated by one-way ANOVA at a level of significance of p < 0.05 (*).
Figure 3
Figure 3
Gene expression profiles of hMSC-spheroids grown in dynamic 3D-culture. (a) A cluster gram of the PCR array displayed the expression profile of 84 key genes related to the nature of hMSCs, which relatively differed between the 2D- and 3D-MSCs. The gene expression profile of the 3D-MSCs on D1 appeared to be transitional, as they were in the process of forming 3D-spheroids during the 7-day culture period. (b) Comparison of gene expression related to stemness and MSC markers. FGF2, LIF, and POU5F1 were expressed in all groups, while FGF2 and LIF generally decreased upon formation of hMSC-spheroids and subsequently increased over culture time. A variety of hMSC marker genes was highly expressed in 3D-MSCs, showing levels and patterns comparable to those in 2D-MSCs. (ce) Gene expression representing hMSC’s attributes with average Ct values below 30 are presented by scatter plots and compared between groups. Upon formation of hMSC-spheroids (D1), GDF15 and TGFB3 were upregulated by approximately 40-fold compared to the 2D control, whereas BMP4 was downregulated by approximately 60-fold (c). As our dynamic 3D hMSC-culture progressed up to D7, IL1B, BDNF, and BMP2 were upregulated by more than 30-fold while COL1A1 was downregulated by approximately 50-fold, compared to the early stage of 3D-MSCs on D1 (d). Comparison between 3D-MSC on D7 and 2D-MSCs showed that IL1B and GDF15 were upregulated by approximately 40- and 90-fold, respectively. Particularly, BMP2 was extensively upregulated by approximately 230-fold (e).
Figure 4
Figure 4
Significantly augmented production of MVs using dynamic 3D hMSC-culture. (a) A flow cytometric analysis for phenotyping and enumerating MVs collected from the groups of 2D, 2D w/shaking, 3D, and 3D w/shaking. Particles sized below 1.0 μm (red solid squares) were estimated using standard size beads, and those double-positive for anti-CD105 (hMSC surface marker) and anti-annexin V (lipid surface marker) were counted as hMSC-derived MVs on D3, D5, and D7 (blue dotted squares). Counting beads (purple solid squares) were used to calculate the absolute counts of MVs. (b) Quantitative comparison of counted MVs normalized to the cell numbers in corresponding culture groups. The highest enrichment of hMSC-derived MVs was observed in the 3D w/shaking group, which was approximately 100-fold greater than in the 2D control which contained only a few secreted MVs. Data are presented as the mean ± SEM. Differences among groups were evaluated by one-way ANOVA at a level of significance of p < 0.05. (c) A BCA protein quantification assay with samples collected on D7 which were normalized to the cell numbers of corresponding culture groups to compare all groups with the same standard. MVs collected from the 3D w/shaking group showed a significantly higher total protein concentration. Data are presented as the mean ± SEM. Differences among groups were evaluated by one-way ANOVA at a level of significance of p < 0.01 (**).
Figure 5
Figure 5
Morphology, size, and structure characterizations of MVs produced by dynamic 3D hMSC-culture. (a) TEM images of 3D-MVs. Most collected MVs displayed vesicular structures appearing rounded and bi-lipid layered, although differing in contrast and surface pattern. The size bars indicate 2,000 nm (left) and 500 nm (right). (b) Size distribution of the collected MVs obtained by measuring the sizes of individual vesicles on multiple TEM images (approximately 1,400 vesicles from 11 images). A peak in the MV diameter range was found at approximately 250–300 nm with over 80% of the collected MVs populated between 150 and 450 nm. (c) Particle size standards for flow cytometry obtained using the Nano Fluorescent Size Standard Kit. (d) A major population of the collected MVs was superimposed on the size calibration plot mainly in the range between 220 and 450 nm. (e and f) Flow cytometry results of the collected MVs before (e) and after (f) Triton-X 100 treatment, which indicated that the collected MVs were true lipid-membranous vesicles.
Figure 6
Figure 6
Therapeutic inclusions in MVs produced using dynamic 3D hMSC-culture. (a and b) Representative cytokines contained in both IBE-MVs and 3D-MVs were analysed using several cytokine array kits. IBE-MVs contained a variety of therapeutic cytokines related to immunomodulation and angiogenesis. In general, the cytokines detected in IBE-MVs were also found in 3D-MVs, but their amounts varied to some extent (a). Some cytokine inclusions were distinctive in the two groups, such that 3D-MVs appeared to contain large amounts of ICAM-1, bFGF, CHI3L1, CD147, and CD105, whereas considerable amounts of IL-6 and SerpineE1 were found in IBE-MVs (b). (c) qPCR assays for micro-RNAs included in MVs known as key players in neurogenic and/or angiogenic molecular signalling. IBE-MVs appeared to contain significantly higher levels of micro-RNAs related to neurogenesis such as miR-134, -137, and -184 compared to 3D-MVs. On the other hand, the level of miR-210 which is related to both neurogenesis and angiogenesis was significantly higher in 3D-MVs compared to in IBE-MVs. Regardless of the variations in some major compounds between the two groups, MVs collected from our 3D hMSC-bioprocess included high levels of various therapeutic cytokines and micro-RNAs related to immunomodulation, angiogenesis, and neurogenesis. Data are presented as the mean ± SEM. Differences among groups were evaluated by student’s t-test at a level of significance of p < 0.05 (*) or p < 0.01 (**).
Figure 7
Figure 7
Angiogenic stimulation via MV supplementation. (a) The inducible capacity of MVs for vascular tube formation. 3 μg/mL of IBE-MVs and 3D-MVs were added to HUVECs plated on Matrigel, and resulting tube formation was observed along with a control (basal medium) and VEGF-treated groups by microscopy. The size bars indicate 200 μm. (b) Loop numbers (c) branch numbers and (d) branch length values of the resulting tube formations were quantitatively compared. While HUVECs treated with IBE-MVs showed similar levels to the VEGF-treated group, 3D-MVs demonstrated a greater capacity to stimulate HUVEC tube formation with higher significance than the other groups. Data are presented as the mean ± SEM. Differences among groups were evaluated by one-way ANOVA at a level of significance of p < 0.001 (***), 0.001 < p < 0.01 (**), or 0.01 < p < 0.05 (*).
Figure 8
Figure 8
Neurogenic stimulation via MV supplementation. (a) Phase contrast images of the resulting neurogenic stimulation of MVs. 3 μg/mL of IBE-MVs and 3D-MVs were added to primarily cultured NSCs. Neural differentiation on D4 was compared with that in control (basal medium) and NGF-treated groups. The size bars indicate 100 μm. (b) Fluorescent image analyses of Tuj1 expression in NSCs along with Ki67 expression that denoted proliferating cells. The size bars indicate 100 μm. (c) Stimulated neurogenic differentiation of NSCs on D4 was quantified by counting cells positive for Tuj1 and normalized to DAPI-stained cells. IBE-MVs showed the highest capacity for stimulating neurogenic differentiation. 3D-MVs also induced neurogenic differentiation at a significantly higher level than the control as comparable to the NGF-treated group. (d) Proliferating NSCs on D4 were quantified by counting cells positive for Ki67 and normalized to DAPI-stained cells. IBE-MVs generally showed the greatest proliferation capacity, while 3D-MVs and NGF-treated groups were significantly higher than the control. Data are presented as the mean ± SEM. Differences among groups were evaluated by one-way ANOVA at a level of significance of p < 0.001 (***), 0.001 < p < 0.01 (**), or 0.01 < p < 0.05 (*).

References

    1. Price MJ, et al. Intravenous mesenchymal stem cell therapy early after reperfused acute myocardial infarction improves left ventricular function and alters electrophysiologic properties. Int. J. Cardiol. 2006;111:231–239. doi: 10.1016/j.ijcard.2005.07.036. - DOI - PubMed
    1. Pak HN, et al. Mesenchymal stem cell injection induces cardiac nerve sprouting and increased tenascin expression in a Swine model of myocardial infarction. J. Cardiovasc. Electrophysiol. 2003;14:841–848. doi: 10.1046/j.1540-8167.2003.03124.x. - DOI - PubMed
    1. Chang MG, et al. Proarrhythmic potential of mesenchymal stem cell transplantation revealed in an in vitro coculture model. Circulation. 2006;113:1832–1841. doi: 10.1161/CIRCULATIONAHA.105.593038. - DOI - PubMed
    1. Furlani D, et al. Is the intravascular administration of mesenchymal stem cells safe? Mesenchymal stem cells and intravital microscopy. Microvasc. Res. 2009;77:370–376. doi: 10.1016/j.mvr.2009.02.001. - DOI - PubMed
    1. Breitbach M, et al. Potential risks of bone marrow cell transplantation into infarcted hearts. Blood. 2007;110:1362–1369. doi: 10.1182/blood-2006-12-063412. - DOI - PubMed

Publication types

MeSH terms

Substances