. 2018 Jan 19;8(1):1286.
doi: 10.1038/s41598-018-19592-8.

Prevention of Retinal Degeneration in a Rat Model of Smith-Lemli-Opitz Syndrome

Affiliations

Prevention of Retinal Degeneration in a Rat Model of Smith-Lemli-Opitz Syndrome

Steven J Fliesler et al. Sci Rep. .

Erratum in

Abstract

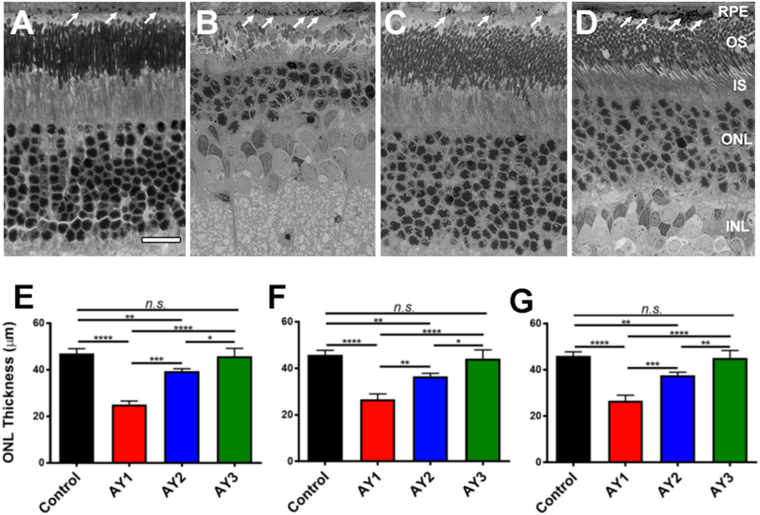
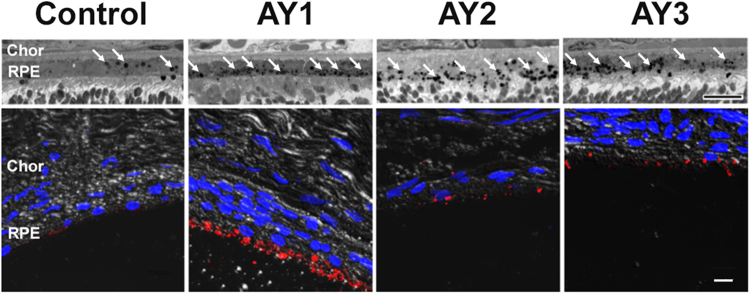
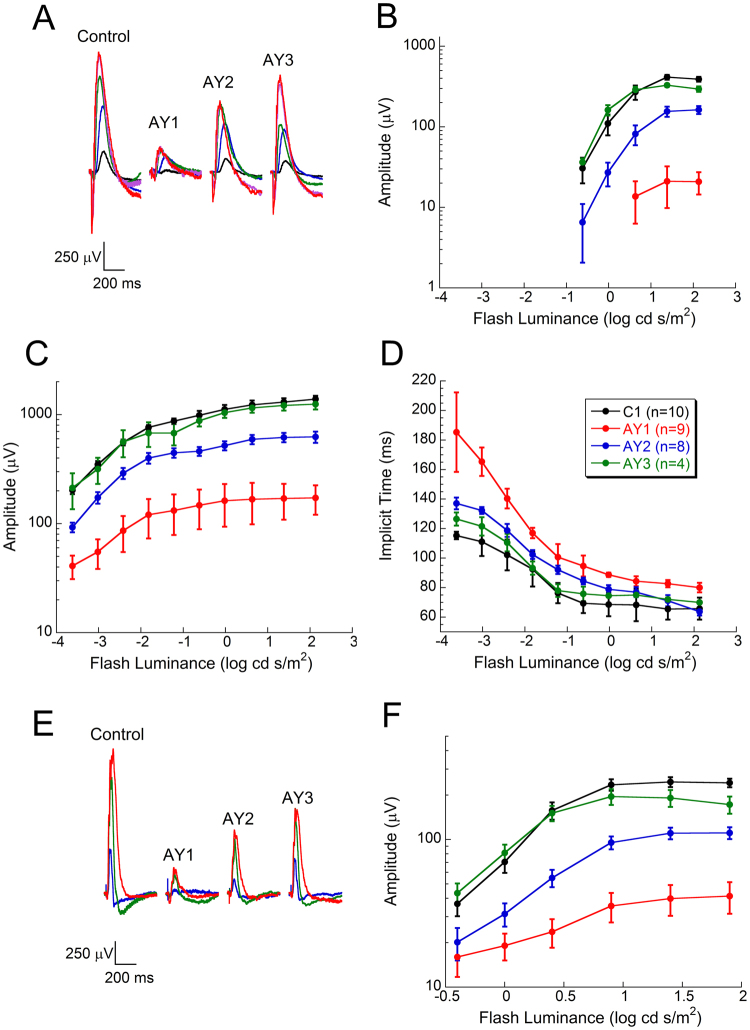
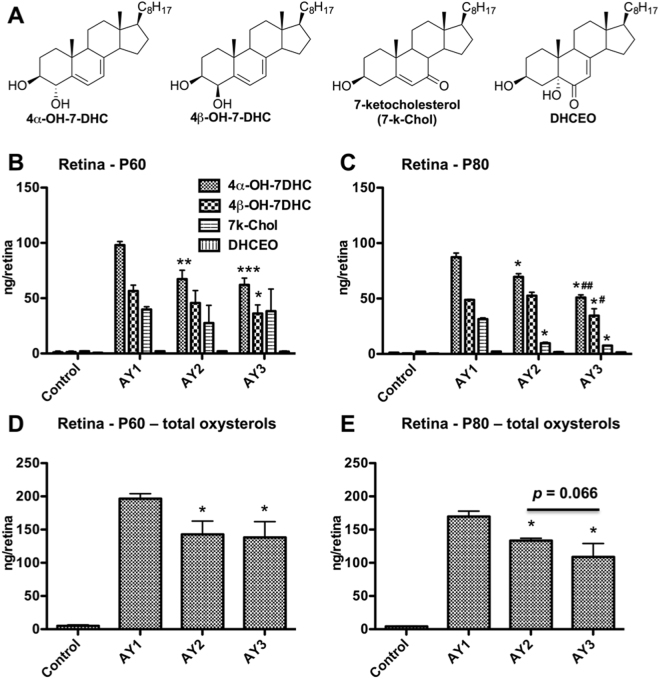
Smith-Lemli-Opitz Syndrome (SLOS) is a recessive human disease caused by defective cholesterol (CHOL) synthesis at the level of DHCR7 (7-dehydrocholesterol reductase), which normally catalyzes the conversion of 7-dehydrocholesterol (7DHC) to CHOL. Formation and abnormal accumulation of 7DHC and 7DHC-derived oxysterols occur in SLOS patients and in rats treated with the DHCR7 inhibitor AY9944. The rat SLOS model exhibits progressive and irreversible retinal dysfunction and degeneration, which is only partially ameliorated by dietary CHOL supplementation. We hypothesized that 7DHC-derived oxysterols are causally involved in this retinal degeneration, and that blocking or reducing their formation should minimize the phenotype. Here, using the SLOS rat model, we demonstrate that combined dietary supplementation with CHOL plus antioxidants (vitamins E and C, plus sodium selenite) provides better outcomes than dietary CHOL supplementation alone with regard to preservation of retinal structure and function and lowering 7DHC-derived oxysterol formation. These proof-of-principle findings provide a translational, pre-clinical framework for designing clinical trials using CHOL-antioxidant combination therapy as an improved therapeutic intervention over the current standard of care for the treatment of SLOS.


Conflict of interest statement

The authors declare that they have no competing interests.

Figures

Figure 1
Figure 1
Retinal histology (upper panels, AD) and quantitative morphometric analysis of ONL thickness (lower panels, EG) of control vs. AY9944-treated rats on various diets. Light microscopy images (resin embedment, Toluidine blue stain; 40X objective) at age PN 80 days, under the following conditions: (A) Untreated rat fed a standard rodent diet (C1 group; black); (B) AY9944-treated rat fed a CHOL-free rodent diet (AY1 group; red); (C) AY9944-treated rat fed high-CHOL diet (AY2 group; blue); and (D) AY9944-treated rat fed high-CHOL diet supplemented with antioxidants (AY3 group; green). Presumed phagosomes in RPE are denoted by white arrows. Abbreviations: RPE, retinal pigment epithelium; OS, outer segment layer; IS, inner segment layer; ONL, outer nuclear layer; INL, inner nuclear layer. Scale bar (panel A, for all panels), 20 μm. ONL thickness measurements from (E) superior hemisphere, (F) inferior hemisphere, and (G) combined mean values (both hemispheres, ±S.E.M.; n = 3–4 biological replicates, n = 10 technical replicates, each condition), along the vertical meridian. Statistical significance (one-way ANOVA): *p < 0.05, **p < 0.01, ***p < 0.005, ****p < 0.001; n.s., not significant.
Figure 2
Figure 2
Persistence of phagosomes in RPE of AY9944-treated rats. Upper panels: Higher-magnification light microscopy images of RPE (resin embedment; 100X oil objective and 3X digital zoom) at PN 80 days, under same dietary conditions as in Fig. 1. White arrows denote presumed phagosomes in RPE. Lower panels: Correlative immunohistochemistry (paraffin embedment; confocal fluorescence microscopy), using anti-opsin (1D4 epitope) and fluor-conjugated secondary IgG (red) to label phagocytized photoreceptor outer segment tips in RPE. DAPI counterstain (blue). Note the relative paucity of 1D4-positive material in the control RPE, compared to the marked amount of such material in the RPE in AY9944-treated rats. Scale bars, 10 μm. Abbreviations: Chor, choroid; RPE, retinal pigment epithelium.
Figure 3
Figure 3
Electroretinographic analysis of control vs. AY9944-treated rats as a function of diet. (A) Representative dark-adapted ERG waveforms from a member of each experimental group. Flash strength is color-coded: (black: −3.6 log cd s/m2; blue: −2.4 log cd s/m2; green: −1.2 log cd s/m2; red: 0.0 log cd s/m2; red: 1.4 log cd s/m2). Summary plots are shown for (B) the amplitude of the ERG a-wave and (C) b-wave, and (D) the implicit time of the ERG b-wave. (E) Representative light-adapted cone ERG waveforms from a member of each experimental group. Flash strength is color-coded: (blue: 0.0 log cd s/m2; green: 0.9 log cd s/m2; red: 1.9 log cd s/m2). (F) Summary plots for the amplitude of the cone ERG. Data points are mean ± S.E.M. values, for n biological replicates, obtained from rats at age PN 80–82 days at time of ERG measurements: C1 group, n = 10; AY1 group, n = 9; AY2 group, n = 8; AY3 group, n = 4 (see inset, panel D, for color key). Note the overlap in data points for ERG responses from C1 and AY3 group animals. [See Results for presentation of statistical analysis of data].
Figure 4
Figure 4
Quantification of selected 7DHC-derived oxysterols in neural retina as a function of dietary regimen and postnatal (PN) age. Oxysterols were quantified by UHPLC-MS/MS as described in Methods; values given in ng/retina. (A) Oxysterol structures (see inset, panel B, for key): 4α-hydroxy-cholesta-5,7-dien-3β-ol (4α-OH-7DHC), 4β-hydroxy-cholesta-5,7-dien-3β-ol (4β-OH-7DHC), 7-ketocholesterol (7k-Chol), and 3β,5α-dihydroxycholest-7-en-6-one (DHCEO). Individual oxysterol levels at (B) PN 60 days and (C) PN 80 days. Total oxysterol levels at (D) PN 60 days and (E) PN 80 days. For PN 60 days rats, N = 4 for each group. For PN 80 days rats, Control group, N = 4; AY1 group, N = 2; AY2 group, N = 3; AY3 group, N = 3. Significance levels (Student’s t-test): *p < 0.05; **p < 0.005, and ***p < 0.001 for comparison of AY1 vs. AY2 and AY3 values; #p < 0.05 and ##p < 0.005 for comparison of AY2 vs. AY3 values.

References

    1. Kelley RI, Hennekam RC. The Smith-Lemli-Opitz syndrome. J Med Genet. 2000;37:321–335. doi: 10.1136/jmg.37.5.321. - DOI - PMC - PubMed
    1. Nowaczyk MJ, Irons MB. Smith-Lemli-Opitz syndrome: phenotype, natural history, and epidemiology. Am J Med Genet C Semin Med Genet. 2012;160C:250–262. doi: 10.1002/ajmg.c.31343. - DOI - PubMed
    1. Correa-Cerro LS, Porter FD. 3beta-hydroxysterol Delta7-reductase and the Smith-Lemli-Opitz syndrome. Mol Genet Metab. 2005;84:112–126. doi: 10.1016/j.ymgme.2004.09.017. - DOI - PubMed
    1. Waterham HR, Hennekam RC. Mutational spectrum of Smith-Lemli-Opitz syndrome. Am J Med Genet C Semin Med Genet. 2012;160C:263–284. doi: 10.1002/ajmg.c.31346. - DOI - PubMed
    1. Tint GS, et al. Defective cholesterol biosynthesis associated with the Smith-Lemli-Opitz syndrome. N Engl J Med. 1994;330:107–113. doi: 10.1056/NEJM199401133300205. - DOI - PubMed

Publication types

MeSH terms