. 2018 Jan 19;9(1):301.
doi: 10.1038/s41467-017-02745-0.

PTRE-seq reveals mechanism and interactions of RNA binding proteins and miRNAs

Affiliations

PTRE-seq reveals mechanism and interactions of RNA binding proteins and miRNAs

Kyle A Cottrell et al. Nat Commun. .

Abstract

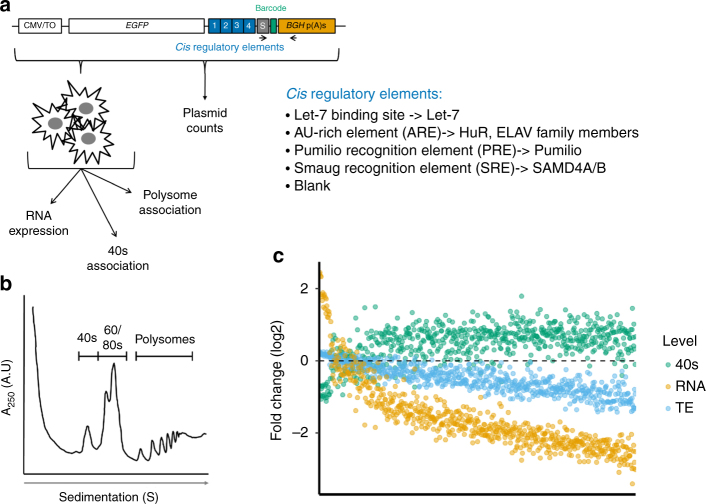
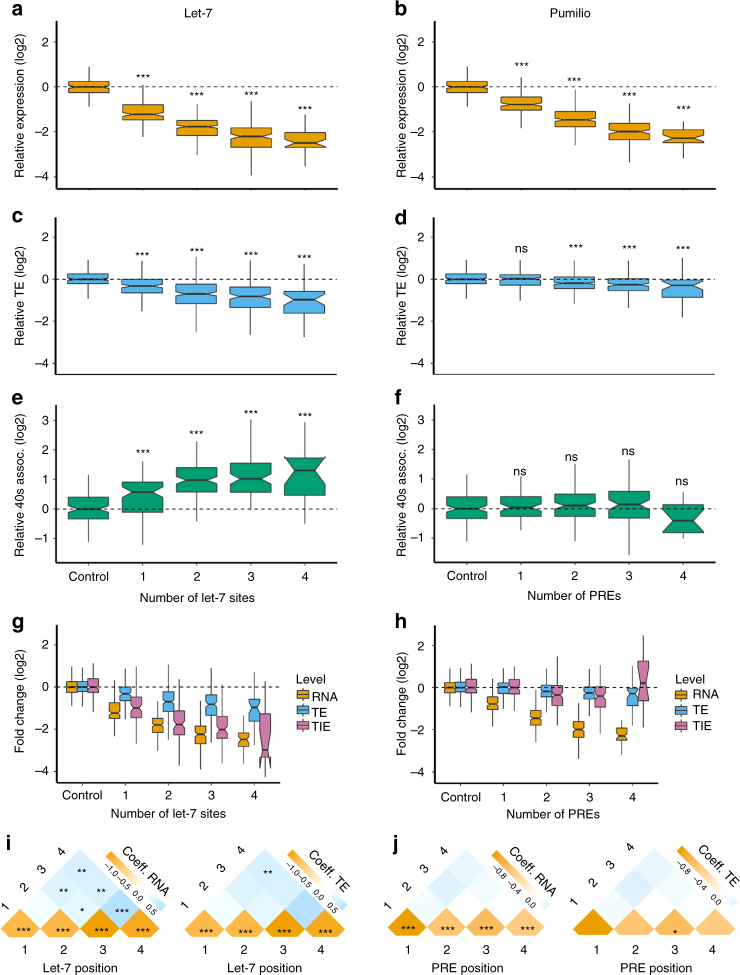
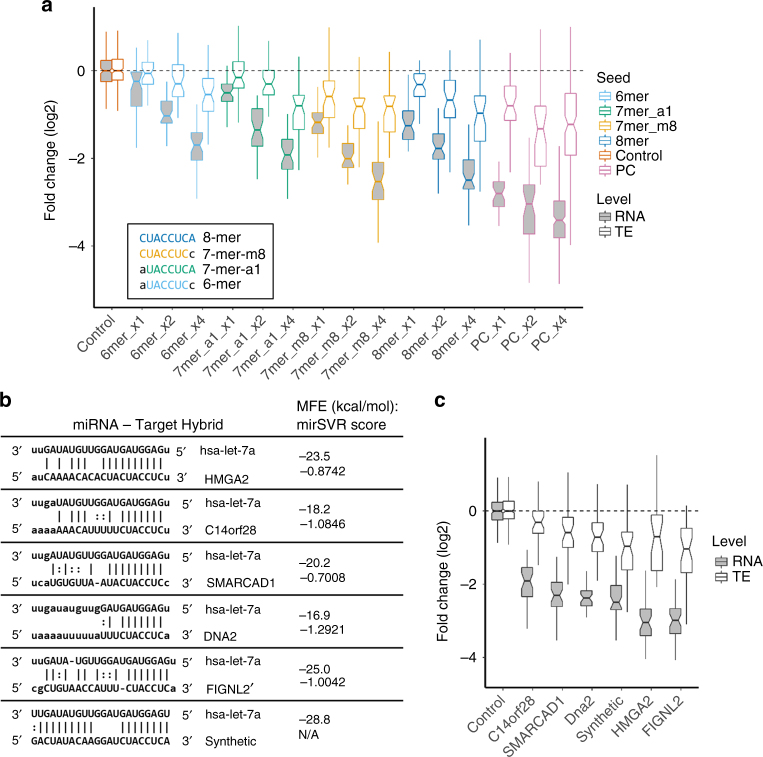
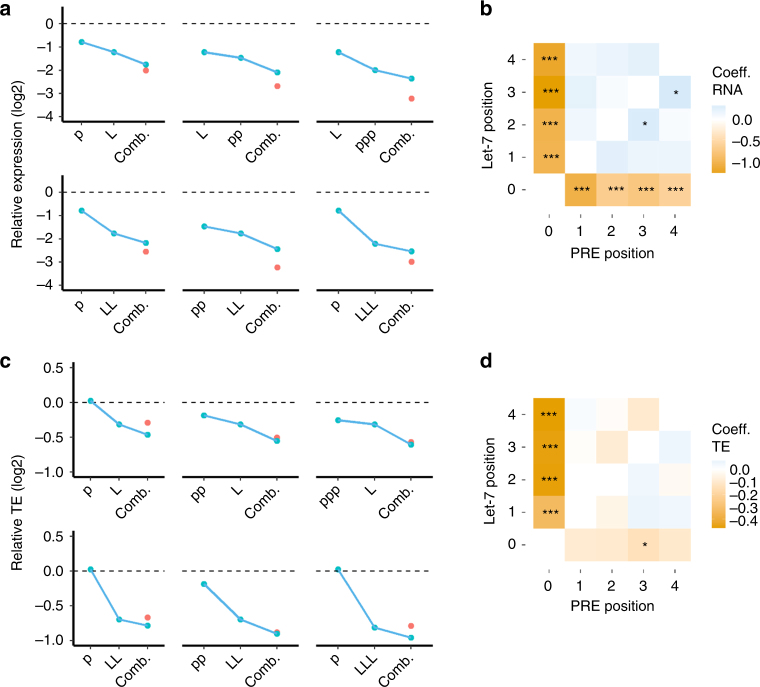
RNA binding proteins (RBP) and microRNAs (miRNAs) often bind sequences in 3' untranslated regions (UTRs) of mRNAs, and regulate stability and translation efficiency. With the identification of numerous RBPs and miRNAs, there is an urgent need for new technologies to dissect the function of the cis-acting elements of RBPs and miRNAs. We describe post-transcriptional regulatory element sequencing (PTRE-seq), a massively parallel method for assaying the target sequences of miRNAs and RBPs. We use PTRE-seq to dissect sequence preferences and interactions between miRNAs and RBPs. The binding sites for these effector molecules influenced different aspects of the RNA lifecycle: RNA stability, translation efficiency, and translation initiation. In some cases, post-transcriptional control is modular, with different factors acting independently of each other, while in other cases factors show specific epistatic interactions. The throughput, flexibility, and reproducibility of PTRE-seq make it a valuable tool to study post-transcriptional regulation by 3'UTR elements.


Conflict of interest statement

The authors declare no competing financial interests.

Figures

Fig. 1
Fig. 1
Design and application of PTRE-seq. a Schematic of the PTRE-seq library. Each cis-regulatory element (RE) within the library is inserted into an episomal reporter as shown. CMV/TO, cytomegalovirus promoter with the 5′UTR from the vector pCDNA5/FRT/TO. EGFP, enhanced green fluorescent protein. S, spacer sequence. BGH p(A)s, 3′UTR and polyadenylation signal from bovine growth hormone gene. Each unique synthetic 3′UTR, made up of binding sites for the REs shown, is represented by 10 barcodes. b Representative polysome profiling trace. mRNA was isolated from 40S, and polysome fractions. c Fold change of mRNA levels, translation efficiency, and 40S association for all reporters within the library. The reporters are arranged along the x-axis in decreasing order based on fold change
Fig. 2
Fig. 2
PTRE-seq reveals differences in the mechanism of repression by miRNAs and Pumilio Fold change of RNA (a) TE (c), and 40S association (e) of let-7 binding site containing reporters within the PTRE-seq library. Fold change of RNA (b) TE (d), and 40S association (f), of PRE containing reporters within the PTRE-seq library. For ad *P < 0.05, **P < 0.01, ***P < 0.001, t-test with Bonferroni correction. For panels af the results for all constructs containing one, two, three, or four sites is shown. The data for each site in positions one-four are shown in Supplementary Fig. 9. Panels g and h show composite boxplots with fold change of RNA, TE, and translation initiation efficiency (TIE) for let-7 and PRE respectively. TIE was calculated by normalizing polysome associated RNA/40S associated RNA. i The regression coefficients for linear models with parameters corresponding to let-7 alone or in combination with other let-7 sites at positions 1–4, or j, PREs alone or in combination with PREs at positions 1–4. In i and j, the left panels show the coefficients for RNA while the right panels show the coefficients for TE. *P < 0.05, **P < 0.01, ***P < 0.001, t-test. Boxplot whiskers indicate the furthest datum that is 1.5*Q1 (upper) or 1.5*Q3 (lower). For clarity, outliers have been removed from boxplots but were used for statistical analysis
Fig. 3
Fig. 3
PTRE-seq reveals the effect of the let-7 binding site on repression. a Comparison of the fold change of reporters containing synthetic let-7 binding sites with altered seed binding. Also shown are reporters containing let-7 binding sites that have perfect complement (PC) binding to let-7. Each seed binding variant is present in either one, two or four copies. The inset describes the seed binding region of each seed-binding variant site. b Table describing the natural and synthetic let-7 binding sites used in this study. MFE, minimal free energy. mirSVR, mirSVR score. c Fold change of RNA and TE for reporters containing four copies each of natural or synthetic let-7 binding sites. Boxplot whiskers indicate the furthest datum that is 1.5*Q1 (upper) or 1.5*Q3 (lower). For clarity, outliers have been removed from boxplots but were used for statistical analysis
Fig. 4
Fig. 4
Pumilio and miRNAs function independently. a The effect of a let-7, PRE or a combination of the two elements on relative expression, and c relative TE. The median relative expression or TE is plotted across all barcodes and replicates. Red dot, the product of each individual effect, the expected result assuming independence. The regression coefficients from the linear regression model for RNA expression (b), and TE (d), for the parameters corresponding to let-7 or PREs alone or interactions between positions containing let-7 or PREs. For a and c L = let-7 binding site, p = PRE, *P < 0.05, **P < 0.01, ***P < 0.001, t-test
Fig. 5
Fig. 5
AU-rich elements modulate repression by Pumilio and miRNAs. a The position of an ARE within the synthetic 3′UTR determines the relative TE or RNA expression. b The relative 40s association of ARE containing reporters. c Heatmap of the regression coefficients for the parameters corresponding to AREs alone. Left panel shows coefficients for RNA expression and the right panel shows coefficients for TE. d AREs modulate repression by miRNAs in a position-dependent manner. The green box highlights an example of stimulation of miRNA-mediated RNA destabilization by an ARE. e The regression coefficients for the parameters corresponding to let-7 or AREs alone or interactions between positions containing let-7 or ARE. f AREs modulate repression by PREs in a position dependent manner. g The regression coefficients for the parameters corresponding to PREs or AREs alone or interactions between positions containing PRE or ARE. For a, b, d and f, * = Blank, A = ARE, L = let-7 and p = PRE. For c, e and g, *P < 0.05, **P < 0.01, ***P < 0.001, t-test. Boxplot whiskers indicate the furthest datum that is 1.5*Q1 (upper) or 1.5*Q3 (lower). For clarity, outliers have been removed from boxplots but were used for statistical analysis
Fig. 6
Fig. 6
The regulatory capacity of miRNAs and AU-rich elements vary across cell types The relative expression of reporters containing let-7 binding sites (a), PREs (b), SREs (c), natural binding sites for let-7 (d), or AREs (e). In panel c HeLa-mCh-Smg refers to HeLa cells that were cotransfected with the PTRE-seq library and a plasmid for expression of mCherry-Smaug. HDF, neonatal human dermal fibroblasts. HEK, human embryonic kidney. N2A, mouse neuro2A. For e *=Blank and A=ARE. Boxplot whiskers indicate the furthest datum that is 1.5*Q1 (upper) or 1.5*Q3 (lower). For clarity, outliers have been removed from boxplots but were used for statistical analysis

Similar articles

Cited by

References

    1. Halbeisen RE, Galgano A, Scherrer T, Gerber AP. Post-transcriptional gene regulation: from genome-wide studies to principles. Cell Mol. Life. Sci. 2008;65:798–813. doi: 10.1007/s00018-007-7447-6. - DOI - PMC - PubMed
    1. Fabian MR, Sonenberg N. The mechanics of miRNA-mediated gene silencing: a look under the hood of miRISC. Nat. Struct. Mol. Biol. 2012;19:586–593. doi: 10.1038/nsmb.2296. - DOI - PubMed
    1. Fukaya T, Iwakawa HO, Tomari Y. MicroRNAs block assembly of eIF4F translation initiation complex in Drosophila. Mol. Cell. 2014;56:67–78. doi: 10.1016/j.molcel.2014.09.004. - DOI - PubMed
    1. Meijer HA, et al. Translational repression and eIF4A2 activity are critical for microRNA-mediated gene regulation. Science. 2013;340:82–85. doi: 10.1126/science.1231197. - DOI - PubMed
    1. Mathonnet G, et al. MicroRNA inhibition of translation initiation in vitro by targeting the cap-binding complex eIF4F. Science. 2007;317:1764–1767. doi: 10.1126/science.1146067. - DOI - PubMed

Publication types

MeSH terms