. 2018 Jan 19;8(1):1207.
doi: 10.1038/s41598-017-18079-2.

Microbial regulation of the L cell transcriptome

Affiliations

Microbial regulation of the L cell transcriptome

Tulika Arora et al. Sci Rep. .

Abstract

L cells are an important class of enteroendocrine cells secreting hormones such as glucagon like peptide-1 and peptide YY that have several metabolic and physiological effects. The gut is home to trillions of bacteria affecting host physiology, but there has been limited understanding about how the microbiota affects gene expression in L cells. Thus, we rederived the reporter mouse strain, GLU-Venus expressing yellow fluorescent protein under the control of the proglucagon gene, as germ-free (GF). Lpos cells from ileum and colon of GF and conventionally raised (CONV-R) GLU-Venus mice were isolated and subjected to transcriptomic profiling. We observed that the microbiota exerted major effects on ileal L cells. Gene Ontology enrichment analysis revealed that microbiota suppressed biological processes related to vesicle localization and synaptic vesicle cycling in Lpos cells from ileum. This finding was corroborated by electron microscopy of Lpos cells showing reduced numbers of vesicles as well as by demonstrating decreased intracellular GLP-1 content in primary cultures from ileum of CONV-R compared with GF GLU-Venus mice. By analysing Lpos cells following colonization of GF mice we observed that the greatest transcriptional regulation was evident within 1 day of colonization. Thus, the microbiota has a rapid and pronounced effect on the L cell transcriptome, predominantly in the ileum.


Conflict of interest statement

The authors declare that they have no competing interests.

Figures
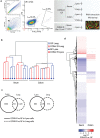
Figure 1
Figure 1
Microbiota-responsive genes in Lpos cells from ileum and colon. (a) Representative flow cytometry plot showing gate settings; R1 and R2 gates were first applied to exclude doublets and dead cells, respectively. The YFP-positive L cell (Lpos) and YFP-negative heterogeneous populations (Lneg) were then sorted from the ileum and colon of transgenic GLU-Venus mice under conventionally raised (CONV-R) and germ-free (GF) conditions. Lpos cells were also obtained from mice conventionalized for 1, 3 and 7 days (CONV-D). Sorted cell populations from all groups were subjected to RNA extraction and microarray analysis. (b) Hierarchical clustering dendrogram of whole-transcriptome expression profiles obtained using DNA microarrays. (c) Venn diagram showing the number of microbiota-dependent genes (padj < 0.05 for CONV-R vs GF) in Lneg (dotted black), Lpos populations (solid black) in ileum (left) and colon (right) of GLU-Venus mice. (d) Heat map showing log fold change in expression of significantly altered genes in CONV-R versus GF comparison in colonic and ileal Lpos cells.
Figure 2
Figure 2
Microbiota-responsive gene functions in ileal Lpos cells. Gene ontology (GO) enrichment analysis of microbiota-regulated genes in CONV-R versus GF comparison in Lpos population from ileum. The outer circle shows scatterplot for log fold change of the assigned up- (red) or downregulated (blue) genes within each GO category. The bars in inner circle indicate gradient of z-scores (calculated by the number of upregulated genes minus the number of downregulated genes divided by the square root of the count). The length of each bar indicates the extent of significance (adjusted p-value) of the downregulated GO category.
Figure 3
Figure 3
The gut microbiota regulates intracellular vesicles and GLP-1 content in ileal Lpos cells. (a) Electron microscope images of ileal Lpos cells from GF and CONV-R GLU-Venus mice (n = 2–3). Red arrows indicate the densely packed vesicles and open arrows indicate the open (empty) type vesicles, scale 2 μm. (b) Intracellular GLP-1 content (normalized to total protein) in the lysate from primary crypt cultures of ileum of GF and CONV-R GLU-Venus mice (n = 3–4). Data are mean ± SEM. ***p < 0.001 indicates significance in CONV-R versus GF comparison.
Figure 4
Figure 4
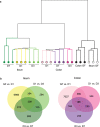
Ileal and colonic L cells respond fast to colonization by unfractionated microbiota. (a) Hierarchical clustering dendrogram of whole-transcriptome expression profiles obtained using DNA microarrays. (b) Venn diagram showing the number of significantly altered genes in D1 versus GF, D3 versus D1 and D7 versus D3 comparisons in Lpos populations from ileum and colon.

References

    1. Tremaroli V, Backhed F. Functional interactions between the gut microbiota and host metabolism. Nature. 2012;489:242–249. doi: 10.1038/nature11552. - DOI - PubMed
    1. Schroeder BO, Backhed F. Signals from the gut microbiota to distant organs in physiology and disease. Nat Med. 2016;22:1079–1089. doi: 10.1038/nm.4185. - DOI - PubMed
    1. Sommer F, Backhed F. The gut microbiota–masters of host development and physiology. Nat Rev Microbiol. 2013;11:227–238. doi: 10.1038/nrmicro2974. - DOI - PubMed
    1. Sommer F, Backhed F. Know your neighbor: Microbiota and host epithelial cells interact locally to control intestinal function and physiology. Bioessays. 2016;38:455–464. doi: 10.1002/bies.201500151. - DOI - PubMed
    1. Sternini C, Anselmi L, Rozengurt E. Enteroendocrine cells: a site of ‘taste’ in gastrointestinal chemosensing. Curr Opin Endocrinol Diabetes Obes. 2008;15:73–78. doi: 10.1097/MED.0b013e3282f43a73. - DOI - PMC - PubMed

Publication types

Substances

LinkOut - more resources