Review
. 2018 Apr;27(4):814-824.
doi: 10.1002/pro.3376. Epub 2018 Feb 10.

Determination of protein oligomeric structure from small-angle X-ray scattering

Affiliations
Review

Determination of protein oligomeric structure from small-angle X-ray scattering

David A Korasick et al. Protein Sci. 2018 Apr.

Abstract

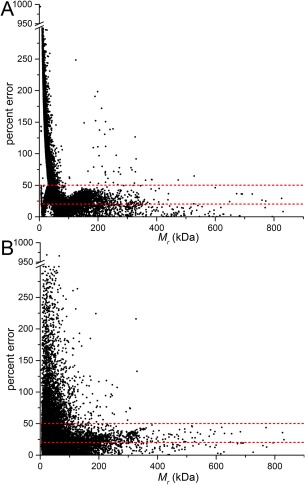
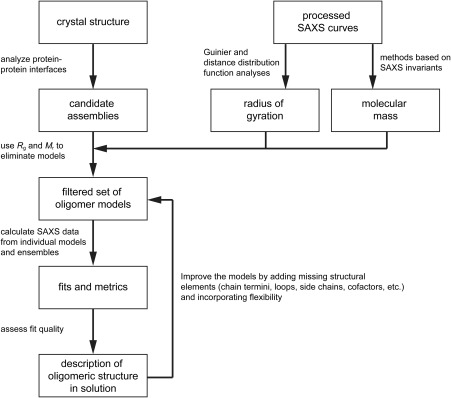
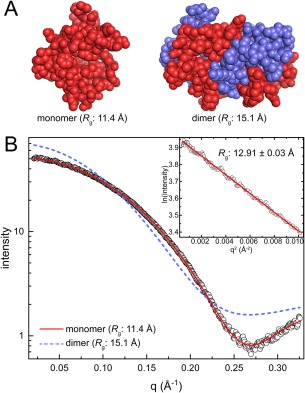
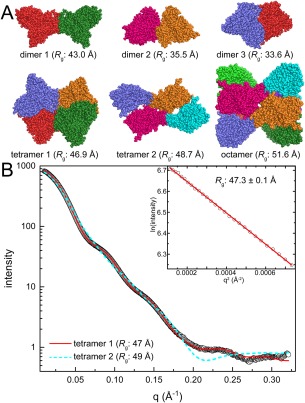
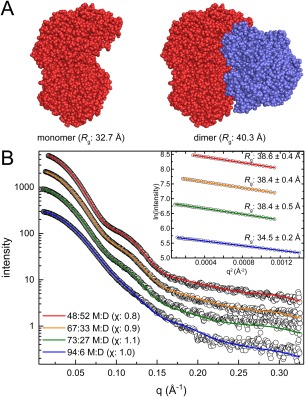
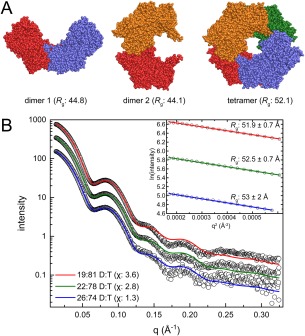
Small-angle X-ray scattering (SAXS) is useful for determining the oligomeric states and quaternary structures of proteins in solution. The average molecular mass in solution can be calculated directly from a single SAXS curve collected on an arbitrary scale from a sample of unknown protein concentration without the need for beamline calibration or protein standards. The quaternary structure in solution can be deduced by comparing the experimental SAXS curve to theoretical curves calculated from proposed models of the oligomer. This approach is especially robust when the crystal structure of the target protein is known, and the candidate oligomer models are derived from the crystal lattice. When SAXS data are obtained at multiple protein concentrations, this analysis can provide insight into dynamic self-association equilibria. Herein, we summarize the computational methods that are used to determine protein molecular mass and quaternary structure from SAXS data. These methods are organized into a workflow and demonstrated with four case studies using experimental SAXS data from the published literature.

Keywords: molecular mass; oligomerization; protein structure; quaternary structure; small-angle X-ray scattering.


Figures

Figure 1
Figure 1
Analysis of the uncertainty in the molecular mass from empirical methods. (A) A scatterplot showing the percent error between total M r of the biological assembly and the M r calculated using the Vp/1.6 rule [Eq. (1)]. (B) A scatterplot of percent error between total M r of the biological assembly and the M r calculated using the power law rule [Eq. (4)]. The dashed lines are drawn at 20 and 50% error.
Figure 2
Figure 2
A workflow for determining protein oligomeric structure from SAXS and X‐ray crystallography.
Figure 3
Figure 3
Case 1: distinguishing between a monomer and a dimer. (A) Models of the polcalcin phl p7 monomer from NMR (PDB ID 2LVK) and the crystallographic dimer (PDB ID 1K9U). Protomers in the dimer model are colored differently for clarity. (B) Experimental SAXS data (open circles) collected at a single concentration of polcalcin phl p7. The inset shows the Guinier plot. Theoretical curves calculated from the polcalcin NMR monomer (red solid line; FoXS χ: 1.5) or dimer (slate dashed line; FoXS χ: 24) are shown.
Figure 4
Figure 4
Case 2: Identifying the correct oligomer from several models. (A) Assembles of the UDP‐galactopyranose mutase from Aspergillus fumigatus derived from PDBePISA analysis of crystal packing (PDB ID 3UTE). Protomers are colored differently for clarity. (B) Experimental SAXS data (open circles) collected at a single protein concentration. The inset shows the Guinier plot. Theoretical curves calculated from tetramer 1 (red solid line; FoXS χ: 3.5) or tetramer 2 (cyan dashed line; FoXS χ: 21) are shown.
Figure 5
Figure 5
Case 3: An obvious monomer–dimer equilibrium. (A) Monomer and dimer models of proline utilization A from Sinorhizobium meliloti (PDB ID 5KF6). Protomers in the dimer model are colored differently for clarity. (B) Experimental SAXS data (open circles) collected at four increasing protein concentrations. The inset shows the Guinier plots for each concentration. MultiFoXS fits using a monomer‐dimer ensemble model are shown for each concentration. The optimal monomer:dimer (M:D) ratios determined by MultiFoXS are indicated in the legend, with the χ value for the each fit in parentheses.
Figure 6
Figure 6
Case 4: A subtle dimer–tetramer equilibrium. (A) Models of proline utilization A from Bradyrhizobium japonicum derived from the crystal lattice (PDB ID 3HAZ). Protomers are colored differently for clarity. (B) Experimental SAXS data (open circles) collected at three increasing protein concentrations. The inset shows the Guinier plots for each concentration. MultiFoXS fits using an ensemble model of dimer 1 and the tetramer are shown for each concentration. The dimer 1:tetramer (D:T) ratios determined by MultiFoXS are indicated in the legend with the χ value for the each fit in parentheses.

References

    1. Dafforn TR (2007) So how do you know you have a macromolecular complex? Acta Crystallogr 63:17–25. - PMC - PubMed
    1. Krissinel E, Henrick K, Detection of protein assemblies in crystals. Computational Life Sciences: First International Symposium. In: Berthold MR, Glen R, Diederichs K, Kohlbacher O, Fischer I, Eds. (2005) Konstanz, Germany: Springer, pp 163–174.
    1. Krissinel E, Henrick K (2007) Inference of macromolecular assemblies from crystalline state. J Mol Biol 372:774–797. - PubMed
    1. Scharer MA, Grutter MG, Capitani G (2010) CRK: an evolutionary approach for distinguishing biologically relevant interfaces from crystal contacts. Proteins 78:2707–2713. - PubMed
    1. Duarte JM, Srebniak A, Scharer MA, Capitani G (2012) Protein interface classification by evolutionary analysis. BMC Bioinform 13:334. - PMC - PubMed

Publication types

LinkOut - more resources