. 2018 Jan 20;18(1):18.
doi: 10.1186/s12870-018-1232-6.

Ectopic expression of the apple nucleus-encoded thylakoid protein MdY3IP1 triggers early-flowering and enhanced salt-tolerance in Arabidopsis thaliana

Affiliations

Ectopic expression of the apple nucleus-encoded thylakoid protein MdY3IP1 triggers early-flowering and enhanced salt-tolerance in Arabidopsis thaliana

Jian-Qiang Yu et al. BMC Plant Biol. .

Abstract

Background: The roles in photosystem I (PSI) assembly of the nucleus-encoded thylakoid protein Y3IP1 who interacts with the plastid-encoded Ycf3 protein that has been well-characterized in plants. However, its function and potential mechanisms in other aspects remain poorly understood.

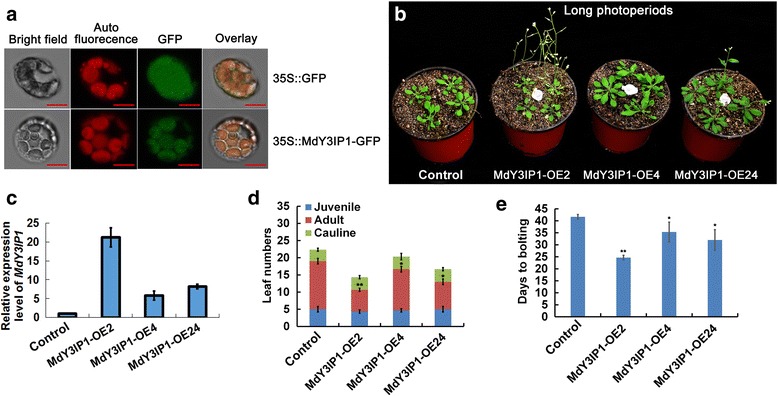
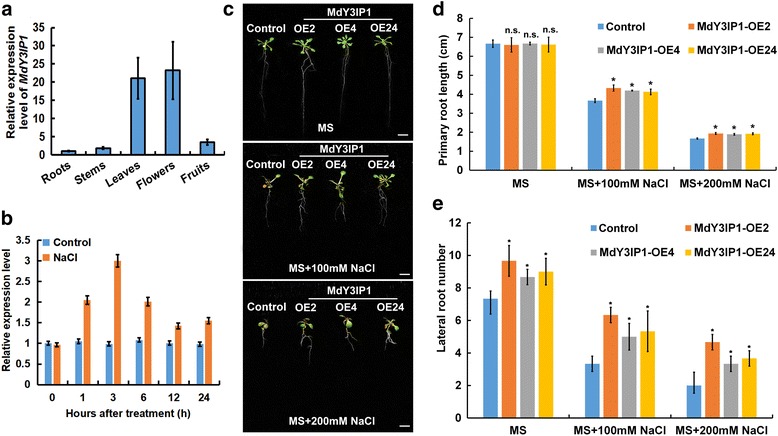
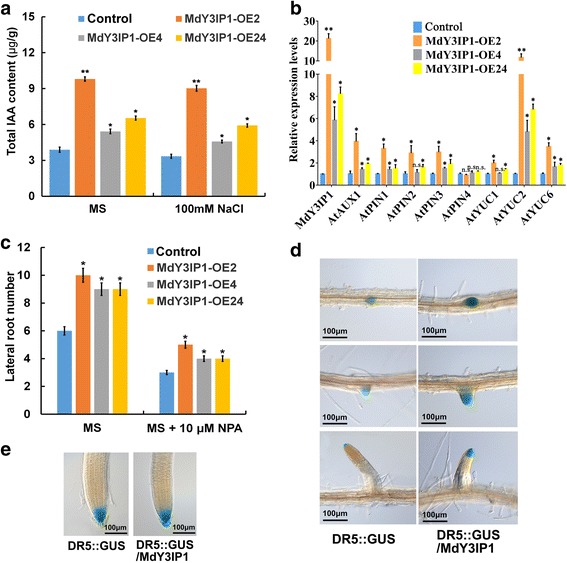
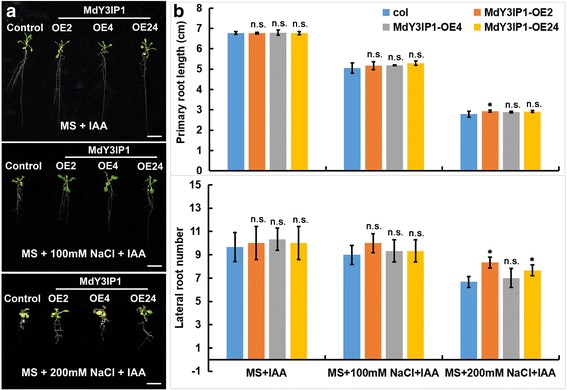
Results: We identified the apple MdY3IP1 gene, which encodes a protein highly homologous to the Arabidopsis Y3IP1 (AtY3IP1). Ectopic expression of MdY3IP1 triggered early-flowering and enhanced salt tolerance in Arabidopsis plants. MdY3IP1 controlled floral transition by accelerating sugar metabolism process in plant cells, thereby influencing the expression of flowering-associated genes. The increase in salt stress tolerance in MdY3IP1-expressing plants correlated with reduced reactive oxygen species (ROS) accumulation, and an increase in lateral root development by regulating both auxin biosynthesis and transport, as followed by enhancement of salt tolerance in Arabidopsis. Overall, these findings provide new evidences for additional functions of Y3IP1-like proteins and their underlying mechanisms of which Y3IP1 confers early-flowering and salt tolerance phenotypes in plants.

Conclusions: These observations suggest that plant growth and stress resistance can be affected by the regulation of the MdY3IP1 gene. Further molecular and genetic approaches will accelerate our knowledge of MdY3IP1 functions in PSI complex formation and plants stress resistance, and inform strategies for creating transgenic crop varieties with early maturity and high-resistant to adverse environmental conditions.

Keywords: Floral transition; MdY3IP1; PSI complex; ROS; Salt tolerance; Sugar metabolism.


Conflict of interest statement

Ethics approval and consent to participate

Not applicable

Consent for publication

Not applicable

Competing interests

The authors declare that they have no competing interests.

Publisher’s Note

Springer Nature remains neutral with regard to jurisdictional claims in published maps and institutional affiliations.

Figures

Fig. 1
Fig. 1
Early flowering phenotype in the MdY3IP1-expressing transgenic Arabidopsis plants. a Subcellular localization of MdY3IP1. pCaMV35S::MdY3IP1-GFP was transiently expressed in protoplasts of apple leaves. pCaMV35S::GFP was used as a negative control. Bars = 100 μm. b Flowering phenotype of the MdY3IP1 transgenic Arabidopsis. 4-week-old plants grown in soil under long days (LDs) were photographed. Note: Arabidopsis plants transformed with an empty vector serve as the control. c Expression of MdY3IP1 in the control and MdY3IP1 transgenic plants by qPCR assay. Note: Arabidopsis plants transformed with an empty vector serve as the control. d, e Determination of leaf number (d) and of days to bolting (e). Approximate 20 plants grown under LDs were counted and averaged in each assay. Note: In d, e, data are shown as the mean ± SE, based on more than nine replicates. Statistical significance was determined using Student’s t test. *P < 0.01; **P < 0.001
Fig. 2
Fig. 2
Photosynthetic sugar metabolism process is accelerated in MdY3IP1 transgenic Arabidopsis. a qPCR analysis of AtSOC1, AtFT and AtFLC transcript levels in the control and MdY3IP1 transgenic plants. The samplings were occurred around noon during the day time. b Starch staining of the control and MdY3IP1 transgenic Arabidopsis plants. c Determination of soluble sugars in the control and MdY3IP1 transgenic Arabidopsis plants. d Chlorophyll content in the leaves of control and MdY3IP1 transgenic Arabidopsis plants. e Maximum quantum yield of PSII (Fv/fm) in the leaves of control and MdY3IP1 transgenic Arabidopsis plants. f Induction and relaxation of NPQ monitored during dark-to-light transition (120 μmol photons m− 2 s− 1). Curves represents an average of six independent measurement. g Immunoblots of PSI core protein subunits including PsaA, PsaD, and PsaF, as well as PSII reaction center protein D1 in the control and MdY3IP1 transgenic Arabidopsis plants. An anti-myc antibody was used to detected protein abundance of MdY3IP1-myc transgenic Arabidopsis. Anti-ACTIN antibody was used as a negative control. Note: In a, c, d, e, data are shown as the mean ± SE, based on more than nine replicates. Statistical significance was determined using Student’s t test. *P < 0.01; **P < 0.001
Fig. 3
Fig. 3
Ectopic expression of MdY3IP1 enhances Arabidopsis tolerance to salt stress. a Expression of MdY3IP1 in various apple tissues. Transcription levels are expressed relative to the level of transcripts in apple roots, which are arbitrarily set at 1. The data are represented by the mean value ± SD for triplicate values. b Expression level of MdY3IP1 under 100 mM NaCl. ‘Gala’ cultivar plantlets were treated with 100 mM NaCl, and samples were collected at 0, 1, 3, 6, 9, 12, and 24 h after treatment for the expression analysis. c Phenotype of the control and MdY3IP1 transgenic Arabidopsis under salt stress. Arabidopsis seeds were separately sowed to the MS medium. Subsequently, 5-day-old seedlings were transferred to new MS medium supplemented with 0, 100 and 200 mM NaCl, respectively. The photographs were taken at 20 days after transferring. Bars = 1 cm. d, e Primary root length (d) and lateral root numbers (e) of the control and MdY3IP1 transgenic Arabidopsis plants as indicated in (c). Note: In d, e, data are shown as the mean ± SE, based on more than nine replicates. Statistical significance was determined using Student’s t test. n.s., P > 0.01; *P < 0.01
Fig. 4
Fig. 4
MdY3IP1 accumulates less ROS than the control in Arabidopsis leaves. a DAB staining for H2O2 in the leaves of the control and MdY3IP1 transgenic Arabidopsis grown with or without a 200 mM NaCl. b DAB staining intensity as determined with imageJ software. c NBT staining for superoxide in the leaves of the control and MdY3IP1 transgenic Arabidopsis grown with or without a 200 mM NaCl. d NBT staining intensity as determined with imageJ software. e DCFH-DA staining for H2O2 in the leaf protoplasts of the control and MdY3IP1 transgenic Arabidopsis treated with or without 200 mM NaCl. Bars = 100 mm. f DCFH-DA staining intensity as determined with imageJ software. Three independent experiments were done with similar results, each with three replicates, and each replicate with 20 to 30 protoplasts. Note: In b, d f, data are shown as the mean ± SE, based on more than nine replicates. Statistical significance was determined using Student’s t test. *P < 0.01; **P < 0.001
Fig. 5
Fig. 5
MdY3IP1 promotes auxin accumulation in lateral roots and lateral root primordia of transgenic Arabidopsis plants. a Total IAA content in the roots of 2-week-old control and MdY3IP1 transgenic Arabidopsis plants. b Transcripts levels of auxin influx carriers (AtAUX1), efflux carriers (AtPIN1, AtPIN2, and AtPIN3), and biosynthetic YUCCA genes (AtYUC1, AtYUC2 and AtYUC6), in control and MdY3IP1 transgenic Arabidopsis by qPCR assay. c Effect of the auxin transport inhibitor NPA on LR initiation in control and MdY3IP1 transgenic Arabidopsis plants. 5-day-old seedlings were transferred to MS medium supplemented with NPA (10 μM). After 10-days growth, the emerged LRs of 10 to 13 seedlings were counted. d Histochemical staining of GUS activity in LR primordia (top and middle panel) and LR (bottom panel) at three different stages. 10-day-old Arabidopsis plants expressing DR5:GUS in control (left) or MdY3IP1 transgenic plants (right) were used for GUS staining for 8 h. Bars = 100 μm. e Histochemical staining of GUS activity in primary roots. 10-day-old Arabidopsis plants expressing DR5:GUS in control (left) or MdY3IP1 transgenic plants (right) were used for GUS staining for 8 h. Bars = 100 μm. Note: In a, b, c, data are shown as the mean ± SE, based on more than nine replicates. Statistical significance was determined using Student’s t test. n.s., P > 0.01; *P < 0.01; **P < 0.001
Fig. 6
Fig. 6
IAA application mimics the effect of MdY3IP1-expression in Arabidopsis roots. a Root architecture of control and MdY3IP1 transgenic Arabidopsis plants grown on MS medium supplemented with 0, 100 and 200 mM NaCl, respectively. Bars = 1 cm. b primary root length and LR numbers of control and MdY3IP1 transgenic Arabidopsis plants as indicated in (a). Note: In b, data are shown as the mean ± SE, based on more than nine replicates. Statistical significance was determined using Student’s t test. n.s., P > 0.01; *P < 0.01
Fig. 7
Fig. 7
Working model for MdY3IP1 function in the regulation of photoperiodic flowering and salt tolerance. In the current working model, MdY3IP1 controls floral transition by altering the levels of sugar metabolism, and thereby influencing the expression of flowering-associated genes. MdY3IP1-expression reduces ROS production in plant cells, and promotes LR development by regulating auxin biosynthesis and transport. Additionally, it increases the expression of genes in the SOS pathway, and elevates the levels of sugar metabolism, leading to an increase in tolerance to salt stress in plants

Similar articles

Cited by

References

    1. Peltier JB, Cai Y, Sun Q, Zabrouskov V, Giacomelli L, Rudella A, Ytterberg AJ, Rutschow H, van Wijk KJ. The oligomeric stromal proteome of Arabidopsis thaliana chloroplasts. Mol Cell Proteomics. 2006;5:114–133. doi: 10.1074/mcp.M500180-MCP200. - DOI - PubMed
    1. Biswal B, Krupinska K, Biswal UC. Plastid development in leaves during growth and senescence. 2013.
    1. Buchanan BB, Gruissem W, Jones RL. Biochemistry and molecular biology of plants. New York: Wiley; 2015. p. 1367.
    1. Jordan P, Fromme P, Witt HT, Klukas O, Saenger W, Krauß N. Three-dimensional structure of cyanobacterial photosystem I at 2.5 Å resolution. Nature. 2001;411:909–917. doi: 10.1038/35082000. - DOI - PubMed
    1. Nelson N, Ben-Shem A. The complex architecture of oxygenic photosynthesis. Nat Rev Mol Cell Biol. 2004;5:1–12. doi: 10.1038/nrm1525. - DOI - PubMed

MeSH terms

LinkOut - more resources