. 2018 Mar 15;435(2):122-129.
doi: 10.1016/j.ydbio.2017.12.022. Epub 2018 Jan 17.

Three-dimensional visualization of extracellular matrix networks during murine development

Affiliations

Three-dimensional visualization of extracellular matrix networks during murine development

Andrea Acuna et al. Dev Biol. .

Abstract

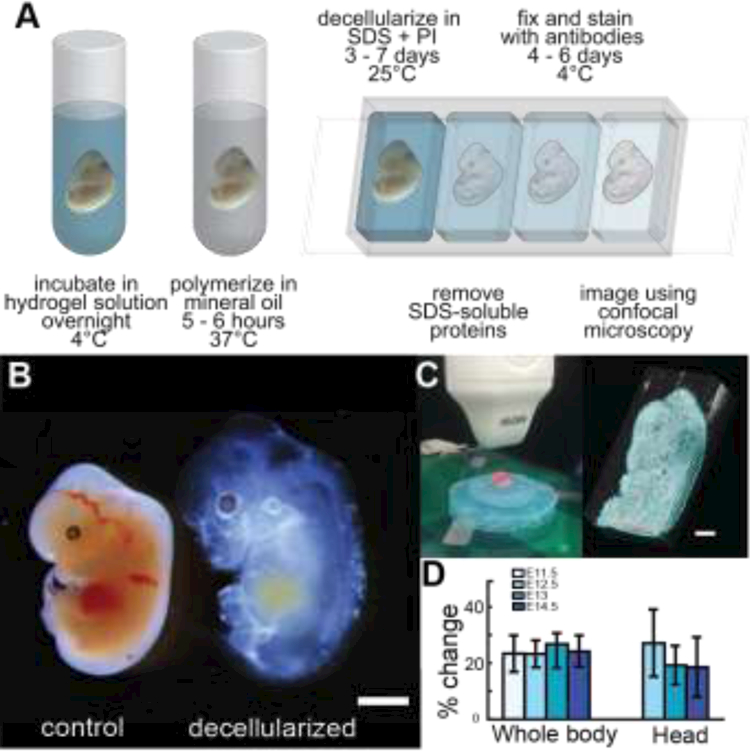
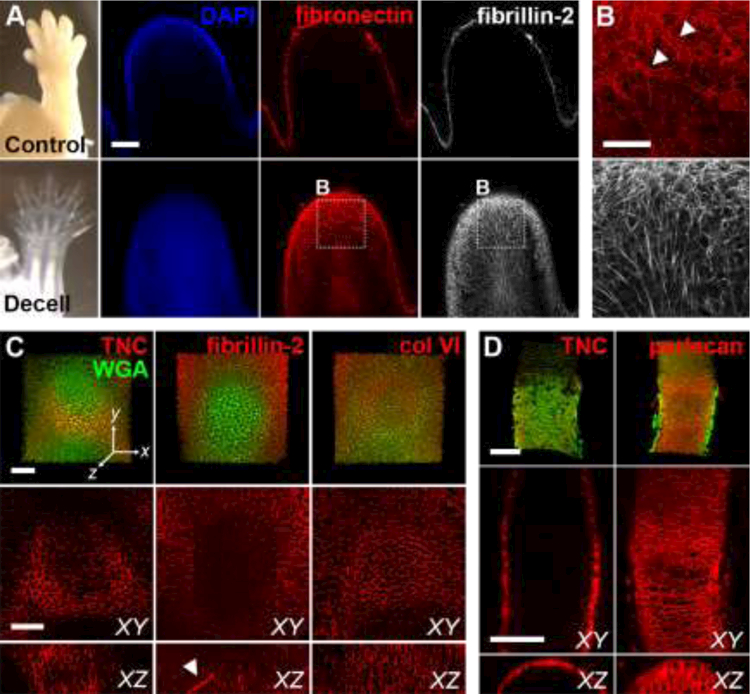
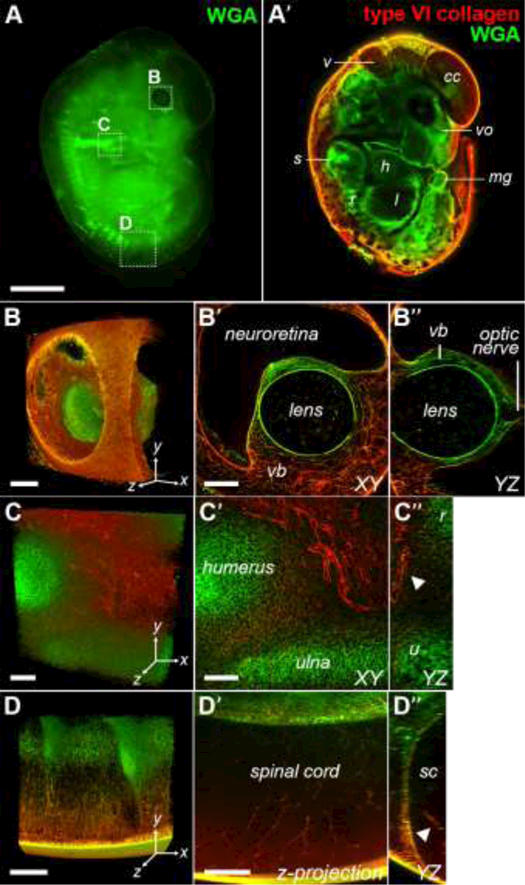
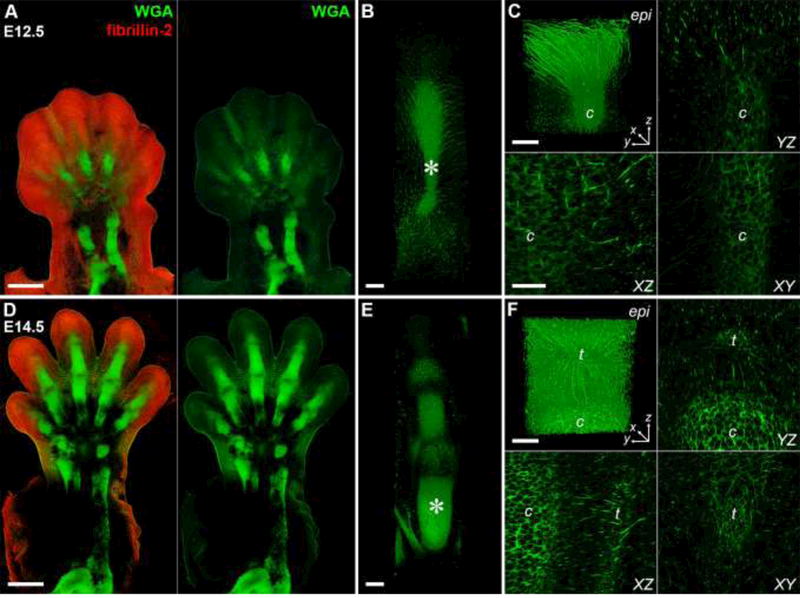
The extracellular matrix (ECM) plays a crucial role in embryogenesis, serving both as a substrate to which cells attach and as an active regulator of cell behavior. However, little is known about the spatiotemporal expression patterns and 3D structure of ECM proteins during embryonic development. The lack of suitable methods to visualize the embryonic ECM is largely responsible for this gap, posing a major technical challenge for biologists and tissue engineers. Here, we describe a method of viewing the 3D organization of the ECM using a polyacrylamide-based hydrogel to provide a 3D framework within developing murine embryos. After removal of soluble proteins using sodium dodecyl sulfate, confocal microscopy was used to visualize the 3D distribution of independent ECM networks in multiple developing tissues, including the forelimb, eye, and spinal cord. Comparative analysis of E12.5 and E14.5 autopods revealed proteoglycan-rich fibrils maintain connections between the epidermis and the underlying tendon and cartilage, indicating a role for the ECM during musculoskeletal assembly and demonstrating that our method can be a powerful tool for defining the spatiotemporal distribution of the ECM during embryogenesis.

Keywords: Decellularization; Extracellular matrix; Morphogenesis; Mouse embryo.


Conflict of interest statement

Competing interests

The authors declare no competing interests.

Figures

Fig. 1.
Fig. 1.. Decellularization increases transparency of murine embryos.
(A) Isolated murine embryos were incubated in hydrogel solution (Table S1) and gently rocked at 4°C overnight. Excess hydrogel was removed, and embryos were submerged in mineral oil at 37°C to induce polymerization. Embryos were decellularized in sodium dodecyl sulfate (SDS) with protease inhibitor (PI) then processed for immunohistochemistry. (B) Comparison of control and decellularized E12.5 embryos from the same litter showed swelling occurred after cell removal; however, overall morphology was retained. Bar = 2 mm. (C) Ultrasound setup used to quantify changes in embryonic volume and segmentations (blue) of a E14.5 embryo before decellularization for whole body 3D rendering. Bar = 2 mm. (D) Volume changes remained consistent over the time periods investigated (n=4; bars=SD) and were largely isotropic (see Fig. S2).
Fig. 2.
Fig. 2.. Decellularization increases matrix visibility and retains independent networks.
(A) E14.5 control and decellularized forelimbs were stained for fibronectin (FN; red) and fibrillin-2 (FBN2; white) and digit tips were imaged using confocal microscopy (blue = DAPI). Bar = 100µm. (B) Higher magnification view of A reveals FN and FBN2 maintain independent, interpenetrating networks after removal of cells with SDS. Arrowheads show FN+ blood vessels. Bar = 50µm. (C, D) The native distribution of different ECM was maintained in developing cartilage and bone in decellularized E14.5 forelimbs. Tenascin-C (TNC, red) expression was restricted to the periphery of the developing cartilage (left). FBN2 (red) was localized to fibrils within the cartilage (middle). YZ section shows extended FBN2-expressing microfibril (arrowhead). Type VI collagen (col VI, red) was found throughout the developing cartilage (right). Green = WGA. Bars = 50 μm. Dimensions of stacks in C: 237 × 237 × 78 μm (x × y × z). (D) TNC (red, left) was restricted to the perichondrium/periosteum in the developing long bone, whereas perlecan (red, right) was found throughout the tissue. Green = WGA. Bars = 100 μm, axes oriented as in C. Dimensions of stacks in D: 242 × 338 × 69 μm.
Fig. 3.
Fig. 3.. 3D visualization of ECM in E12.5 embryo.
(A) Widefield view of WGA-stained E12.5 decellularized embryo. (A’) Virtual confocal section of E12.5 embryo stained with WGA (green) and type VI collagen (red). Various structures can be identified including the including the 4th ventricle of the brain (v), future cerebral cortex (cc), vomeronasal organ (vo), scapula (s), midgut (m), liver (l), heart (h) and ribs (r). 10×, bar = 2 mm. (B-B”): 3D rendering of the eye at 25× (567 × 567 × 395 μm; x × y × z). The vascularization of the vitreous body (vb) can be visualized (B’) and the lens and optic nerve can be clearly resolved in a YZ projection of the image stack. Bars = 100 μm. (C-C”) 3D rendering reveals dense vascular network around the elbow (567 × 567 × 186 μm). Comparison of XY (C’) and YZ planes (C’) revealed that blood vessels remained patent. 25×, bars = 100 μm. (D-D”) 3D rendering of developing spinal cord at 10× (850 × 850 × 251 μm). Z-projection of 12 slices (70 μm) shows maintenance of spinal cord vascularization (D’) and intact blood vessel in the YZ projection (arrowhead; D”). Bars = 200 μm.
Fig. 4.
Fig. 4.. Multiscale imaging of the musculoskeletal system in the developing forelimb.
E12.5 (A – C) and E14.5 (D – F) forelimbs were decellularized and stained with WGA (green) and an antibody against fibrillin-2 (FBN2, red). Dorsal view. (A, D) Cartilage elements of the autopod and zeugopod were easily resolved with WGA. FBN2 became more restricted with time. 10×, bar = 500 μm. (A: 2471 × 3599 × 600 μm; D: 2799 × 4733 × 450 μm; x × y × z) (B, E) 3D rendering of digits showed a network of WGA+ fibrils radiating from the cartilage as well as staining of joint tissues and the extensor tendons. 25×, bar = 100 μm. (381 × 1364 × 289 μm). (C, F) Higher magnification of digits in B, E (*) revealed WGA+ fibrils extended from dorsal epidermis (epi) to cartilage (c) at E12.5 and at E14.5 fibrils appeared to connect the extensor tendons (t) to the epidermis and cartilage. 40×, bars = 50 μm, (213 × 213 × 227 μm). See Movies 1 – 4.

References

    1. Arikawa-Hirasawa E, Watanabe H, Takami H, Hassell JR, Yamada Y, 1999. Perlecan is essential for cartilage and cephalic development. Nat Genet 23, 354–358. - PubMed
    1. Arteaga-Solis E, Gayraud B, Lee SY, Shum L, Sakai L, Ramirez F, 2001. Regulation of limb patterning by extracellular microfibrils. J Cell Biol 154, 275–281. - PMC - PubMed
    1. Bonnans C, Chou J, Werb Z, 2014. Remodelling the extracellular matrix in development and disease. Nat Rev Mol Cell Biol 15, 786–801. - PMC - PubMed
    1. Calve S, Odelberg SJ, Simon HG, 2010. A transitional extracellular matrix instructs cell behavior during muscle regeneration. Dev Biol 344, 259–271. - PMC - PubMed
    1. Calve S, Ready A, Huppenbauer C, Main R, Neu CP, 2015. Optical clearing in dense connective tissues to visualize cellular connectivity in situ. PLoS One 10, e0116662. - PMC - PubMed

Publication types

MeSH terms

LinkOut - more resources