

Comparing the portion size effect in women with and without extended training in portion control: A follow-up to the Portion-Control Strategies Trial
- PMID: 29353006
- PMCID: PMC5817023
- DOI: 10.1016/j.appet.2018.01.012
Comparing the portion size effect in women with and without extended training in portion control: A follow-up to the Portion-Control Strategies Trial
Abstract
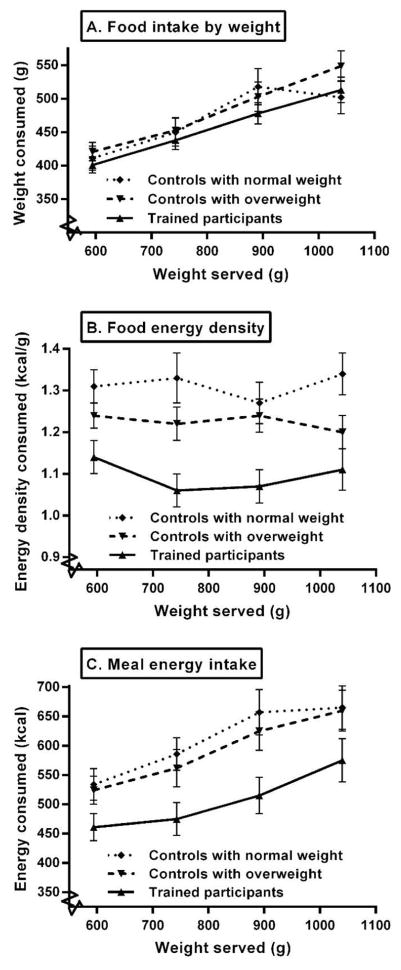
Following a 1-year randomized controlled trial that tested how weight loss was influenced by different targeted strategies for managing food portions, we evaluated whether the effect of portion size on intake in a controlled setting was attenuated in trained participants compared to untrained controls. Subjects were 3 groups of women: 39 participants with overweight and obesity from the Portion-Control Strategies Trial, 34 controls with overweight and obesity, and 29 controls with normal weight. In a crossover design, on 4 different occasions subjects were served a meal consisting of 7 foods that differed in energy density (ED). Across the meals, all foods were varied in portion size (100%, 125%, 150%, or 175% of baseline). The results showed that serving larger portions increased the weight and energy of food consumed at the meal (P < .0001), and this effect did not differ across groups. Increasing portions by 75% increased food intake by a mean (±SEM) of 111 ± 10 g (27%) and increased energy intake by 126 ± 14 kcal (25%). Across all meals, however, trained participants had lower energy intake (506 ± 15 vs. 601 ± 12 kcal, P = .006) and lower meal ED (1.09 ± 0.02 vs. 1.27 ± 0.02 kcal/g; P = .003) than controls, whose intake did not differ by weight status. The lower energy intake of trained participants was attributable to consuming meals with a greater proportion of lower-ED foods than controls. These results further demonstrate the robust nature of the portion size effect and reinforce that reducing meal ED is an effective way to moderate energy intake in the presence of large portions.
Keywords: Adults; Energy density; Energy intake; Food intake; Portion control; Portion size.
Copyright © 2018 Elsevier Ltd. All rights reserved.
Figures
References
-
- Steenhuis IHM, Vermeer WM. Portion size: a review and framework for interventions. Int J Behav Nutr Phys Act. 2009;6:58. Internet: https://ijbnpa.biomedcentral.com/articles/10.1186/1479-5868-6-58. - DOI - PMC - PubMed
-
- Hollands GJ, Shemilt I, Marteau M, Jebb SA, Lewis HB, Wei Y, Higgins JP, Oglivie D. Portion, package or tableware size for changing selection and consumption of food, alcohol and tobacco. [Date accessed 05 June 2017];Cochrane Database Syst Rev. 2015 9:CD011045. Internet: https://www.ncbi.nlm.nih.gov/pmc/articles/PMC4579823/pdf/CD011045-0001.pdf. - PMC - PubMed
-
- Zlatevska N, Dubelaar C, Holden SS. Sizing up the effect of portion size on consumption: a meta-analytic review. J Mark. 2014;78:140–154.
-
- Young LR, Nestle M. Reducing portion sizes to prevent obesity: a call to action. Am J Prev Med. 2012;43(5):565–568. - PubMed
Publication types
MeSH terms
Grants and funding
LinkOut - more resources
Full Text Sources
Other Literature Sources
Medical
