. 2018 Jan 22;8(1):26.
doi: 10.1038/s41398-017-0083-5.

Shifting priorities: highly conserved behavioral and brain network adaptations to chronic stress across species

Affiliations

Shifting priorities: highly conserved behavioral and brain network adaptations to chronic stress across species

Yuliya S Nikolova et al. Transl Psychiatry. .

Abstract

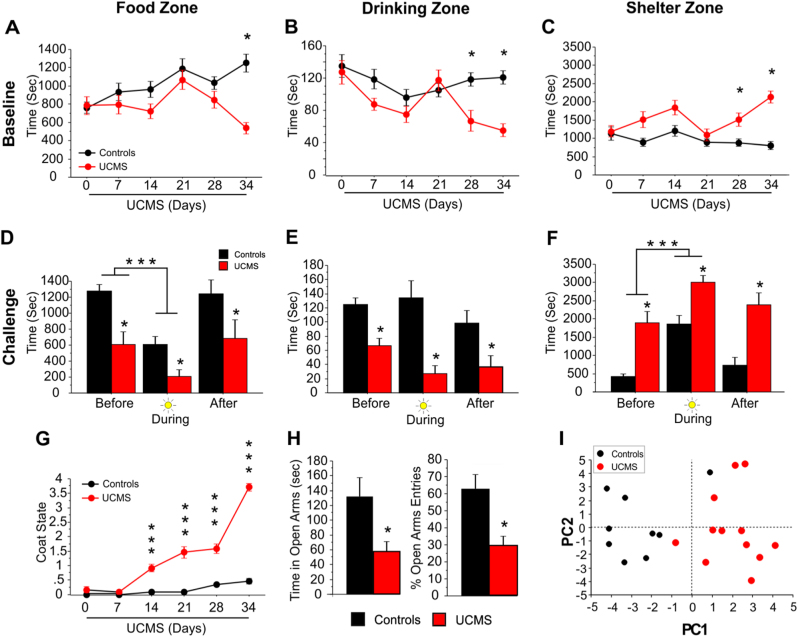
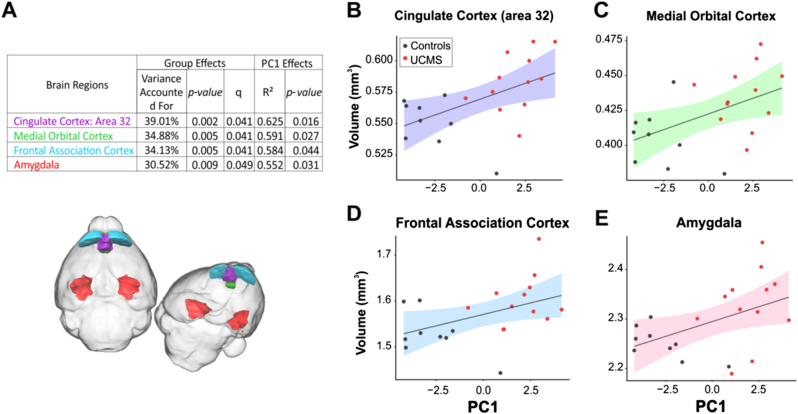
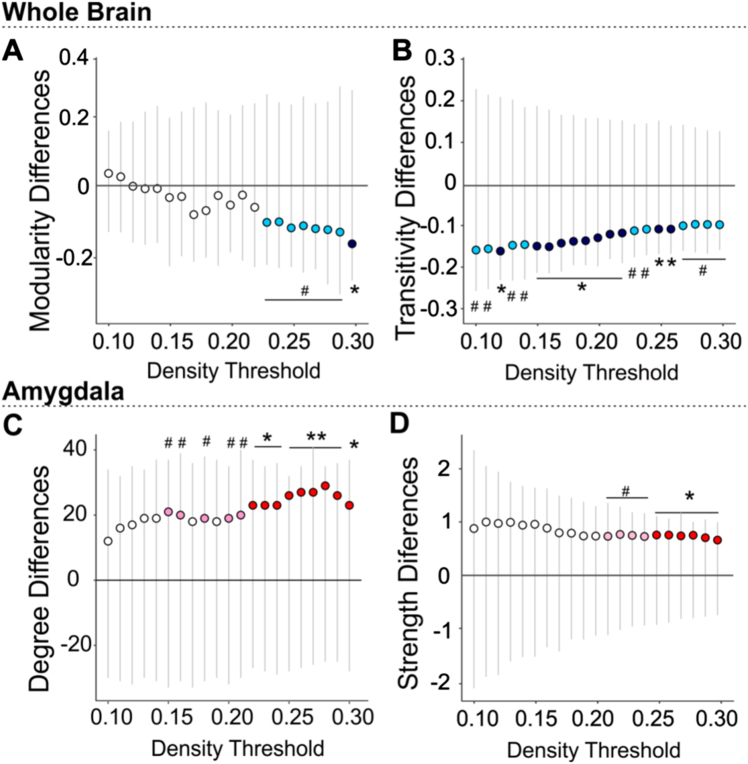
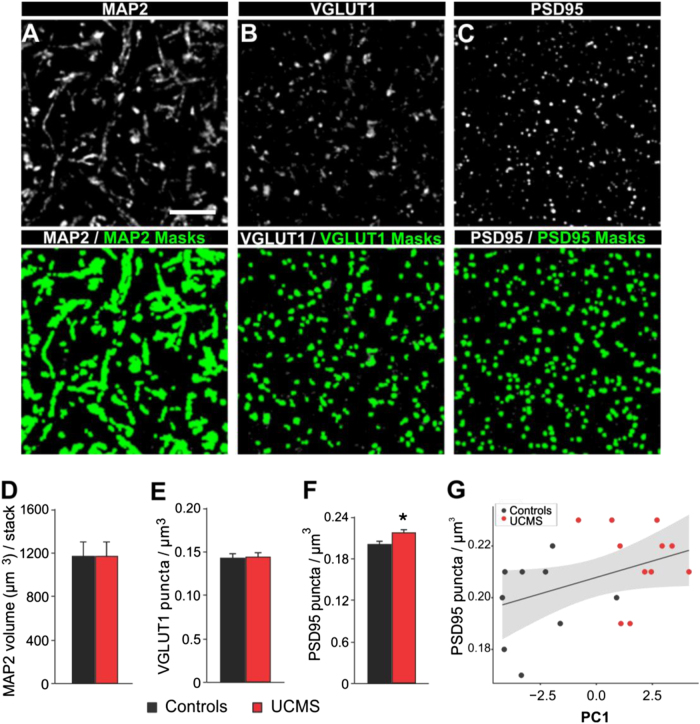
Parallel clinical and preclinical research have begun to illuminate the biological basis of stress-related disorders, including major depression, but translational bridges informing discrete mechanistic targets for intervention are missing. To address this critical need, we used structural MRI in a mouse model and in a large human sample to examine stress effects on brain structure that may be conserved across species. Specifically, we focused on a previously unexplored approach, whole-brain structural covariance, as it reflects synchronized changes in neuroanatomy, potentially due to mutual trophic influences or shared plasticity across regions. Using the unpredictable chronic mild stress (UCMS) paradigm in mouse we first demonstrate that UCMS-induced elevated behavioral emotionality correlates with increased size of the amygdala and other corticolimbic regions. We further identify focal increases in the amygdala's 'hubness' (degree and strength) set against the background of a global stress-related loss of network clustering and modularity. These macroscopic changes are supported on the molecular level by increased postsynaptic density-95 protein in the amygdala, consistent with stress-induced plastic changes and synaptic strengthening. Finally, we provide clinical evidence that strikingly similar structural network reorganization patterns exist in young adults reporting high childhood trauma and increased mood symptoms. Collectively, we provide initial translational evidence for a conserved stress-related increase in amygdala-centered structural synchrony, as measured by enhanced structural covariance, which is paralleled by a decrease in global structural synchrony. This putative trade-off reflected in increased amygdala-centered plastic changes at the expense of global structural dedifferentiation may represent a mechanistic pathway for depression and related psychopathology.


Conflict of interest statement

The authors declare that they have no conflict of interest.

Figures

Fig. 1
Fig. 1. UCMS effects on behavior.
ac UCMS alters home-cage-like behavior. Data represent the average of the first 4 h of the dark cycle measured each week throughout the UCMS exposure (n = 12/group). UCMS-exposed mice showed a decrease in the time spent in the (a) food zone and the (b) drinking zone and an increase in time spent in the (c) shelter zone. Post hoc analysis showed that the effects all three measures were observed at the end of the UCMS exposure (*p < 0.05) compared to home cage controls. df Spotlight challenge induces an anxiogenic response in both control and UCMS-exposed mice. Data presented correspond to the time spent in each zone for the hour before, during and after the spotlight challenge on day 34. UCMS-exposed mice overall spent less time in the (d) food zone and (e) drinking zone, and more time in the (f) shelter zone. Both control and UCMS-exposed mice spent less time in the food zone during the light challenge (***p < 0.001) in favor of the shelter zone. Post hoc analysis showed that the UCMS mice are significantly different from controls, before, during and after the light challenge (*p < 0.05). g UCMS induces degradation of coat state quality. This effect was progressive starting at week 2 (post hoc ***p < 0.0001 compared to control group). h UCMS induces anxiety-like deficits in the elevated plus maze test. UCMS-exposed animals showed a significant decreased in time and percent entries in the open arms compared to the control group (*p < 0.05). Bar and linear graphs show mean ± s.e.m. i PC1 captures the variance attributed to UCMS. Principal component analysis revealed 3 components capturing behavioral variance across the UCMS and control animals. PC1 scores account for the highest between-group difference, relative to PC2 and PC3, thus likely capturing the effect of stress dimensionally across groups
Fig. 2
Fig. 2. Four brain regions showed UCMS-induced changes in volumes that positively correlated with behavioral emotionality.
a Table summarizes group and PC1 significant effects for each brain region significantly affected by UCMS, including variance accounted for, p values, q value following FDR correction for group effect on regional volume, and r2 and p values for correlation between volume and behavioral emotionality assessed by PC1. The four regions are similarly color-coded in the table and brain overlay figure. be Scatterplots depicting the significant positive correlation between behavioral emotionality (PC1) and brain volume for (b) cingulate area 32 (prelimbic cortex), (c) medial orbital cortex, (d) frontal association cortex, (e) amygdala. Colored bands represent 95% confidence intervals
Fig. 3
Fig. 3. UCMS-induced changes in the whole structural covariance-based brain network are accompanied by amygdala changes in degree and strength within the network, as well as synaptic protein density.
Permutation results showed significantly reduced whole-brain network a modularity and b global transitivity as well as an increase in (c) amygdala degree and d amygdala strength in UCMS mouse brains when compared to control. Gray lines represent the spread of the null distribution of between-group differences in each metric, obtained from 10,000 permutations at each density threshold tested. The circles represent the observed between-group differences (UCMS vs. control). Circles below the 0 line indicate the metric is lower in the UCMS group and are colored in dark or light blue, if the difference is significant (*P < 0.05, **P < 0.01) or trending (#P < 0.1), respectively. Circles above the horizontal y = 0 line, indicate the metric is higher in the UCMS group compared to control. Significant differences are marked as *P < 0.05, **P < 0.01 (red) and trends as # P < 0.1 (pink)
Fig. 4
Fig. 4. UCMS-induced changes in synaptic marker densities.
Projection images (i.e., three-dimensional composites or z-stack of three z-planes separated by 0.25 µm) of a mouse basolateral amygdala immunolabeled for (a) MAP2, (b) VGLUT1 and (c) PSD95 showing single channels (above black and white) and single channels overlaid with corresponding object masks for each marker (below in green). Scale bar = 5 µm. While UCMS induced no significant changes in (d) MAP2 volume (µm3) per stack or (e) in VGLUT1 puncta per µm3, UCMS increased f the number of PSD95 puncta per µm3. Bar graphs show mean ± s.e.m. *P < 0.05 compared to control group. g PSD95 density in the amygdala showed a trending positive correlation with behavioral emotionality across groups indexed by PC1. Gray bands represent 95% confidence intervals
Fig. 5
Fig. 5. Cross-species convergence in brain network adaptations to chronic stress.
Reductions of whole brain network modularity (a) global clustering coefficient (b) and increases in amygdala degree (c) and amygdala strength (d) were found in individuals with childhood trauma compared to a control group (low vs. high CTQ). Statistically different decreases are colored in dark (*p < 0.05) or light blue (#p < 0.1), and increases in red and pink, respectively. eh Circular network plots depicting the mouse structural covariance network at 22% density (the lowest density where between-group differences emerge) in control (e) and stress (f) conditions. g, h Human networks depicted at 12% density in (g) control (or low CTQ) and (h) stress (or high CTQ) conditions. Nodes are arranged by degree clockwise, with highest-degree node on top of the circle. Degree is further reflected in node size. The amygdala and its direct connections are highlighted in red. i, j Anatomical view of the stress effects on the amygdala structural covariance subconnectome in both human and mouse brain. Overlays represent binarized masks onto select structural MR image slices of i mouse (coronal slices: Bregma −2.10 mm (top), −3.20 mm (bottom)) and (j) human brain (MNI coordinates: x = 22, y = −2, z = −6). kn Edge-weighted spring-embedded layout network diagram of the amygdala′s direct structural covariance connections across species (mouse—k, l; human—m, n) and conditions (control—k, m; stress l, n). In panels in, regions in purple are part of the amygdala’s network common to control and stress groups and in blue or red are regions unique to each group. Node size reflects overall number of connections for that node within the whole network, however only the connections with the amygdala are pictured. A full list of all visualized nodes is provided in Supplementary Tables 3, 4 and 7)

References

    1. Association AP. Diagnostic and statistical manual of mental disorders. 5th edn (American Psychiatric Publishing, Arlington, VA, 2013).
    1. Kessler RC. The effects of stressful life events on depression. Annu. Rev. Psychol. 1997;48:191–214. doi: 10.1146/annurev.psych.48.1.191. - DOI - PubMed
    1. Kessler RC, et al. The epidemiology of major depressive disorder: results from the National Comorbidity Survey Replication (NCS-R) JAMA. 2003;289:3095–3105. doi: 10.1001/jama.289.23.3095. - DOI - PubMed
    1. Lopez AD, Murray CC. The global burden of disease, 1990–2020. Nat. Med. 1998;4:1241–1243. doi: 10.1038/3218. - DOI - PubMed
    1. Hariri AR, Holmes A. Finding translation in stress research. Nat. Neurosci. 2015;18:1347–1352. doi: 10.1038/nn.4111. - DOI - PMC - PubMed

Publication types