. 2018 Jan;28(1):61-93.
doi: 10.1142/S0218202518500021. Epub 2017 Nov 24.

A HYBRID THREE-SCALE MODEL OF TUMOR GROWTH

Affiliations

A HYBRID THREE-SCALE MODEL OF TUMOR GROWTH

H L Rocha et al. Math Models Methods Appl Sci. 2018 Jan.

Abstract

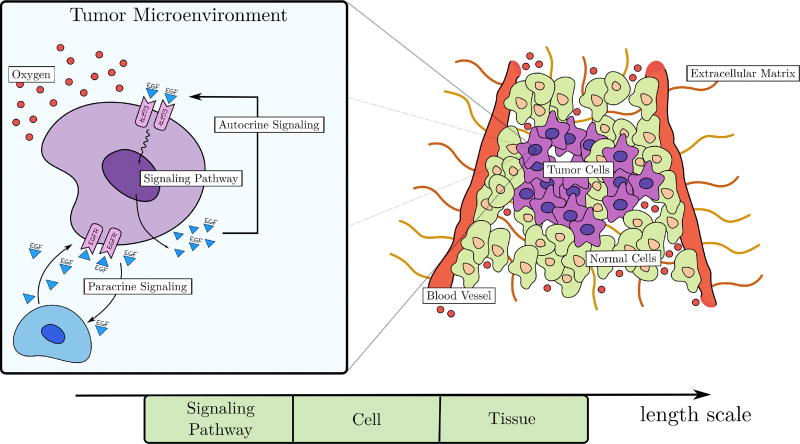
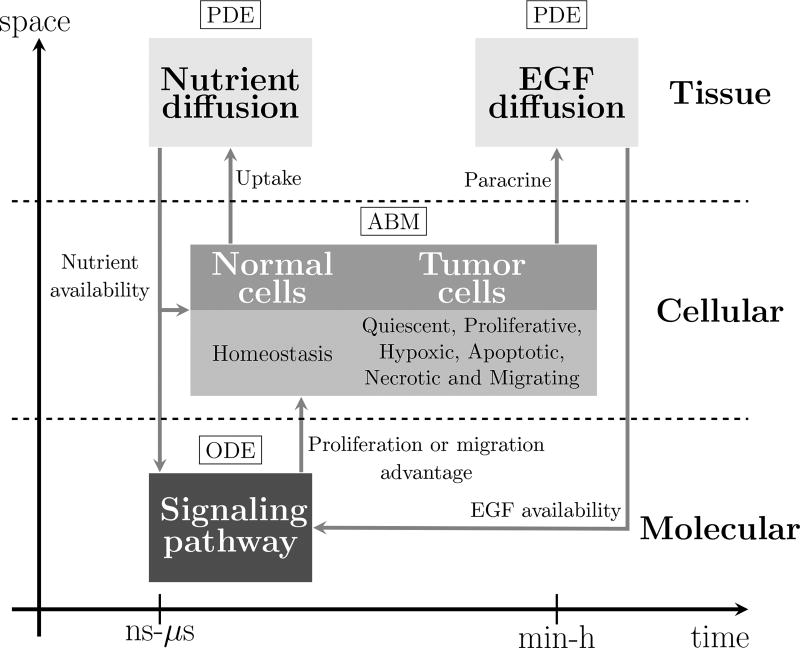
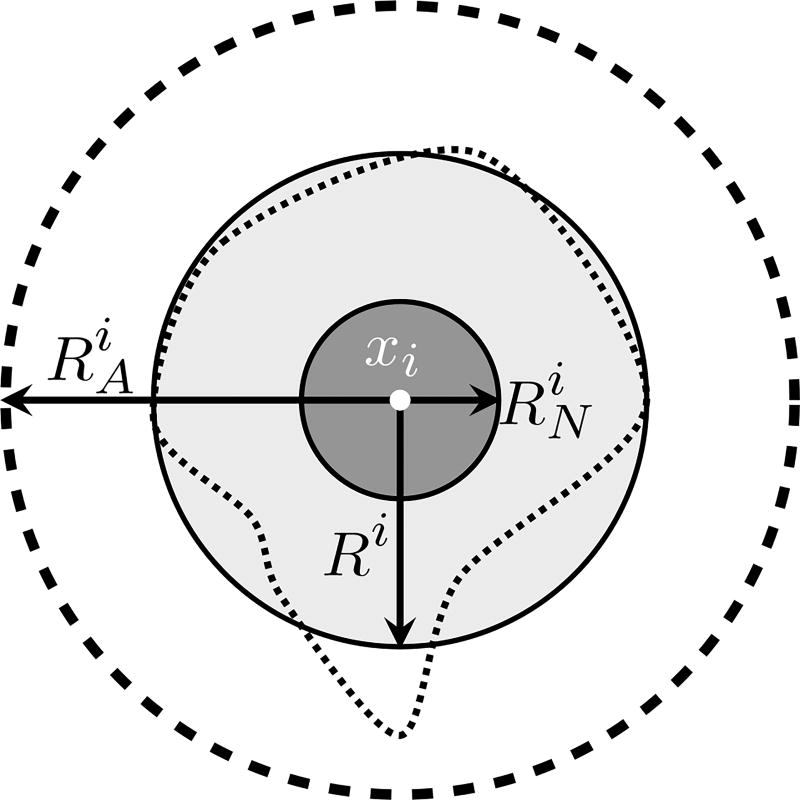
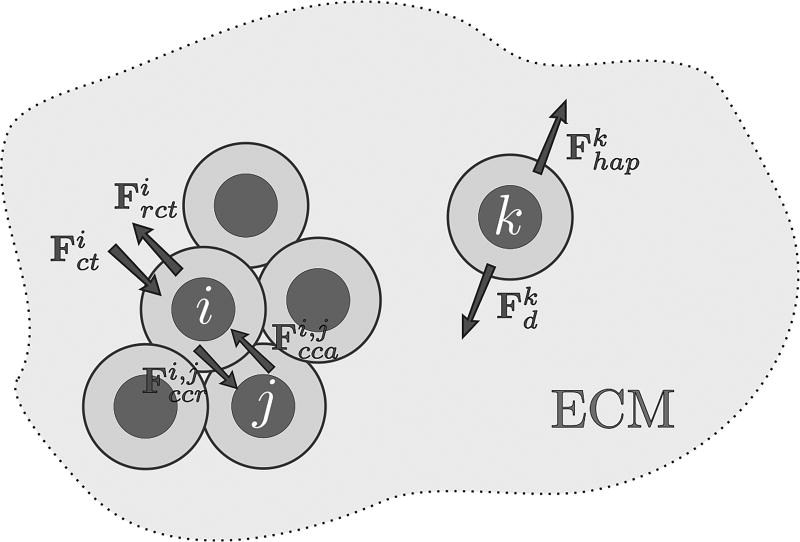
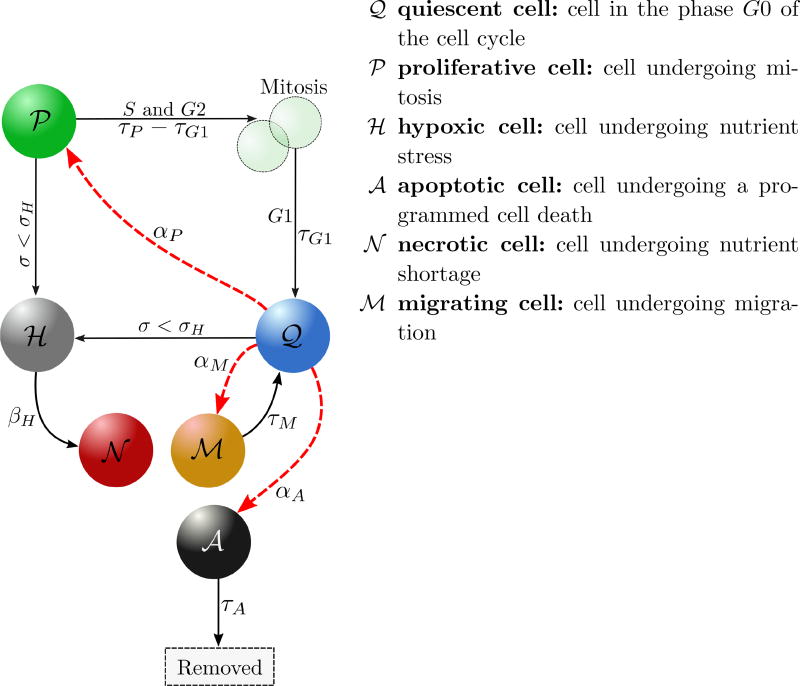
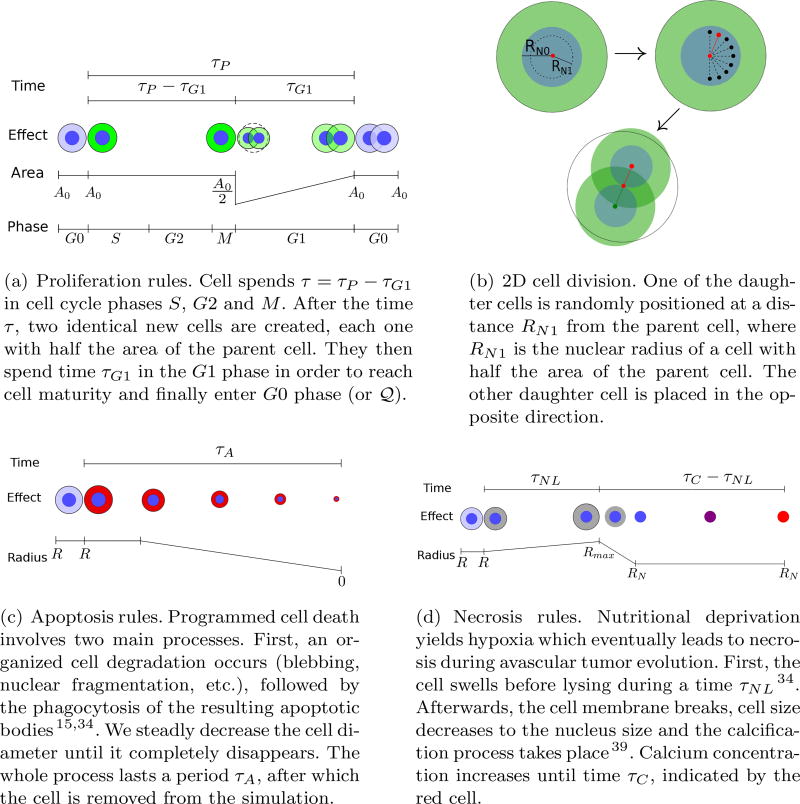
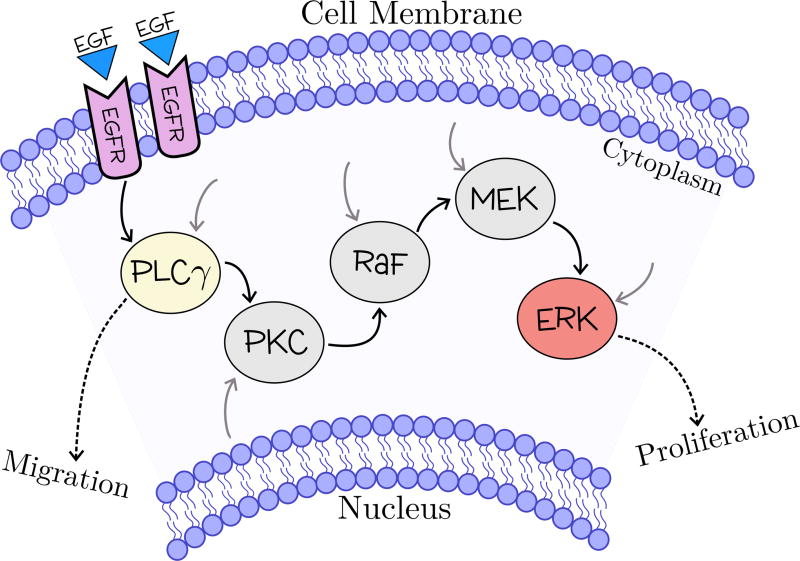
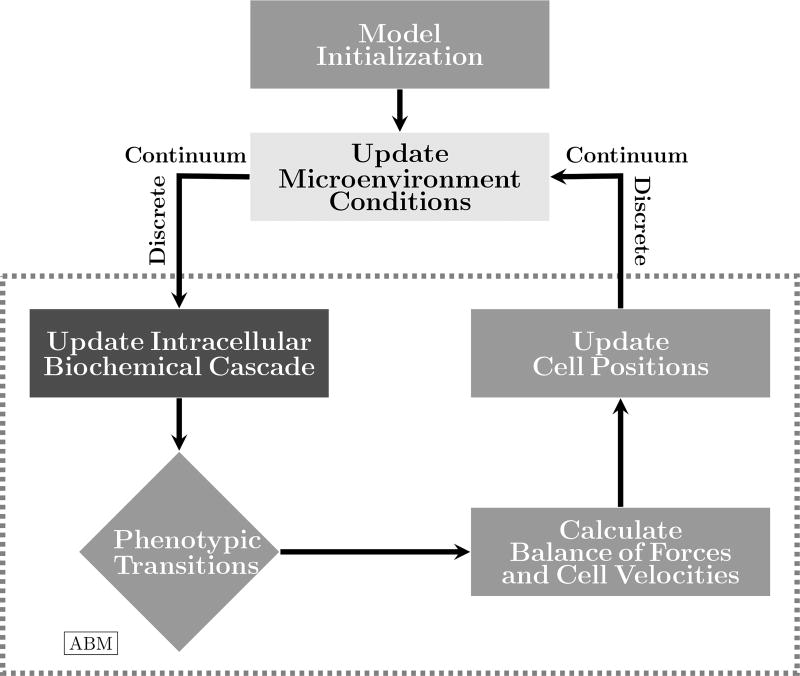
Cancer results from a complex interplay of different biological, chemical, and physical phenomena that span a wide range of time and length scales. Computational modeling may help to unfold the role of multiple evolving factors that exist and interact in the tumor microenvironment. Understanding these complex multiscale interactions is a crucial step towards predicting cancer growth and in developing effective therapies. We integrate different modeling approaches in a multiscale, avascular, hybrid tumor growth model encompassing tissue, cell, and sub-cell scales. At the tissue level, we consider the dispersion of nutrients and growth factors in the tumor microenvironment, which are modeled through reaction-diffusion equations. At the cell level, we use an agent based model (ABM) to describe normal and tumor cell dynamics, with normal cells kept in homeostasis and cancer cells differentiated apoptotic, hypoxic, and necrotic states. Cell movement is driven by the balance of a variety of forces according to Newton's second law, including those related to growth-induced stresses. Phenotypic transitions are defined by specific rule of behaviors that depend on microenvironment stimuli. We integrate in each cell/agent a branch of the epidermal growth factor receptor (EGFR) pathway. This pathway is modeled by a system of coupled nonlinear differential equations involving the mass laws of 20 molecules. The rates of change in the concentration of some key molecules trigger proliferation or migration advantage response. The bridge between cell and tissue scales is built through the reaction and source terms of the partial differential equations. Our hybrid model is built in a modular way, enabling the investigation of the role of different mechanisms at multiple scales on tumor progression. This strategy allows representating both the collective behavior due to cell assembly as well as microscopic intracellular phenomena described by signal transduction pathways. Here, we investigate the impact of some mechanisms associated with sustained proliferation on cancer progression. Specifically, we focus on the intracellular proliferation/migration-advantage-response driven by the EGFR pathway and on proliferation inhibition due to accumulation of growth-induced stresses. Simulations demonstrate that the model can adequately describe some complex mechanisms of tumor dynamics, including growth arrest in avascular tumors. Both the sub-cell model and growth-induced stresses give rise to heterogeneity in the tumor expansion and a rich variety of tumor behaviors.

Keywords: Cell-agent based model; Hybrid multiscale model; Signaling pathway.


Figures

Fig. 1
Fig. 1
Schematic description of the key biological characteristics included in the model. The tumor microenvironment is highly heterogeneous, consisting of normal and cancer cells, extracellular matrix, and blood vessels. Original blood vessels provide oxygen that maintains cell viability. The box on the left presents an enlargement of an individual tumor cell indicating its interactions with the surrounding mileau via autocrine and paracrine signaling as well uptake of oxygen.
Fig. 2
Fig. 2
Schematic description of the model. The nutrient and EGF dispersions that occur at the tissue scale are modeled by partial differential equations. At the cell scale, healthy and cancer cells are described using an agent based model. The intracellular phenomena that regulate cell proliferation and cell migration are described by a mass action model of the biochemical signaling pathway through a system of ordinary differential equations.
Fig. 3
Fig. 3
Geometric cell description of the ith cell, in which Ri is the cell radius, RNi is the nuclear radius, and RAi is the action radius. The irregular dashed curve represents one possible cell geometry which is simplified by the assumption of the circular cell shape. This approach is inspired by Ref. .
Fig. 4
Fig. 4
Cell-cell adhesion and repulsion are represented by pairwise forces Fccaij and Fccrij, respectively. Tumor growth gives rise to compression and resistance to compression forces ( Fcti and Frcti, respectively), and all moving cells undergo a drag force of interstitial fluid flow (Fd). ECM heterogeneity may yield haptotaxis to migrating cells (Fhap). This approach is inspired by Ref. .
Fig. 5
Fig. 5
Gradients of potential functions φ (a) and ψ (b) with respect to the distance from the center of the cell for RN = 5.295 µm, R = 9.953 µm and RA = 12.083 µm. Both cancel out for distances greater than the action radius RA.
Fig. 6
Fig. 6
Schematic illustration of cancer cell transitions, that can be deterministic (black arrows) or stochastic (red arrows). αP, αM and αA are intensity functions of the stochastic processes. Cells become hypoxic if the nutrient concentration σ drops bellow the threshold σH. Hypoxic cells become necrotic automatically (at a rate βH → ∞) since we are considering an avascular model. Apoptotic cells are removed from the simulation after τA, time at which the processes of organized cell degradation and phagocytosis take place. Quiescent cells may achieve proliferation or migration advantage. Once a cell receives the proliferation signal, the cell cycle begins, lasting a time τP, in which mitosis (M) takes place after the S and G2 phases. The daughter cells enter the quiescent state (G0) after the growth phase G1, that lasts a time τG1. Migration proceeds for a time τM after which cells return to the quiescent state.
Fig. 7
Fig. 7
Cell transition rules (inspired by Ref. 29) and 2D cell division. The corresponding algorithms are shown in Appendix A.
Fig. 8
Fig. 8
Schematic illustration of a simplified version of the EGFR signaling pathway, in which only the key molecules included in the model are displayed. The EGF binds to the cell surface EGFR, triggering a biochemical cascade involving key signaling molecules: enzyme PLCγ and protein quinases PKC, Raf, MEK and ERK. The black, grey and dashed arrows indicate the signaling pathway, the cross-talk junctions with other pathways and the biological regulatory response, respectively.
Fig. 9
Fig. 9
Schematic representation of the model solution process. Given an initial configuration of the ABM, the microenvironment conditions are updated by solving the reaction-diffusion models. Oxygen and EGF concentrations are translated to the cell scale, and the intracellular model is solved to determine whether each cell has achieved a proliferation or migration advantage. Phenotypic transitions are carried out according to the ABM rules. Cell forces are updated and their balances lead to new cell positions. Cell attributes are translated back to the tissue scale, completing the time-step evolution.
Fig. 10
Fig. 10
Notation used in the simulations. Healthy cells are denoted by 𝒩ormal, and tumor cells are differentiated by phenotype: quiescent (𝒬), proliferative (𝒫), migrating (ℳ), apoptotic (𝒜), early stages of necrosis (𝒩) and three increasingly higher levels of calcification.
Fig. 11
Fig. 11
Initial condition: (left) normal cells randomly placed, and four tumor cells at the center (two proliferative and two quiescent cells); (center) uniform oxygen field; (right) EGF released by the quiescent cells.
Fig. 12
Fig. 12
Experiment 1: One realization of the ABM model (left column), oxygen dispersion (middle column), and EGF dispersion (right column). Cells are subject to pathway proliferation control and no negative feedback from compressive stress accumulation due to growth.
Fig. 13
Fig. 13
Experiment 2: One realization of the ABM model (left column), oxygen dispersion (middle column), and EGF dispersion (right column). Cells subject to the pathway proliferation control and negative feedback from compressive stress accumulation due to growth.
Fig. 14
Fig. 14
Evolution of the mean of individual cell phenotypes. 𝒩, 𝒬, 𝒫 and ℋ stand for the number of cells in the necrotic, quiescent, proliferative and healthy phenotypes, respectively. The shaded areas represent the standard deviations at each evolution time.
Fig. 15
Fig. 15
Evolution of the mean of individual phenotypes without considering the signaling pathway, and setting P to different values. Although the general behavior is quite similar, some differences in the growth dynamics are visible. Higher P values lead to faster and greater growth of proliferative cells. As the availability of oxygen is limited, a greater number of proliferative cells cause a faster consumption of the oxygen supply, leading to faster stagnation of tumor growth.
Fig. 16
Fig. 16
Evolution of the mean of individual cell phenotypes for P = 0.52. The shaded areas represent the standard deviations at each evolution time. These variabilities are remarkably smaller than those that emerge from the intracellular control (see Figure 14).
Fig. 17
Fig. 17
Experiment 3: One realization of the ABM model (left column), oxygen dispersion (middle column), and EGF dispersion (right column). Cells are subject to the pathway control and negative proliferation feedback from compressive stress accumulation due to growth.
Fig. 18
Fig. 18
Evolution of individual cell phenotypes (a). The vertical axis display the number of cells in the normal, quiescent (Q), proliferative (P) and necrotic (N) phenotypes. The details of the evolution of the mean of the number of migrating cells and corresponding standard deviations at each evolution time (b). Although the number of migratory cells is small, the tumor dynamics are greatly accelerated.

References

    1. Anderson ARA. A hybrid multiscale model of solid tumour growth and invasion: evolution and the microenvironment. chapter I.1. Birkháuser; 2007. pp. 3–28.
    1. Anderson Alexander RA, Chaplain Mark AJ, Rejniak Katarzyna A. Single-cell-based models in biology and medicine. Birkhäuser Verlag AG; 2007.
    1. Athale Chaitanya, Deisboeck Thomas S. The effects of egf-receptor density on multiscale tumor growth patterns. Journal of Theoretical Biology. 2006;238:771–779. - PubMed
    1. Athale Chaitanya, Mansury Yuri, Deisboeck Thomas S. Simulating the impact of a molecular “decision-process” on cellular phenotype and multicellular patterns in brain tumors. Journal of Theoretical Biology. 2005;233:469–481. - PubMed
    1. Byrne HM. Mathematics and Life Sciences. chapter 12. University of Oxford; 2012. pp. 279–312.

LinkOut - more resources