. 2018 Jan 4:11:126.
doi: 10.3389/fnana.2017.00126. eCollection 2017.

Hippocampal Astrocytes in Migrating and Wintering Semipalmated Sandpiper Calidris pusilla

Affiliations

Hippocampal Astrocytes in Migrating and Wintering Semipalmated Sandpiper Calidris pusilla

Dario Carvalho-Paulo et al. Front Neuroanat. .

Abstract

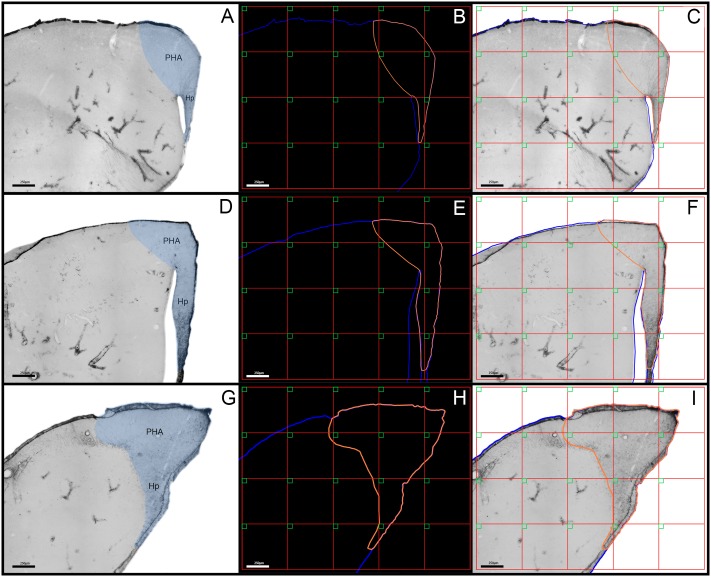
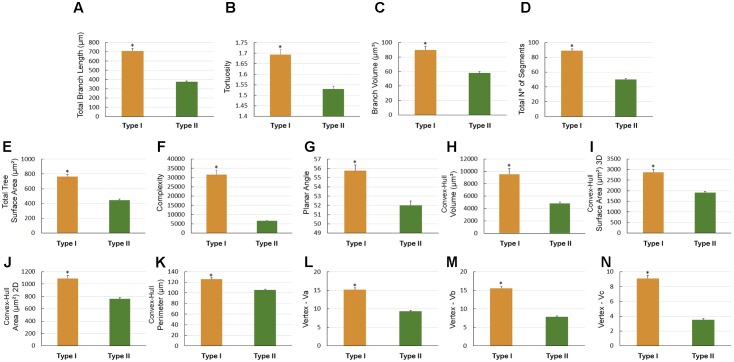
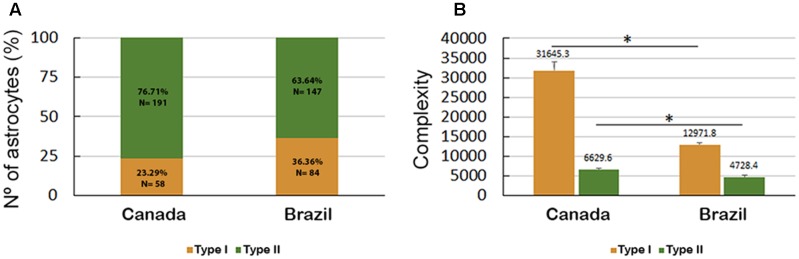
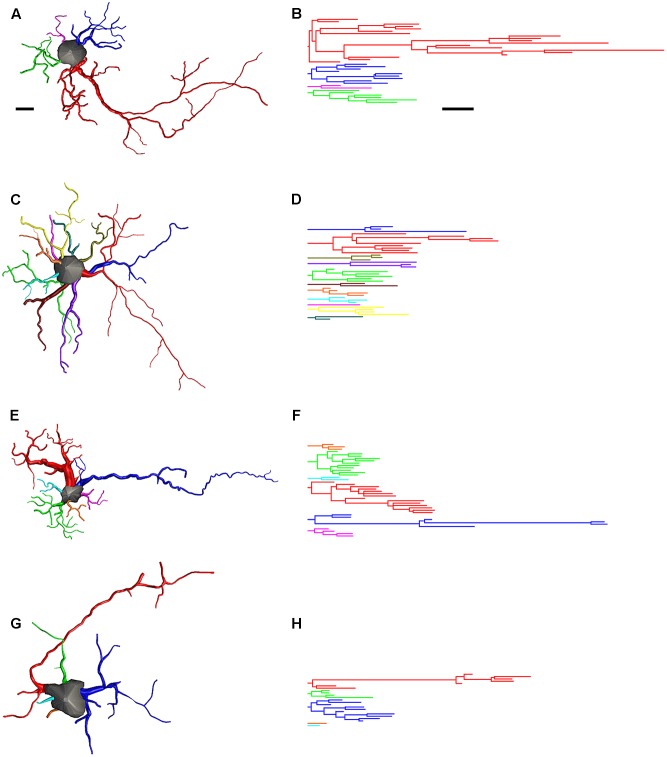
Seasonal migratory birds return to the same breeding and wintering grounds year after year, and migratory long-distance shorebirds are good examples of this. These tasks require learning and long-term spatial memory abilities that are integrated into a navigational system for repeatedly locating breeding, wintering, and stopover sites. Previous investigations focused on the neurobiological basis of hippocampal plasticity and numerical estimates of hippocampal neurogenesis in birds but only a few studies investigated potential contributions of glial cells to hippocampal-dependent tasks related to migration. Here we hypothesized that the astrocytes of migrating and wintering birds may exhibit significant morphological and numerical differences connected to the long-distance flight. We used as a model the semipalmated sandpiper Calidris pusilla, that migrates from northern Canada and Alaska to South America. Before the transatlantic non-stop long-distance component of their flight, the birds make a stopover at the Bay of Fundy in Canada. To test our hypothesis, we estimated total numbers and compared the three-dimensional (3-D) morphological features of adult C. pusilla astrocytes captured in the Bay of Fundy (n = 249 cells) with those from birds captured in the coastal region of Bragança, Brazil, during the wintering period (n = 250 cells). Optical fractionator was used to estimate the number of astrocytes and for 3-D reconstructions we used hierarchical cluster analysis. Both morphological phenotypes showed reduced morphological complexity after the long-distance non-stop flight, but the reduction in complexity was much greater in Type I than in Type II astrocytes. Coherently, we also found a significant reduction in the total number of astrocytes after the transatlantic flight. Taken together these findings suggest that the long-distance non-stop flight altered significantly the astrocytes population and that morphologically distinct astrocytes may play different physiological roles during migration.

Keywords: 3-D glial cell; Bay of Fundy; Canela; Nearctic bird; non-stop flight; stereology.


Figures

FIGURE 1
FIGURE 1
(A,D,G) Low-power photomicrographs of the C. pusilla hippocampal formation from rostral (A), medial (D), and caudal (G) sections that were immunolabeled with anti-GFAP antibody to define the limits of the area of interest and the sampling strategy (C,F,I). The hippocampal formation comprises the hippocampus proper (Hp) and the parahippocampal area (PHA). The hippocampal formation is shown in blue. Intense GFAP immunostaining clearly shows the V region of the hippocampus proper. (B,E,H) The red grid establishes the intervals between the square green boxes and illustrates the systematic random sampling approach. (C,F,I) The number of boxes in each section was proportional to the area covered by the hippocampal formation. A single astrocyte located inside every box was selected for 3-D reconstruction. Scale bars: 250 μm.
FIGURE 2
FIGURE 2
Schematic representation of the morphometric features obtained from the three-dimensional reconstructions. Comparisons of 20 morphometric variables (1–20) revealed significant differences between astrocyte types (Type I versus Type II) and between the experimental groups (migrating versus wintering birds). Scale bars = 10 μm. Green numbers have drawings for better definitions of the variables.
FIGURE 3
FIGURE 3
Hippocampal formation brain section photo from a C. pusilla, captured on the coast of Bragança, Pará, Brazil, show a stellate astrocyte from the gray matter of the hippocampal V region. Scale bars: (A) 250 μm, (B) 250 μm, (C) 120 μm, (D) 60 μm, and (E) 25 μm.
FIGURE 4
FIGURE 4
Three-dimensional reconstructions and the respective dendrograms of stellate (A,B), vascular (C,D), and radial (E,F) astrocytes. Radial astrocytes were not included in our analysis.
FIGURE 5
FIGURE 5
The morphological phenotypes of astrocytes in the hippocampal formation of C. pusilla migrating birds. Cluster discriminant analysis (Ward’s method) was performed after three-dimensional reconstruction of astrocytes from five birds. (A) Dendrogram groupings of 249 astrocytes identified two main morphological phenotypes, Type I and Type II. (B) Graphic representation of complexity mean values and corresponding standard errors illustrates the significant differences between Type I and Type II astrocytes. means there is a significant difference between Type I and Type II astrocytes. (C) Graphic representation of discriminant analysis. Note higher dispersion of red filled square corresponding to Type I astrocytes. (D) Discriminant statistical analysis results. The variable that contributed the most to cluster formation was complexity (p < 0.000). Type I astrocytes (red filled square) showed higher xy dispersion than Type II astrocytes (green filled circles). Astrocytes were reconstructed from the rostral to the caudal regions of the hippocampal formation; cluster analysis was based on multimodal or at least bi-modal morphometric features of the astrocytes (MMI > 0.55).
FIGURE 6
FIGURE 6
The morphological phenotypes of astrocytes in the hippocampal formation of C. pusilla wintering birds. Cluster discriminant analysis (Ward’s method) was performed after three-dimensional reconstructions of astrocytes from five birds. (A) Dendrogram groupings of 231 astrocytes identified two main morphological phenotypes, Type I and Type II. (B,C) Graphic representation of complexity and branch volume mean values and corresponding standard errors illustrate the significant differences between Type I and Type II astrocytes. means significant statistical diferences. (D) Graphic representation of the discriminant analysis. The variable that contributed the most to cluster formation was complexity (p < 0.000). Type I astrocytes (red filled square) showed higher xy dispersion than Type II astrocytes (green filled circles). Astrocytes were reconstructed from both the rostral and caudal regions of the hippocampal formation; cluster analysis was based on multimodal or at least bi-modal morphometric features of astrocytes (MMI > 0.55). (E) Discriminant statistical analysis results.
FIGURE 7
FIGURE 7
Morphometry of astrocytes that were three-dimensionally reconstructed from the hippocampal formation of five C. pusilla individuals captured on the Bay of Fundy, Canada (migrating birds). (A–L) Graphic representations show the mean values and standard errors for 12 morphological parameters in Type I astrocytes. Note that after the transatlantic flight, the astrocytes in wintering birds showed shorter total length; lower branch volume; a reduced number of segments and branch surfaces; were less complex; had reduced volume, surface, area, and perimeter of convex-hull and had fewer vertices (Va, Vb, and Vc). Asterisk “” indicates statistical significant differences.
FIGURE 8
FIGURE 8
Morphometry of astrocytes that were three-dimensionally reconstructed from the hippocampal formation of 5 C. pusilla individuals captured on the Bay of Fundy, Canada (migrating birds). (A–N) Graphic representations show the mean values and standard errors for 14 morphological parameters in Type I and II astrocytes. Asterisk “” indicates statistical significant differences.
FIGURE 9
FIGURE 9
(A) Percentage and number of Type I and Type II astrocytes in C. pusilla migrating (Canada) and wintering (Brazil) birds and (B) astrocyte complexity. The bars in (B) show the means and standard error values. Note that Type II astrocytes were less complex than Type I astrocytes, were less affected by the long-distance flight and accounted for a higher proportion of the astrocyte population both in migrating (Canada) and wintering (Brazil) birds. means significant statistical diferences.
FIGURE 10
FIGURE 10
Astrocytes Types I and II morphometry that were three-dimensionally reconstructed from the hippocampal formation of five C. pusilla birds captured on Isla Canela, Bragança, Brazil (wintering birds). (A–L) Graphic representation of the mean and standard error values of 12 morphological parameters of Type I and II astrocytes. Asterisk “” indicates statistical significant differences.
FIGURE 11
FIGURE 11
Morphometry of Type II astrocytes that were three-dimensionally reconstructed from the hippocampal formation of five C. pusilla birds captured on the Bay of Fundy, Canada and on Isla Canela, Bragança, Brazil. (A–O) Graphic representation of the mean and standard error values of 15 morphological parameters of Type II astrocytes. Apart from the mean branch length and planar angle values, which tended to increase after the long flight, the mean values of all other features tended to be reduced in wintering birds. Asterisk “” indicates statistical significant differences.
FIGURE 12
FIGURE 12
Three-dimensional reconstructions and correspondent dendrograms of Type I (A,B) and Type II astrocytes (C,D) from migrating birds and Type I (E,F) and Type II astrocytes (G,H) from wintering birds. Dendrogram were plotted and analyzed with Neurolucida Explorer (MBF Bioscience, Williston, VT United States). Branches of the same parental (primary branch) trunk are shown in one color. As compared to migrating, wintering birds show significant shrinkage of astrocytes branches. Scale bar are the same for (A–H) 10 μm.
FIGURE 13
FIGURE 13
Morphological phenotypes of astrocytes in the hippocampal formation of C. pusilla wintering birds. Cluster discriminant analysis (Ward’s method) was applied to three-dimensional reconstructions of astrocytes from five birds. (A) Dendrogram groupings of 250 astrocytes show three main morphological phenotypes (Type I, Type II, and Type III). (B,C) Graphic representation of the mean complexity and branch volume values and standard errors to illustrate the significant morphological differences between the morphological phenotypes of birds captured before (Canada) and after (Brazil) a long-distance transatlantic flight. means significant statistical diferences. (D) Graphic representation of the discriminant analysis. Complexity was the variable that contributed most to cluster formation (p < 0.000). Type I astrocytes (red filled square) showed higher xy dispersion than Type II astrocytes (green filled circles). The astrocytes were reconstructed from both the rostral and caudal regions of the hippocampal formation; the cluster analysis was based on multimodal or at least bi-modal morphometric features of the astrocytes (MMI > 0.55). Note that the small cluster (19 cells) of Type III astrocytes was not distinguishable when the outliers were removed from the sample.

References

    1. Achanta L. B., Rae C. D. (2017). β-hydroxybutyrate in the brain: one molecule, multiple mechanisms. Neurochem. Res. 42 35–49. 10.1007/s11064-016-2099-2 - DOI - PubMed
    1. Almutairi M. M., Gong C., Xu Y. G., Chang Y., Shi H. (2016). Factors controlling permeability of the blood-brain barrier. Cell Mol. Life. Sci 73 57–77. 10.1007/s00018-015-2050-8 - DOI - PMC - PubMed
    1. Arakawa T., Goto T., Okada Y. (1991). Effect of ketone body (D-3-hydroxybutyrate) on neural activity and energy metabolism in hippocampal slices of the adult guinea pig. Neurosci. Lett. 130 53–56. 10.1016/0304-3940(91)90225-I - DOI - PubMed
    1. Astié A. A., Scardamaglia R. C., Muzio R. N., Reboreda J. C. (2015). Sex differences in retention after a visual or a spatial discrimination learning task in brood parasitic shiny cowbirds. Behav. Processes 119 99–104. 10.1016/j.beproc.2015.07.016 - DOI - PubMed
    1. Atoji Y., Sarkar S., Wild J. M. (2016). Proposed homology of the dorsomedial subdivision and V-shaped layer of the avian hippocampus to Ammon’s horn and dentate gyrus, respectively. Hippocampus 26 1608–1617. 10.1002/hipo.22660 - DOI - PubMed

LinkOut - more resources