. 2017 Dec 4:3:17078.
doi: 10.1038/cddiscovery.2017.78. eCollection 2017.

Parthenolide prevents resistance of MDA-MB231 cells to doxorubicin and mitoxantrone: the role of Nrf2

Affiliations

Parthenolide prevents resistance of MDA-MB231 cells to doxorubicin and mitoxantrone: the role of Nrf2

Daniela Carlisi et al. Cell Death Discov. .

Abstract

Triple-negative breast cancer is a group of aggressive cancers with poor prognosis owing to chemoresistance, recurrence and metastasis. New strategies are required that could reduce chemoresistance and increases the effectiveness of chemotherapy. The results presented in this paper, showing that parthenolide (PN) prevents drug resistance in MDA-MB231 cells, represent a contribution to one of these possible strategies. MDA-MB231 cells, the most studied line of TNBC cells, were submitted to selection treatment with mitoxantrone (Mitox) and doxorubicin (DOX). The presence of resistant cells was confirmed through the measurement of the resistance index. Cells submitted to this treatment exhibited a remarkable increment of NF-E2-related factor 2 (Nrf2) level, which was accompanied by upregulation of catalase, MnSOD, HSP70, Bcl-2 and P-glycoprotein. Moreover, as a consequence of overexpression of Nrf2 and correlated proteins, drug-treated cells exhibited a much lower ability than parental cells to generate ROS in response to a suitable stimulation. The addition of PN (2.0 μM) to Mitox and DOX, over the total selection time, prevented both the induction of resistance and the overexpression of Nrf2 and correlated proteins, whereas the cells showed a good ability to generate ROS in response to adequate stimulation. To demonstrate that Nrf2 exerted a crucial role in the induction of resistance, the cells were transiently transfected with a specific small interfering RNA for Nrf2. Similarly to the effects induced by PN, downregulation of Nrf2 was accompanied by reductions in the levels of catalase, MnSOD, HSP70 and Bcl-2, prevention of chemoresistance and increased ability to generate ROS under stimulation. In conclusion, our results show that PN inhibited the development of the resistance toward Mitox and DOX, and suggest that these effects were correlated with the prevention of the overexpression of Nrf2 and its target proteins, which occurred in the cells submitted to drug treatment.


Conflict of interest statement

The authors declare no conflict of interest.

Figures

Figure 1
Figure 1
The effects exerted by Mitox and DOX on the growth of cultured HMEC and MDA-MB231 cells. The influence of PN. Cells (2×10⁵) were seeded in 25 cm2 flasks in 7.5 ml of medium. Viability was measured every 2 days by means of Trypan Blue assay. (a) HMEC and MDA-MB 231 cells cultured in medium in the absence or the presence of 2.0 μM PN. Growth of untreated MDA-MB 231 cells was stopped at 10th day when the cultures were near to the confluence, whereas in the presence of PN was stopped at 16th day. (b) Cells cultured in medium containing 10 nM Mitox without or with 2.0 μM PN. (c) Cells cultured in medium containing 20 nM DOX without or with 2.0 μM PN. All the values are the means±S.D. of four different experiments.
Figure 2
Figure 2
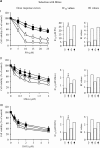
MDA-MB231 cells developed resistance under the exposure to Mitox or DOX. PN partially prevented this event. MDA-MB231 cells (5×10⁵) were seeded in 75 cm2 flasks in 15.0 ml of medium. Selection with Mitox and DOX was performed as reported in methods. In order to investigate whether PN prevents the development of resistance, cells were pre-treated for 2 days with 2.0 μM PN alone, then the drugs were added and the combined treatment was protracted for the total selection time. At the end cells of all the conditions were maintained for other 5 days in medium without both drugs and PN. Panels a and b report results concerning cells submitted to selection with Mitox or DOX, respectively. In order to ascertain the degree of resistance reached in the various conditions, the cells were collected and employed, as reported in methods, to test the effect on viability exerted for 48 h by various doses of (I) PN, (II) Mitox and (III) DOX. Viability was ascertained for the following conditions: parental cells (--○--); cells treated with drugs to acquire resistance (--●--); cells treated with drugs plus 2.0 μM PN (--□--); cells treated with drugs plus PN as in the previous condition, but with the difference that 2.0 mM NAC were added in the samples performed to test viability (--■---). Viability was assessed by MTT assay and reported for each condition as percentage of cells treated with vehicle only. For each compound tested and for each condition the Figures report dose–response curve, IC50 value calculated from dose–response curves and the RI. The results are the means of four different experiments±S.D. *P<0.01 versus parental cells; #P<0.01 versus cells treated with Mitox or DOX plus PN.
Figure 2
Figure 2
MDA-MB231 cells developed resistance under the exposure to Mitox or DOX. PN partially prevented this event. MDA-MB231 cells (5×10⁵) were seeded in 75 cm2 flasks in 15.0 ml of medium. Selection with Mitox and DOX was performed as reported in methods. In order to investigate whether PN prevents the development of resistance, cells were pre-treated for 2 days with 2.0 μM PN alone, then the drugs were added and the combined treatment was protracted for the total selection time. At the end cells of all the conditions were maintained for other 5 days in medium without both drugs and PN. Panels a and b report results concerning cells submitted to selection with Mitox or DOX, respectively. In order to ascertain the degree of resistance reached in the various conditions, the cells were collected and employed, as reported in methods, to test the effect on viability exerted for 48 h by various doses of (I) PN, (II) Mitox and (III) DOX. Viability was ascertained for the following conditions: parental cells (--○--); cells treated with drugs to acquire resistance (--●--); cells treated with drugs plus 2.0 μM PN (--□--); cells treated with drugs plus PN as in the previous condition, but with the difference that 2.0 mM NAC were added in the samples performed to test viability (--■---). Viability was assessed by MTT assay and reported for each condition as percentage of cells treated with vehicle only. For each compound tested and for each condition the Figures report dose–response curve, IC50 value calculated from dose–response curves and the RI. The results are the means of four different experiments±S.D. *P<0.01 versus parental cells; #P<0.01 versus cells treated with Mitox or DOX plus PN.
Figure 3
Figure 3
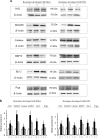
Development of resistance induced overexpression of Nrf2 and correlated proteins, an effect which was partially prevented by PN. MDA-MB231 cells were submitted to treatment with Mitox or DOX, as reported in methods, in order to develop the resistance. In some samples 2.0 μM PN were added two days before the drugs and maintained for the total selection time together with the drugs. Western blotting analysis was performed as reported in methods. (1) Parental cells; (2) cells selected with Mitox or DOX; (3) cells treated with Mitox or DOX plus PN. (a) Images of western blotting analysis. Results are representative of four different experiments. (b) Estimation by densitometric analysis of the intensity of the bands. The results are the means of four distinct experiments±S.D. *P<0.01 versus parental cells; #P<0.01 versus cells treated with Mitox or DOX plus PN.
Figure 4
Figure 4
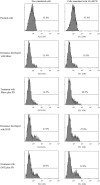
The development of resistance inhibited ROS generation. Addition of 2.0 μM PN to the drugs during the selection time reduced the inhibitory effect on ROS generation. Parental and resistant cells were treated for 1 h with 10 μM PN in order to stimulate production of ROS. At the end 10 μM H2-DCFDA were added for 20 min, then the cells were collected and employed for cytofluorimetric analysis. Results are representative of three different experiments.
Figure 5
Figure 5
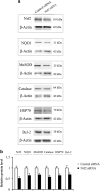
Silencing of Nrf2 decreased the expression of antioxidant and cytoprotective proteins. Nrf2 was silenced in parental MDA-MB231 cells, as reported in methods. After 24 h whole cellular extracts were prepared and submitted to western blotting analysis. (a) Images of western blotting analysis. Results are representative of four different experiments. (b) Estimation by densitometric analysis of the intensity of the bands. The results are the means of four distinct experiments±S.D.
Figure 6
Figure 6
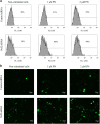
Silencing of Nrf2 in parental MDA-MB231 cells enhanced the intracellular level of ROS and the effect of PN on ROS generation. Nrf2 was silenced in parental MDA-MB231 cells as reported in methods. After 5 h of transfection the cells were employed, as described in methods, for (a) cytofluorimetric analysis and (b) visualization by fluorescence microscope. Results are representative of three different experiments.

Similar articles

Cited by

References

    1. Al-Hajj M, Wicha MS, Benito-Hernandez A, Morrison SJ, Clarke MF. Prospective identification of tumorigenic breast cancer cells. Proc Natl Acad Sci USA 2003; 100: 3983–3988. - PMC - PubMed
    1. Siegel RL, Miller KD, Jemal A. Cancer statistics, 2016. CA Cancer J Clin 2016; 66: 7–30. - PubMed
    1. Ouyang M, Li Y, Ye S, Ma J, Lu L, Lv W et al. MicroRNA profiling implies new markers of chemoresistance of triple-negative breast cancer. PLoS One 2014; 9: e96228. - PMC - PubMed
    1. Morris GJ, Naidu S, Topham AK, Guiles F, Xu Y, McCue P et al. Differences in breast carcinoma characteristics in newly diagnosed African-American and Caucasian patients: a single-institution compilation compared with the National Cancer Institute's Surveillance, Epidemiology, and End Results database. Cancer 2007; 110: 876–884. - PubMed
    1. O'Reilly EA, Gubbins L, Sharma S, Tully R, H Guang MH, Weiner-Gorzel K et al. The fate of chemoresistance in triple negative breast cancer (TNBC). BBA Clin 2015; 3: 257–275. - PMC - PubMed