. 2018 May 15:172:130-145.
doi: 10.1016/j.neuroimage.2017.12.064. Epub 2018 Feb 3.

Mapping population-based structural connectomes

Affiliations

Mapping population-based structural connectomes

Zhengwu Zhang et al. Neuroimage. .

Abstract

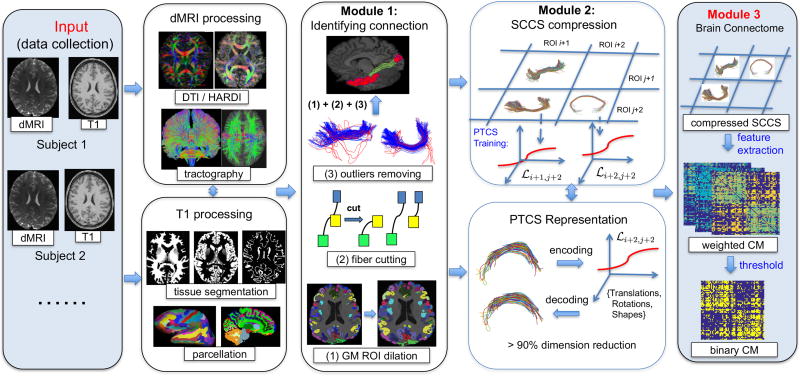
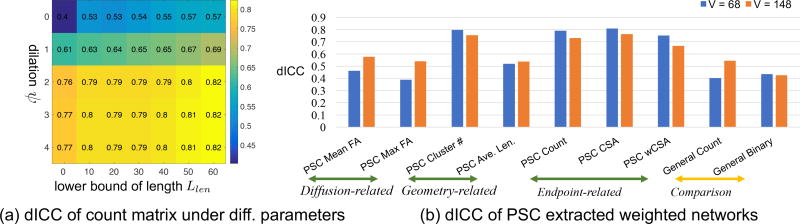
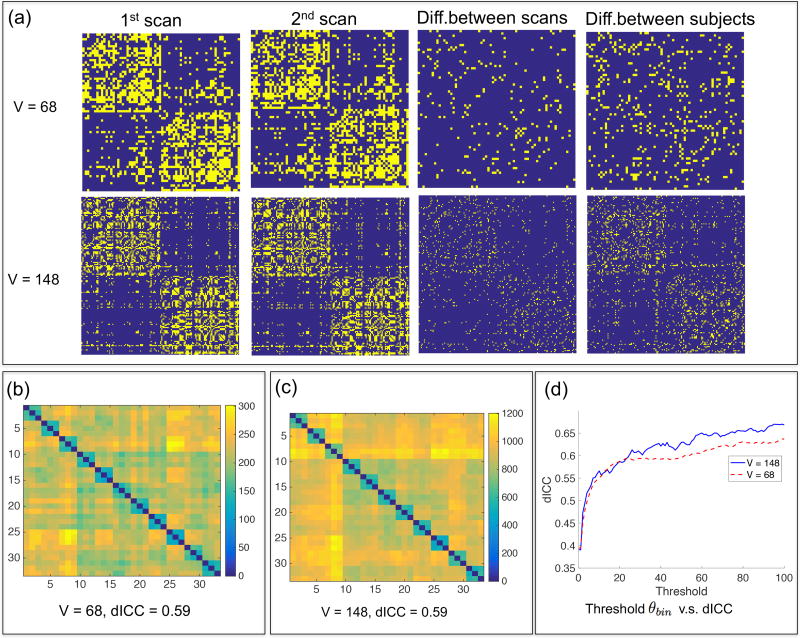
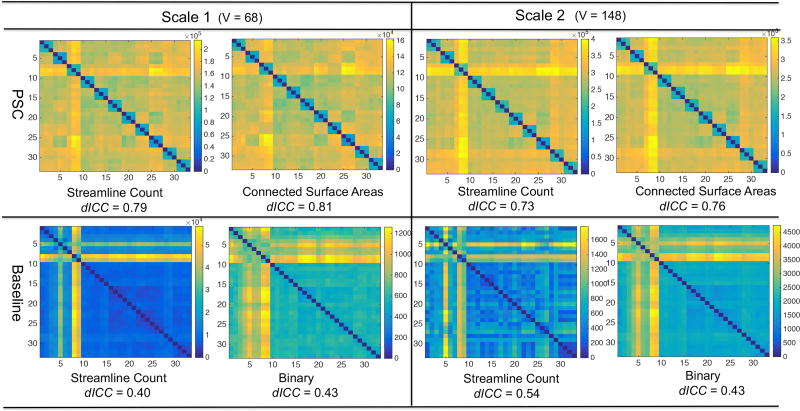
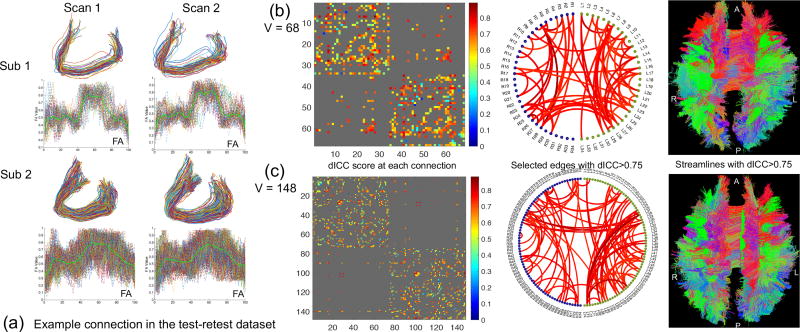
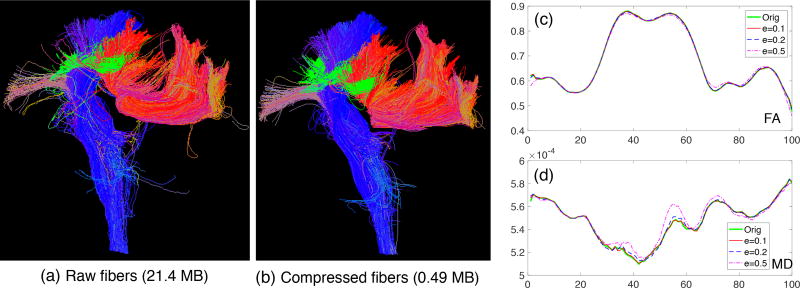
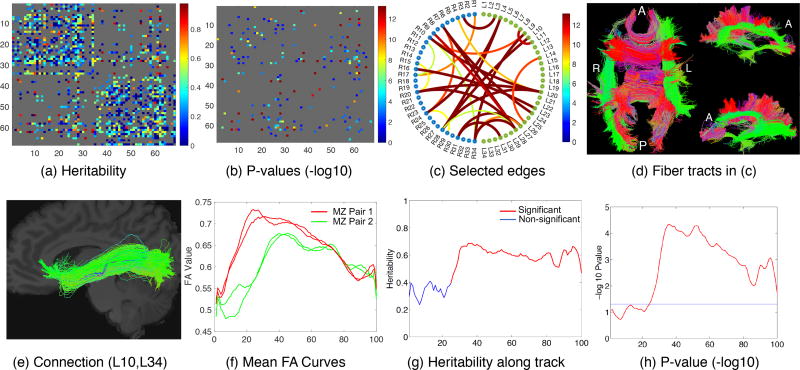
Advances in understanding the structural connectomes of human brain require improved approaches for the construction, comparison and integration of high-dimensional whole-brain tractography data from a large number of individuals. This article develops a population-based structural connectome (PSC) mapping framework to address these challenges. PSC simultaneously characterizes a large number of white matter bundles within and across different subjects by registering different subjects' brains based on coarse cortical parcellations, compressing the bundles of each connection, and extracting novel connection weights. A robust tractography algorithm and streamline post-processing techniques, including dilation of gray matter regions, streamline cutting, and outlier streamline removal are applied to improve the robustness of the extracted structural connectomes. The developed PSC framework can be used to reproducibly extract binary networks, weighted networks and streamline-based brain connectomes. We apply the PSC to Human Connectome Project data to illustrate its application in characterizing normal variations and heritability of structural connectomes in healthy subjects.

Keywords: Brain connectome; Diffusion MRI imaging; Functional principal component analysis; Human connectome project; Population-based structural connectome; Streamline variation decomposition.


Figures

Figure 1
Figure 1
A systematic overview of the population-based structural connectome mapping framework. GM: gray matter, CM: connectivity matrix, ROI: region of interest, SCCS: streamline connectivity cell structure, PTCS: parcellation-based tractography common space, and PSC: population-based structural connectome.
Figure 2
Figure 2
The top row shows the effect of using streamline cutting and dilation. In panels (a) and (b), we show the identified streamlines between two ROIs without streamline cutting and dilation, with only streamline cutting and with both streamline cutting and dilation, respectively, from left to right. The numbers the parentheses represent the number of fiber tracts. The dilated regions are marked in purple in each ROI. The bottom row shows the extracted features in PSC that describe the WM connectivity pattern between any ROI pair: panel (c) is an example of streamlines connecting the right and left paracentral lobules; panels (d)–(f) show different features extracted from the connection.
Figure 3
Figure 3
The remaining shape component after separating different shape-preserving transformations in a simulated example. The first row shows the 3D curves; the second row shows the x, y, z coordinates. C: translation, L: scaling, O: rotation, and γ: re-parameterization.
Figure 4
Figure 4
Examples of extracted brain networks using PSC calculated for a randomly selected HCP subject.
Figure 5
Figure 5
Reproducibility study of the weighted networks. (a) Effect of parameters ψ and Llen on the reproducibility (measured by dICC) of streamline count matrix under the Desikan-Killiany parcellation. (b) Reproducibility score (dICC) of the final PSC extracted weighted networks based on ψ = 2, Llen = 20 and θt = 8 mm. A comparison of PSC with a general weighted network extraction framework is also shown.
Figure 6
Figure 6
Reproducibility study at the binary network level. (a) The leftmost two columns show two binary network matrices from two different scans of the same subject. Column 3 shows the difference between the scans, and column 4 shows the difference between the 1st scan and that from a different subject. (b)–(c) Pairwise distance matrices between 33 binary networks extracted from the test-retest dataset. (d) Relationship between the threshold θbin and the dICC score.
Figure 7
Figure 7
Comparison of PSC with a routine procedure of extracting the connectivity matrices from tractography data. The test-retest dataset is used here. The top row shows the pairwise distance matrices of the streamline count and the CSA matrices produced by PSC. The bottom row shows pairwise distance matrices of the streamline count matrices and the binary network matrices produced by the routine procedure. To compare with the binary networks produced by PSC, readers can refer to Figure 6.
Figure 8
Figure 8
Reproducibility analysis of PSC at the streamline level. (a) Extracted streamlines connecting left and right frontal sulci from two subjects in the test-retest dataset. The FA value along each streamline and the mean FA curves (in solid green) are also plotted; (b) and (c) Reproducibility analysis based on the mean FA curves at the scale V = 68 and V = 148, respectively. In each panel, we show the dICC score matrix, selected edges with the dICC > 0.75, and the streamlines corresponding to the selected edges, from left to right, respectively. A: anterior; P: posterior; R: right; and L: left.
Figure 9
Figure 9
Evaluation of the proposed compression method. (a) Raw streamlines in connections (L28, R28), (L3, R28) and (LS9, R23) in a subject from the HCP dataset, which require 21.4 MB disk space. (b) Reconstructed compressed streamlines from PSC with ‖ε‖ = 0.2 mm which require only 0.49 MB disk space. (c–d) Mean FA and MD curves along the streamlines in (L28, R28) when the streamlines are compressed with different values of ‖ε‖.
Figure 10
Figure 10
The top row illustrates the heritability analysis using the mean FA weighted matrix: (a) Estimated heritability scores for each connection based on the mean FA weighted matrix; (b) P-values of the significant edges (with a threshold of α = 0.05) after Bonferroni correction; (c) Selected significant connections with heritability scores greater than 0.8; (d) Corresponding streamlines in the selected connections in (c). The bottom row illustrates the heritability analysis using mean FA curves along streamlines: (e) Selected connection; (f) Mean FA curves along streamlines in this connection for two pairs of monozygotic twins; (g) Heritability score along the curve; and (h) P-value along the curve. A: anterior; P: posterior; R: right; L: left and MZ: monozygotic.

References

    1. Alexander AL, Lee JE, Lazar M, Boudos R, DuBray MB, Oakes TR, Miller JN, Lu J, Jeong EK, McMahon WM, et al. Diffusion tensor imaging of the corpus callosum in Autism. Neuroimage. 2007;34:61–73. - PubMed
    1. Avants BB, Tustison NJ, Song G, Cook PA, Klein A, Gee JC. A reproducible evaluation of ANTs similarity metric performance in brain image registration. NeuroImage. 2011;54:2033–2044. - PMC - PubMed
    1. Basser PJ, Pajevic S, Pierpaoli C, Duda J, Aldroubi A. In vivo fiber tractography using DT-MRI data. Magnetic Resonance in Medicine. 2000;44:625–632. - PubMed
    1. Bastiani M, Shah NJ, Goebel R, Roebroeck A. Human cortical connectome reconstruction from diffusion weighted MRI: the effect of tractography algorithm. Neuroimage. 2012;62:1732–1749. - PubMed
    1. Buchanan CR, Pernet CR, Gorgolewski KJ, Storkey AJ, Bastin ME. Test–retest reliability of structural brain networks from diffusion MRI. Neuroimage. 2014;86:231–243. - PubMed

Publication types

LinkOut - more resources