. 2018 Feb 1;128(2):861-875.
doi: 10.1172/JCI96218. Epub 2018 Jan 22.

Long noncoding RNA BLACAT2 promotes bladder cancer-associated lymphangiogenesis and lymphatic metastasis

Long noncoding RNA BLACAT2 promotes bladder cancer-associated lymphangiogenesis and lymphatic metastasis

Wang He et al. J Clin Invest. .

Erratum in

Abstract

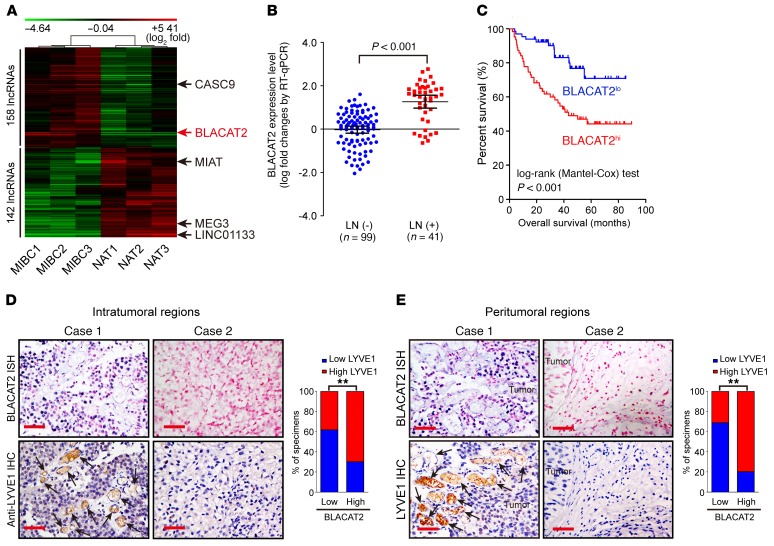
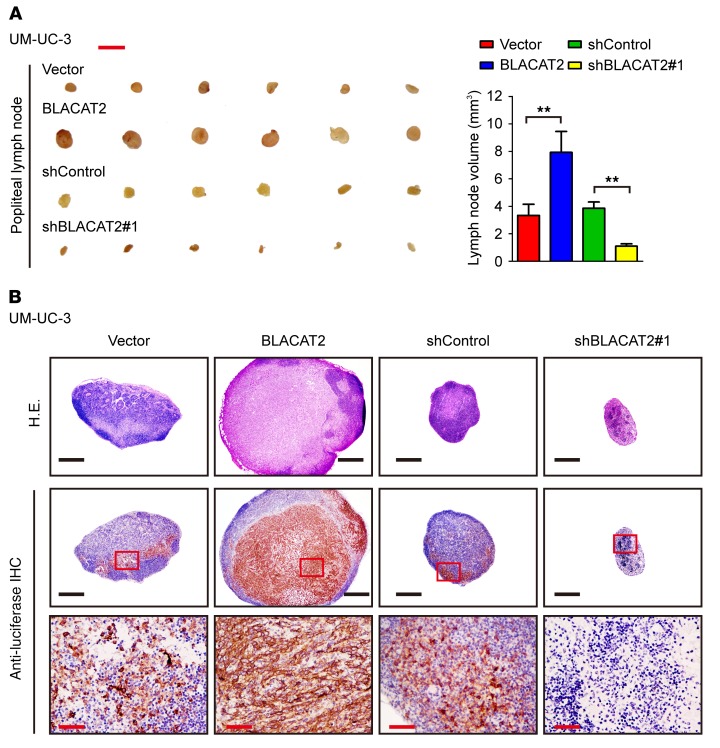
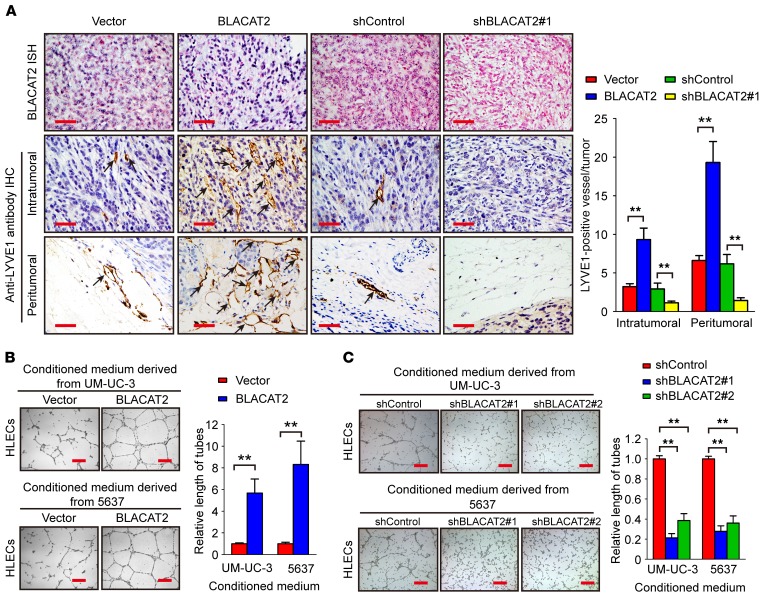
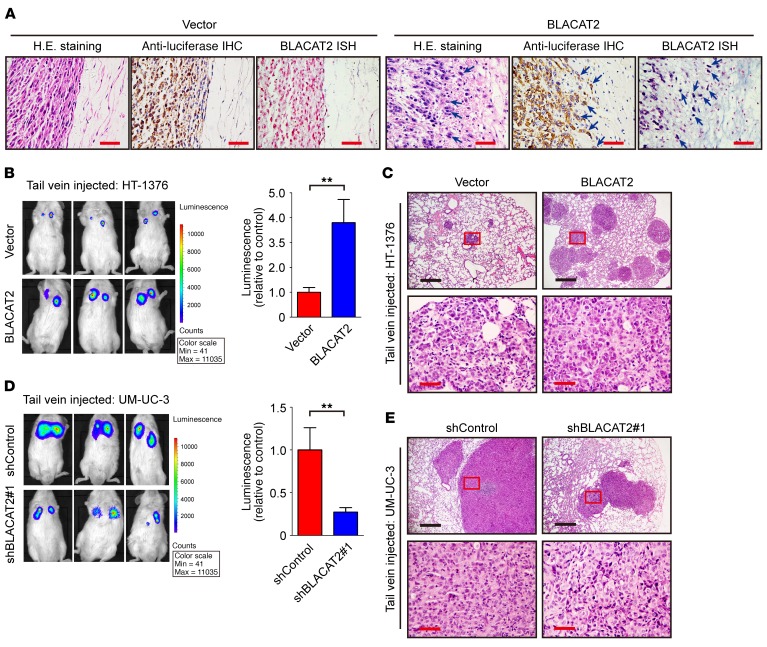
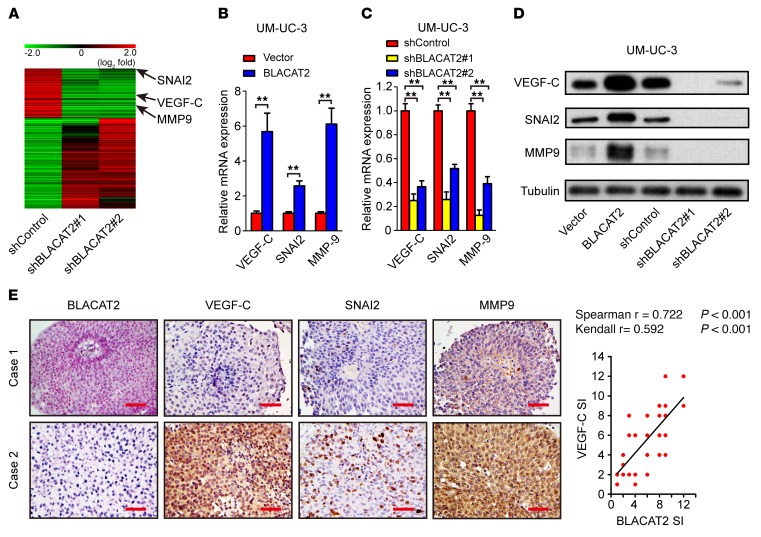
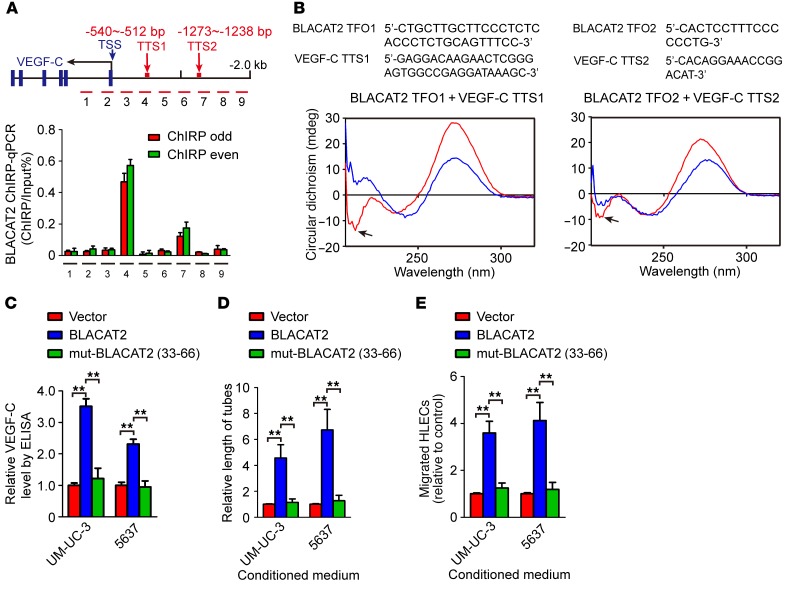
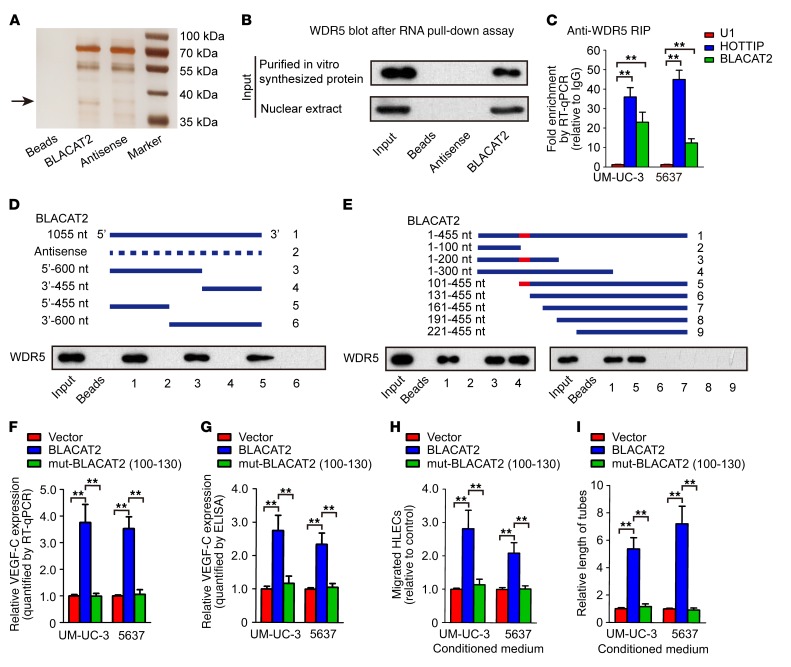
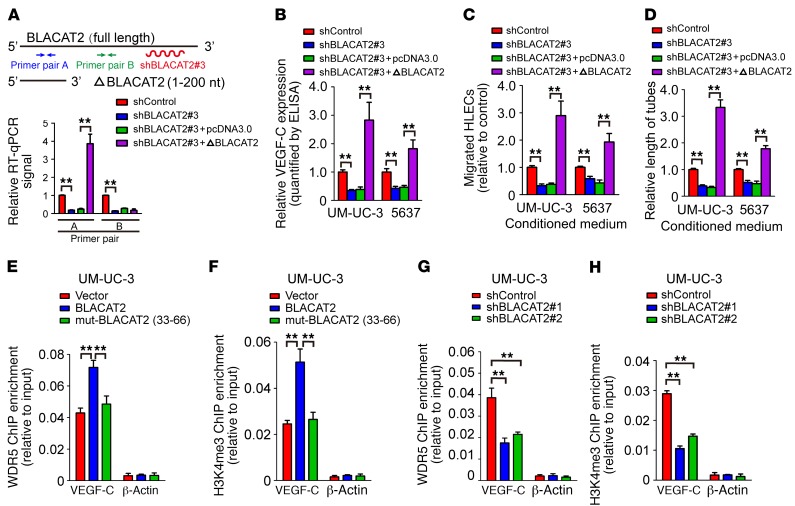
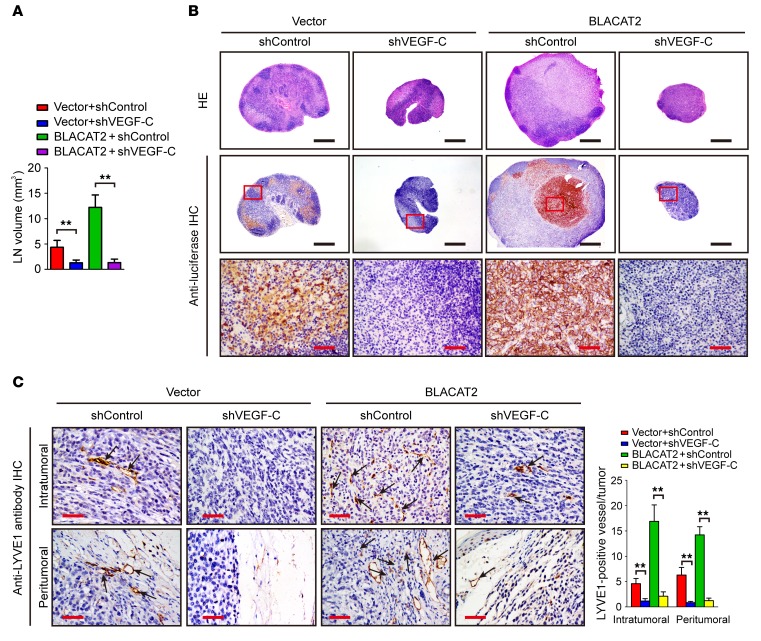
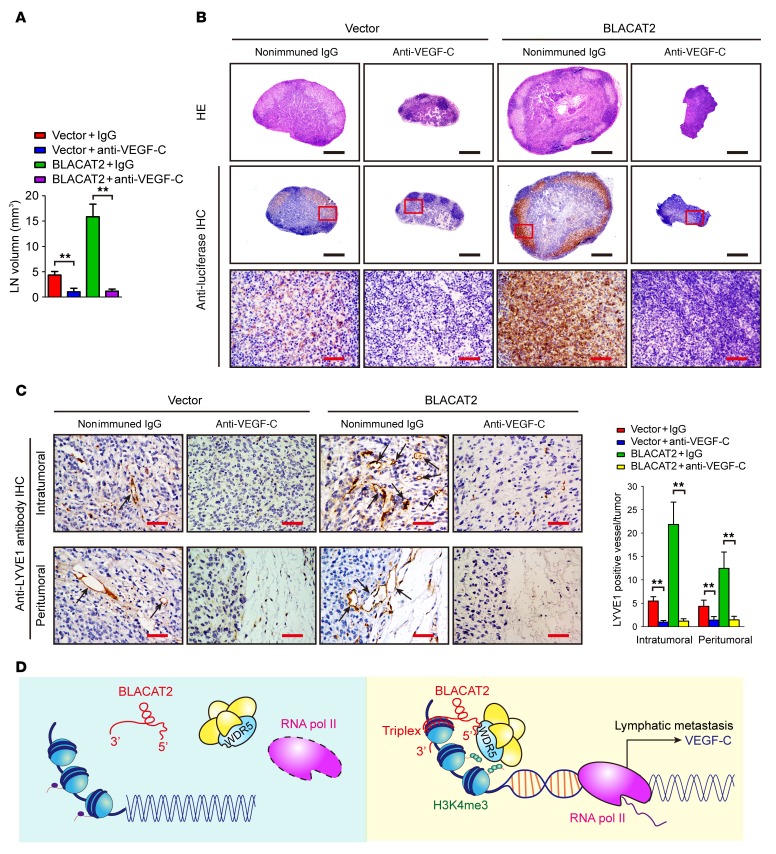
The prognosis for bladder cancer patients with lymph node (LN) metastasis is dismal and only minimally improved by current treatment modalities. Elucidation of the molecular mechanisms that underlie LN metastasis may provide clinical therapeutic strategies for LN-metastatic bladder cancer. Here, we report that a long noncoding RNA LINC00958, which we have termed bladder cancer-associated transcript 2 (BLACAT2), was markedly upregulated in LN-metastatic bladder cancer and correlated with LN metastasis. Overexpression of BLACAT2 promoted bladder cancer-associated lymphangiogenesis and lymphatic metastasis in both cultured bladder cancer cell lines and mouse models. Furthermore, we demonstrate that BLACAT2 epigenetically upregulated VEGF-C expression by directly associating with WDR5, a core subunit of human H3K4 methyltransferase complexes. Importantly, administration of an anti-VEGF-C antibody inhibited LN metastasis in BLACAT2-overexpressing bladder cancer. Taken together, these findings uncover a molecular mechanism in the lymphatic metastasis of bladder cancer and indicate that BLACAT2 may represent a target for clinical intervention in LN-metastatic bladder cancer.

Keywords: Cancer; Oncogenes; Oncology; Urology.


Conflict of interest statement

Conflict of interest: The authors have declared that no conflict of interest exists.

Figures

Figure 1
Figure 1. BLACAT2 overexpression correlates with LN metastasis and poor prognosis of bladder cancer.
(A) Unsupervised hierarchical clustering of lncRNAs that are differentially expressed in MIBC and paired normal adjacent tissues (NAT) (fold changes > 2.0, P < 0.05). The red color scale (log2 fold change) represents a higher expression level, and the green color scale represents a lower expression level. (B) RT-qPCR analysis of BLACAT2 expression in a 140-case cohort of freshly collected human bladder cancer samples with or without LN metastasis. The nonparametric Mann-Whitney U test was used to compare the expression levels of the 2 groups. (C) Negative correlation between BLACAT2 expression and survival in the patient cohort referred to in B. The Kaplan-Meier method was used to estimate survival for the 2 groups. Median BLACAT2 expression was used as a cutoff value. (D and E) Representative images (left panels) and percentages (right panels) of tissue specimens with high and low levels of LYVE1-positive intratumoral (D) and peritumoral (E) microlymphatic vessels in 140 cases of bladder cancer with low or high expression of BLACAT2. BLACAT2 expression levels were quantified by ISH, and microlymphatic vessel density was quantified by immunohistochemistry using the anti-LYVE1 antibody. Two representative cases are shown. Statistical significance was assessed by χ2 test. Scale bars: 50 μm (D and E). **P < 0.01.
Figure 2
Figure 2. BLACAT2 overexpression promotes LN metastasis of bladder cancer cells in vivo.
(A) Representative images of enucleated popliteal LNs (left panel) inoculated with the indicated cells (n = 12 per group) and histogram analysis of the LN volume (right panel). Scale bar: 5 mm. Error bars indicate SD of the mean. Statistical significance was assessed using 2-tailed Student’s t test. **P < 0.01. (B) Representative images of the popliteal LNs analyzed by H&E staining and IHC staining using an anti-luciferase antibody (n = 12 per group). Scale bars: 500 μm (black); 50 μm (red).
Figure 3
Figure 3. BLACAT2 overexpression promotes lymphangiogenesis in vitro and in vivo.
(A) Representative images of intratumoral and peritumoral microlymphatic vessels stained with anti-LYVE1 (left panel) and histogram of the quantification of microlymphatic vessel density (right panel) (n = 12). BLACAT2 expression levels were confirmed by ISH. Scale bars: 50 μm. (B and C) Representative images (left panels) and histogram quantification (right panels) of the Matrigel tube formation assay with HLECs. HLECs were cultured with conditioned medium derived from bladder cancer cells that were treated as indicated. Scale bars: 200 μm. All experiments in vitro were performed with at least 3 biological replicates. The error bars indicate the SD of the mean. Statistical significance was assessed using 2-tailed Student’s t test (A and B) and 1-way ANOVA followed by Dunnett’s tests for multiple comparisons (C). **P < 0.01.
Figure 4
Figure 4. BLACAT2 overexpression promotes bladder cancer cell invasion and metastasis in vivo.
(A) Representative images of H&E staining, IHC staining with antiluciferase, and BLACAT2 ISH staining for visualization of human bladder cancer cells invading surrounding tissues in vivo, as indicated by arrows (n = 12). Scale bars: 50 μm. (BE) Representative images of lung colonization by bladder cancer cells injected into tail veins of NOD/SCID mice (B and D, left panels) and histogram analysis of luminescence representing lung metastasis measured on day 40 (B and D, right panels). n = 12. Lung metastasis was confirmed by H&E staining (C and E). Cells were transduced with vectors as indicated. Scale bars: 200 μm (black); 50 μm (red). Error bars indicate the SD of the mean. Statistical significance was assessed using 2-tailed Student’s t test (B and D). **P < 0.01.
Figure 5
Figure 5. BLACAT2 regulates VEGF-C, SNAI2, and MMP9 expression.
(A) Heatmap representing unsupervised hierarchical clustering of genes regulated by BLACAT2 quantified by NGS. Rows represent probe sets, and columns represent samples treated as indicated. Green, downregulation; red, upregulation. SNAI2, VEGF-C, and MMP9 are indicated by black arrows. (B and C) Bladder cancer cells were transduced with a lentivirus-based BLACAT2-overexpressing vector (B), BLACAT2 shRNAs (C), or control vectors as indicated. Transduced cells were harvested 96 hours later, and VEGF-C, SNAI2, and MMP9 mRNA expression levels were quantified by RT-qPCR. Statistical significance was assessed using 2-tailed Student’s t test (B) and 1-way ANOVA followed by Dunnett’s tests for multiple comparisons (C) (n = 3, **P < 0.01). (D) Representative image of the Western blotting analysis of VEGF-C, SNAI2, and MMP9 protein levels after BLACAT2 overexpression or depletion in UM-UC-3. (E) Representative images (left panels) and correlation analysis (right panel) of IHC staining showing that BLACAT2 expression positively correlates with VEGF-C, SNAI2, and MMP9 expression levels in the bladder cancer tissues. n = 140. Scale bars: 50 μm.
Figure 6
Figure 6. BLACAT2 directly binds to VEGF-C promoter sequences.
(A) ChIRP analysis of BLACAT2-associated chromatin in UM-UC-3 cells. Retrieved chromatin was quantified by PCR. The percentage recovery of input for ChIRP was calculated based on a 10% nonprecipitated DNA sample for each experiment. The blue arrow indicates the transcriptional start site (TSS). The red arrows indicate the location of transcriptional start sites. (B) CD spectrum of a 1:1 mixture of TFO in BLACAT2 with TTS in the VEGF-C promoter sequences is shown in red. The sum of individual TFO and TTS is shown in blue. (C) Site-directed mutagenesis of 33–66 nt in BLACAT2 was performed, and the effect of overexpression of the wild-type or mutated BLACAT2 on VEGF-C secretion was evaluated by ELISA. (D and E) The effects of overexpression of wild-type or mutated BLACAT2 on tube formation (D) and migration of HLECs (E) were evaluated. All experiments were performed with at least 3 biological replicates. Statistical significance was assessed using 1-way ANOVA followed by Dunnett’s tests for multiple comparisons (CE). **P < 0.01.
Figure 7
Figure 7. BLACAT2 directly binds to WDR5 protein and regulates VEGF-C expression.
(A) Representative image of silver-stained PAGE gels showing separated proteins that were pulled down using biotin-labeled BLACAT2. In vitro–transcribed antisense sequence of BLACAT2 was used as the nonspecific control. (B) Western blot analysis indicating that BLACAT2 associates with WDR5, as indicated by the pull-down assay with nuclear extracts or in vitro–synthesized WDR5. Antisense BLACAT2 was used as the negative control RNA in the pull-down assay. (C) RT-qPCR analysis of RNA enrichment in the RIP assay using the anti-WDR5 antibody in UM-UC-3 and 5637 bladder cancer cells. Normal IgG was used as the nonspecific control antibody. U1 and HOTTIP were used as negative and positive controls, respectively, for WDR5 binding. (D and E) Serial deletions of BLACAT2 were used in RNA pull-down assays to identify core regions of BLACAT2 that were required for physical interaction with WDR5. (FI) Site-directed mutagenesis of 100–130 nt of BLACAT2 was performed, and the effects of BLACAT2 mutant overexpression on VEGF-C mRNA expression (F), VEGF-C secretion (G), HLEC migration (H), and HLEC tube formation (I) were evaluated. All experiments were performed with at least 3 biological replicates. Statistical significance was assessed using 1-way ANOVA followed by Dunnett’s tests for multiple comparisons (C, FI). **P < 0.01.
Figure 8
Figure 8. BLACAT2 recruits WDR5 protein and modulates H3K4 trimethylation of VEGF-C promoter.
(A) Endogenous BLACAT2 was depleted with an shRNA that targeted the 3′ terminal site, and the efficiency of forced expression of the truncated BLACAT2 (1–200 nt) was examined by RT-qPCR. (BD) The effects of truncated BLACAT2 on VEGF-C secretion (B), HLEC migration (C), and HLEC tube formation (D) were evaluated. (EH) ChIP-qPCR analysis of the WDR5 genomic occupancy (E and G) and H3K4 methylation status (F and H) in the VEGF-C promoter after overexpression (E and F) or depletion (G and H) of BLACAT2 in UM-UC-3 cells as indicated. All experiments were performed with at least 3 biological replicates. Error bars indicate SD of the mean. Statistical significance was assessed using 2-tailed Student’s t test (BD) and 1-way ANOVA followed by Dunnett’s tests for multiple comparisons (E and H). **P < 0.01.
Figure 9
Figure 9. Depletion of VEGF-C abrogates BLACAT2-induced LN metastasis in vivo.
(A) Volume quantification of popliteal LN metastasis after shRNA-mediated depletion of VEGF-C. Popliteal LNs were enucleated and analyzed at the time of death or after 60 days (n = 12 per group). (B) Representative images of H&E staining and IHC staining confirming LN status (n = 12). Scale bars: 500 μm (black); 50 μm (red). (C) Representative images of intratumoral and peritumoral microlymphatic vessels stained with anti-LYVE1 (left panel, as indicated with black arrows) and histogram quantification of microlymphatic vessel density (right panel). Error bars represent SD of the mean. **P < 0.01, Student’s t test (A and C). Scale bars: 50 μm.
Figure 10
Figure 10. Inhibition of VEGF-C with neutralizing antibody abrogates BLACAT2-induced LN metastasis in vivo.
(A) Volume quantification (right panel) of popliteal LN metastasis after inhibition of VEGF-C with neutralizing antibody. Popliteal LNs were enucleated and analyzed at the time of death or after 60 days (n = 12 per group). (B) Representative images of H&E staining and IHC staining confirming LN status (n = 12). Scale bars: 500 μm (black); 50 μm (red). (C) Representative images (left panel) of IHC staining evaluating microlymphatic vessel density with anti-LYVE1 (left panels, as indicated with black arrows) and histogram analysis (right panel) of primary tumors from the footpads of nude mice. Scale bars: 50 μm. Error bars represent SD of the mean, **P < 0.01, Student’s t test (A and C). (D) Proposed model of the role of BLACAT2 in LN metastasis of bladder cancer.

References

    1. Torre LA, Bray F, Siegel RL, Ferlay J, Lortet-Tieulent J, Jemal A. Global cancer statistics, 2012. CA Cancer J Clin. 2015;65(2):87–108. doi: 10.3322/caac.21262. - DOI - PubMed
    1. Wu XR. Urothelial tumorigenesis: a tale of divergent pathways. Nat Rev Cancer. 2005;5(9):713–725. doi: 10.1038/nrc1697. - DOI - PubMed
    1. Hautmann RE, de Petriconi RC, Pfeiffer C, Volkmer BG. Radical cystectomy for urothelial carcinoma of the bladder without neoadjuvant or adjuvant therapy: long-term results in 1100 patients. Eur Urol. 2012;61(5):1039–1047. doi: 10.1016/j.eururo.2012.02.028. - DOI - PubMed
    1. Fajkovic H, et al. Extranodal extension is a powerful prognostic factor in bladder cancer patients with lymph node metastasis. Eur Urol. 2013;64(5):837–845. doi: 10.1016/j.eururo.2012.07.026. - DOI - PubMed
    1. Zargar-Shoshtari K, et al. A multi-institutional analysis of outcomes of patients with clinically node positive urothelial bladder cancer treated with induction chemotherapy and radical cystectomy. J Urol. 2016;195(1):53–59. doi: 10.1016/j.juro.2015.07.085. - DOI - PubMed

Publication types

MeSH terms

Substances