. 2018 Feb 1;128(2):789-804.
doi: 10.1172/JCI94516. Epub 2018 Jan 22.

JAK2/IDH-mutant-driven myeloproliferative neoplasm is sensitive to combined targeted inhibition

Affiliations

JAK2/IDH-mutant-driven myeloproliferative neoplasm is sensitive to combined targeted inhibition

Anna Sophia McKenney et al. J Clin Invest. .

Erratum in

  • JAK2/IDH-mutant-driven myeloproliferative neoplasm is sensitive to combined targeted inhibition.
    McKenney AS, Lau AN, Somasundara AVH, Spitzer B, Intlekofer AM, Ahn J, Shank K, Rapaport FT, Patel MA, Papalexi E, Shih AH, Chiu A, Freinkman E, Akbay EA, Steadman M, Nagaraja R, Yen K, Teruya-Feldstein J, Wong KK, Rampal R, Vander Heiden MG, Thompson CB, Levine RL. McKenney AS, et al. J Clin Invest. 2018 Oct 1;128(10):4743. doi: 10.1172/JCI124920. Epub 2018 Sep 17. J Clin Invest. 2018. PMID: 30222137 Free PMC article. No abstract available.

Abstract

Patients with myeloproliferative neoplasms (MPNs) frequently progress to bone marrow failure or acute myeloid leukemia (AML), and mutations in epigenetic regulators such as the metabolic enzyme isocitrate dehydrogenase (IDH) are associated with poor outcomes. Here, we showed that combined expression of Jak2V617F and mutant IDH1R132H or Idh2R140Q induces MPN progression, alters stem/progenitor cell function, and impairs differentiation in mice. Jak2V617F Idh2R140Q-mutant MPNs were sensitive to small-molecule inhibition of IDH. Combined inhibition of JAK2 and IDH2 normalized the stem and progenitor cell compartments in the murine model and reduced disease burden to a greater extent than was seen with JAK inhibition alone. In addition, combined JAK2 and IDH2 inhibitor treatment also reversed aberrant gene expression in MPN stem cells and reversed the metabolite perturbations induced by concurrent JAK2 and IDH2 mutations. Combined JAK2 and IDH2 inhibitor therapy also showed cooperative efficacy in cells from MPN patients with both JAK2mut and IDH2mut mutations. Taken together, these data suggest that combined JAK and IDH inhibition may offer a therapeutic advantage in this high-risk MPN subtype.

Keywords: Drug therapy; Hematology; Leukemias; Oncology.


Conflict of interest statement

Conflict of interest: M.G. Vander Heiden is a consultant to and scientific advisory board member of Agios Pharmaceuticals. M. Steadman, K. Yen, and R. Nagaraja are employees of Agios Pharmaceuticals. R.L. Levine has received research support from and served as a consultant to Celgene and is on the Supervisory Board of QIAGEN.

Figures

Figure 1
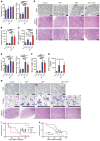
Figure 1. Combined Jak2/IDH-mutant mice have lethal MPN with preleukemic features.
(A) Hematocrit levels and leukocyte counts in peripheral blood, (B) spleen weights, (C) 2HG levels in plasma, and (D) representative histology images for CD34 immunohistochemical stains of bone marrow and H&E stains of splenic tissue from primary IDH1R132H Jak2V617F Mx1-Cre mice sacrificed at approximately 6 months of age (n = 5/group). (E) Hematocrit levels and leukocyte counts in peripheral blood, (F) spleen weights, (G) 2HG levels in plasma, and (H) representative histology images for CD34 immunohistochemical stains of bone marrow, Wright-Giemsa stains of bone marrow cytospins, and H&E stains of splenic tissue from primary Idh2R140Q Jak2V617F Mx1-Cre mice sacrificed at approximately 6 months of age (n = 4–5/group). (I) Kaplan-Meier survival curve for primary IDH1R132H Jak2V617F Mx1-Cre mice following recombination. (J) Kaplan-Meier survival curve for secondary-transplant mice following injection of IDH1R132H Jak2V617F Mx1-Cre bone marrow. Scale bars: 200 μm. Multiple comparisons were performed using an ordinary 1-way ANOVA with Tukey’s correction for post-hoc comparisons and multiplicity-corrected P values. Comparisons of survival were performed using the log-rank (Mantel-Cox) test. Statistical interaction calculated for influence of Jak2 mutation status and IDH1 mutation status combined using 2-way ANOVA. *P < 0.05, **P < 0.01, ***P < 0.001, and ****P < 0.0001 by 2-way ANOVA. JAKmt, JAK-mutant; IDHmt, IDH-mutant; JAKmt/IDHmt, JAK/IDH-mutant.
Figure 2
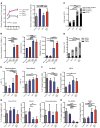
Figure 2. Combined mutant mice have expanded pathological stem and progenitor cell populations.
(A) Peripheral blood donor chimerism of competitive transplants with Idh2R140Q Jak2V617F bone marrow over time (n = 5/group) and at 12 weeks (n = 5–50/group). (B) Peripheral blood chimerism, hematocrit levels, and platelet counts in recipients of bone marrow sorted for MPP or LT-HSC LSK populations, 15 weeks after injection (n = 5/group). (C) Total number of LSK cells and (D) total number of myeloprogenitor cells in bone marrow from primary Idh2R140Q Jak2V617F mice and controls according to stem cell/progenitor compartment as measured by FACS (n = 4–5/group). (E) Stem cell populations as measured by FACS in peripheral blood and bone marrow from primary Idh2R140Q Jak2V617F mice, expressed as a percentage of lineage-negative cells. (F) MkP cell populations, (G) erythrocytic progenitor cell populations, and (H) granulocytic progenitor cell populations as measured by FACS in bone marrow from primary Idh2R140Q Jak2V617F mice, expressed as a proportion of lineage-negative cells (n = 4–5/group). Multiple comparisons were performed using an ordinary 1-way ANOVA with Tukey’s correction for post-hoc comparisons and multiplicity-corrected P values. *P < 0.05, **P < 0.01, ***P < 0.001, and ****P < 0.0001.
Figure 3
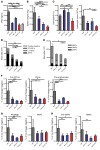
Figure 3. Treatment of combined mutant mice results in the resolution of disease phenotype.
(AH) Disease phenotype in transplant recipients of Idh2R140Q Jak2V617F bone marrow treated with targeted inhibitors at sacrifice after 4 weeks of treatment (n = 7–10/group). (A) 2HG levels in plasma, (B) spleen weights, (C) hematocrit levels and leukocyte counts, (D) total LSK cells classified by compartment, (E) total myeloprogenitors classified by compartment, (F) erythrocytic progenitors, (G) MkPs, and (H) granulocytic progenitors as measured by FACS. Multiple comparisons were performed using an ordinary 1-way ANOVA with Tukey’s correction for post-hoc comparisons and multiplicity-corrected P values. Paired t tests were used to determine 2-tailed significance for comparison of results in mice before and after treatment. *P < 0.05, **P < 0.01, ***P < 0.001, and ****P < 0.0001. Comb, combined; inh, inhibitor; Veh, vehicle.
Figure 4
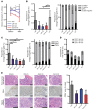
Figure 4. Treatment of combined mutant mice results in reduced disease chimerism.
(A) Paired evaluation of donor chimerism in peripheral blood of Idh2R140Q Jak2V617F bone marrow recipients before and after treatment with targeted inhibitors for 4 weeks (n = 7/group). (BD) Stem cell phenotype within the donor (CD45.2+) compartment of Idh2R140Q Jak2V617F bone marrow recipients treated with targeted inhibitors (n = 10/group). (B) Total LSK compartments expressed as a proportion of the total lineage-negative gate and as proportions of LSK subcompartments. (C) Total myeloid progenitors expressed as a proportion of the total lineage-negative gate and as proportions of LSK subcompartments. (D) Erythroid progenitors expressed as proportions of early-, middle-, and late-maturity cells. (E) Representative images of bone marrow morphology with dilatations, CD34 immunohistochemical staining in the bone marrow with digital quantification of staining (graph), and splenic cell/blast morphology in Idh2R140Q Jak2V617F bone marrow recipients treated with targeted inhibitors. Scale bars: 200 μm. Multiple comparisons were performed using an ordinary 1-way ANOVA with Tukey’s correction for post-hoc comparisons and multiplicity-corrected P values. Paired t tests were used to determine 2-tailed significance for comparison of results in mice before and after treatment. *P < 0.05, and **P < 0.01.
Figure 5
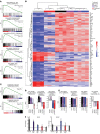
Figure 5. Expression in donor-derived (CD45.2+) LSK cells by RNA-seq defines the gene set of combined mutant disease, and treatment eradicates this expression profile.
(AE) RNA-seq analysis of donor derived (CD45.2+) LSK cells in Idh2R140Q Jak2V617F bone marrow recipients treated with targeted inhibitors (n = 3/group). (A) Significantly enriched Hallmark GSEA in comparative expression patterns comparing vehicle/diseased mice to WT. (B) Clustering of all treated mice depicting comparative phylogeny of samples and relative expression of the 100 most significantly differentially expressed genes. (C) Examination of genes differentially expressed between combined treatment mice and vehicle-treated mice using a gene set defined according to genes differentially expressed between WT and vehicle-treated mice. (D and E) Calculated normalized enrichment score (NES) values (y axis) and FDR (x axis) of curated Hallmark GSEA showing the level and significance of enrichment in each treatment group compared with WT examined for enrichment in curated Hallmark GSEA lists related to JAK/STAT signaling. Statistically significantly non-zero NES values are depicted in bright colors, while nonstatistically significant NES values are depicted in pastel colors. (D) Hallmark GSEA highlighting several pathways related to JAK/STAT signaling and (E) several oncogenic pathways. (F) Quantitative PCR for Gata1 and Gata2 expression performed on sorted MEPs from drug-treated mice. See Methods for details on the statistical methods used for the bioinformatics analysis in A and C. Multiple comparisons were performed using an ordinary 1-way ANOVA with Tukey’s correction for post-hoc comparisons and multiplicity-corrected P values. *P < 0.05.
Figure 6
Figure 6. Treatment of combined mutant bone marrow with combined inhibitors perturbs pools of metabolic products.
(AC) MS analysis of metabolites from whole–bone marrow aspirate cells from treated and WT mice, normalized to leucine levels. (A) 2HG levels, (B) citrate, α-ketoglutarate, succinate, fumarate, and malate levels, and (C) glutamate and glutamine levels. Multiple comparisons were performed using an ordinary 1-way ANOVA with Tukey’s correction for post-hoc comparisons and multiplicity-corrected P values. *P < 0.05, **P < 0.01 and ****P < 0.0001.
Figure 7
Figure 7. Human IDH2R140Q JAK2V617F MPN and AML samples in methylcellulose respond to IDH inhibitor therapy with a differentiation phenotype by morphology.
(A) Colony counts of cultured cells classified by colony morphology including GM and BFU-E colonies. Multiple comparisons were performed using an ordinary 1-way ANOVA, using Tukey’s correction for post-hoc comparisons and multiplicity-corrected P values. *P < 0.05, **P < 0.01, ***P < 0.001, and ****P < 0.0001 by 2-way ANOVA. (B) Representative images of colonies taken during culturing of cells from MPN patient 71. Magnification ×4. Expression levels of cell-surface markers on cultured cells after therapy as measured by mean fluorescence intensity (MFI) using FACS antibodies: (C) CD117, (D) CD235a, (E) CD14.
Figure 8
Figure 8. Human IDH2R140Q JAK2V617F MPN and AML samples in methylcellulose respond to IDH inhibitor therapy with a differentiation phenotype by cell-surface marker measurement.
(AC) Expression levels of cell-surface markers on cultured cells after therapy as measured by mean fluorescence intensity (MFI) using the following FACS antibodies: (A) CD117, (B) CD235a, and (C) CD14. Multiple comparisons were performed using an ordinary 1-way ANOVA with Tukey’s correction for post-hoc comparisons and multiplicity-corrected P values. *P < 0.05, **P < 0.01, and ***P < 0.001. P value in A obtained by 2-way ANOVA.

Similar articles

Cited by

References

    1. Mesa RA, Li CY, Ketterling RP, Schroeder GS, Knudson RA, Tefferi A. Leukemic transformation in myelofibrosis with myeloid metaplasia: a single-institution experience with 91 cases. Blood. 2005;105(3):973–977. - PubMed
    1. Passamonti F, et al. Leukemic transformation of polycythemia vera: a single center study of 23 patients. Cancer. 2005;104(5):1032–1036. doi: 10.1002/cncr.21297. - DOI - PubMed
    1. Gangat N, Strand J, Li CY, Wu W, Pardanani A, Tefferi A. Leucocytosis in polycythaemia vera predicts both inferior survival and leukaemic transformation. Br J Haematol. 2007;138(3):354–358. doi: 10.1111/j.1365-2141.2007.06674.x. - DOI - PubMed
    1. Abdulkarim K, et al. AML transformation in 56 patients with Ph- MPD in two well defined populations. Eur J Haematol. 2009;82(2):106–111. doi: 10.1111/j.1600-0609.2008.01163.x. - DOI - PubMed
    1. Levine RL, et al. Activating mutation in the tyrosine kinase JAK2 in polycythemia vera, essential thrombocythemia, and myeloid metaplasia with myelofibrosis. Cancer Cell. 2005;7(4):387–397. doi: 10.1016/j.ccr.2005.03.023. - DOI - PubMed

Publication types

MeSH terms