. 2018 Feb 1;128(2):876-889.
doi: 10.1172/JCI97555. Epub 2018 Jan 22.

Latent HIV reservoirs exhibit inherent resistance to elimination by CD8+ T cells

Affiliations

Latent HIV reservoirs exhibit inherent resistance to elimination by CD8+ T cells

Szu-Han Huang et al. J Clin Invest. .

Abstract

The presence of persistent, latent HIV reservoirs in CD4+ T cells obstructs current efforts to cure infection. The so-called kick-and-kill paradigm proposes to purge these reservoirs by combining latency-reversing agents with immune effectors such as cytotoxic T lymphocytes. Support for this approach is largely based on success in latency models, which do not fully reflect the makeup of latent reservoirs in individuals on long-term antiretroviral therapy (ART). Recent studies have shown that CD8+ T cells have the potential to recognize defective proviruses, which comprise the vast majority of all infected cells, and that the proviral landscape can be shaped over time due to in vivo clonal expansion of infected CD4+ T cells. Here, we have shown that treating CD4+ T cells from ART-treated individuals with combinations of potent latency-reversing agents and autologous CD8+ T cells consistently reduced cell-associated HIV DNA, but failed to deplete replication-competent virus. These CD8+ T cells recognized and potently eliminated CD4+ T cells that were newly infected with autologous reservoir virus, ruling out a role for both immune escape and CD8+ T cell dysfunction. Thus, our results suggest that cells harboring replication-competent HIV possess an inherent resistance to CD8+ T cells that may need to be addressed to cure infection.

Keywords: AIDS/HIV; Drug therapy; Immunology; T cells.


Conflict of interest statement

Conflict of interest: H. Wong and E. Jeng are employees of Altor Bioscience Corporation, which manufactures ALT-803, the IL-15 superagonist used in this study.

Figures

Figure 1
Figure 1. HIV eradication (HIVE) assays.
(A) Schematic of the HIVE assay. (B) Comparison of the 10 HIVE assays in this study, between either untreated or LRA-only levels of HIV DNA, with levels after treatment with LRA + CD8+ T cells. (C) Comparison of the same 10 HIVE assays in this study between both untreated and LRA-only IUPMs, with those after treatment with LRA + CD8+ T cells.
Figure 2
Figure 2. Ex vivo CD8+ T cells in combination with IL-15SA, Pam3CSK4, or bryostatin, drive reductions in HIV DNA but not intact-inducible HIV reservoirs.
(A) CD8+ T cells from participant OM5334, treated during acute/early infection, were cultured in a HIVE assay with IL-15SA or Pam3CSK4, as indicated. ddPCR results show the mean ± SD, with P values calculated by 1-way ANOVA with Tukey’s multiple comparison tests. (B) CD4+ T cells isolated from HIVE assay were injected into 3 NSG mice per condition. Shown are the mean ± SEM viral loads, indicating no significant differences in time to viral rebound. (C) ddPCR results for participant OM5011, treated during chronic infection. Treatment with CD8+ T cells + IL-15SA in this HIVE assay resulted in significant decreases in HIV DNA (P = 0.05). (D) QVOA results from the HIVE assay in C, showing estimated IUPM ± 95% CIs. (E) CD8+ T cells from participant CIRC0311, treated during chronic infection, were expanded following HIV peptide stimulation, then used in HIVE assays with IL-15SA or bryostatin; treatment with LRA + CD8+ T cells led to significant decreases in HIV DNA for both IL-15SA and bryostatin (P < 0.05). (F) QVOA from CD4+ T cells purified from the CIRC0311 HIVE assay shows no decrease in IUPM between LRA-only and LRA + CD8+ T cells conditions. NS, not significant.
Figure 3
Figure 3. Combinations of a CD8+ T cell clone with IL-15SA and Pam3CSK4 reduces HIV DNA but fails to reduce intact-inducible HIV reservoirs.
(A) CD8+ T cell clones degranulate in response to cognate peptide (HA9) recognition, as measured by CD107a staining. (B) HIV-specific CD8+ T cell clones efficiently eliminate HIV JR-CSF–infected autologous CD4+ T cells, while CMV-specific CD8+ T cell clones do not. (C) ddPCR results showing the mean ± SD from CD4+ T cells cocultured with autologous HIV-Gag-HA9-specific CD8+ T cell clones (left panel), or CMV-pp65-specific (right panel) CD8+ T cell clones, along with the indicated combinations of IL-15SA and Pam3CSK4 in HIVE assays. P values were calculated by 1-way ANOVA with Tukey’s multiple comparison test. (D) p24 ELISA concentrations in QVOA wells following the HIVE assay. No statistically significant differences were observed. (E) Schematic of a CD8+ T cell biosensor assay to determine whether CD8+ T cell clones recognize HIV from positive wells of the QVOA. (F) CD8+ T cell biosensor assay demonstrates that virus from positive-outgrowth-well supernatants (sups) of the HIV-Gag-specific CD8+ T cell–treated and CMV-specific CD8+ T cell–treated conditions are equally well recognized by the HIV-Gag-specific CD8+ T cell clone HA9, ruling out CD8+ T cell escape in this assay.
Figure 4
Figure 4. Combinations of HIV-specific CD8+ T cells with bryostatin (bryo) drive reductions in cell-associated HIV DNA without reducing the intact-inducible reservoir.
(A) ddPCR results from a HIVE assay showing the mean ± SD. (B) QVOA analysis of CD4+ T cells, post-HIVE, show IUPM ± 95% CIs. (C) Higher-resolution QVOA results of a second HIVE assay using CD4+ T cells from the same donor but a different time point. (D) Schematic of CD8+ T cell killing assay: autologous reservoir virus from positive wells of the QVOA was used to infect activated CD4+ T cells from participant OM5011. Gag-specific CD8+ T cell clones were added to the culture to test their ability to eliminate infected cells. (E) Flow cytometry plot of CD8+ T cell killing assay indicating that the Gag-specific CD8+ T cell clone is able to efficiently kill CD4+ T cells infected with HIV from outgrowth assays. (F) HIV-Gag– and Nef-specific CD8+ T cell clones degranulate (CD107a+) in response to treatment with cognate peptides. (G) ddPCR results (mean ± SD) from a HIVE assay using bryostatin with either a Nef-RA9-specific CD8+ T cell, Nef-AL9-specific CD8+ T cell, or Gag-IK9-specific CD8+ T cell. (H) QVOA analysis of CD4+ T cells, post-HIVE, show IUPM ± 95% CIs. (I) Sequencing of viral RNA from supernatants of QVOA wells. Red = escape variants, green = nonescape variants as confirmed by degranulation assays with the CD8+ T cell clone. (J) Results from CD8+ T cell biosensor assay (as described above) using virus from supernatants (sups) of positive QVOA wells of the HIVE assay, treated with bryostatin + Gag-IK9-specific CD8+ T cells, show strong recognition of autologous reservoir virus by the Gag-IK9 CD8+ T cell. P values were calculated by 1-way ANOVA with Tukey’s multiple comparison test.
Figure 5
Figure 5. Combinations of HIV-specific CD8+ T cells with PMA/ionomycin (PMA/Iono.), an LRA + Ab cocktail, or anti–CD3/CD28 antibodies drive reductions in HIV DNA without depleting the intact-inducible reservoir.
(A) ddPCR results from HIVE assay showing mean ± SD. Treatment with PMA/I + CD8+ T cells significantly depleted HIV DNA (P < 0.0001). (B) Levels of cell-free viral RNA from culture supernatant of the HIVE assay in A, as measured by qRT-PCR, normalized to an RNA standard. (C) QVOA analysis of CD4+ T cells, post-HIVE (corresponding to A), shows no significant changes in IUPM. All QVOAs show IUPM estimates ± 95% CIs. (D and E) CD4+ T cells from participant OM5011 were treated with a LRA + Ab cocktail of bryostatin, vorinostat, JQ1, anti-PD1, and anti-hTIM3. (D) ddPCR results showing mean ± SD. A trend towards an increase in HIV DNA is observed when treating with the LRA + Ab cocktail; HIV DNA is significantly depleted from these levels when CD8+ T cells are added to the LRA + Ab cocktail. (E) QVOA analysis corresponding to D shows no significant decreases in IUPM (LRA + Ab vs. LRA + Ab + CD8+ T cell, P = 0.1). (F) ddPCR results from a HIVE assay using anti–CD3/CD28 antibodies shows mean ± SD. (G) QVOA analysis corresponding to F shows no significant decreases in IUPM. (H) Cells treated with PMA/I, the LRA + Ab cocktail, or anti–CD3/CD28 show high levels of activation (%CD69+) compared with untreated cells. P values were calculated by 1-way ANOVA with Tukey’s multiple comparison test.
Figure 6
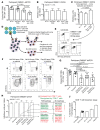
Figure 6. Characterization of HIV proviruses remaining after HIVE assay.
Full-length single HIV genome amplifications (limiting dilution) were performed using the same DNA samples quantified in Figure 2C, using a previously described method (31). First-round PCRs were performed at limiting dilution and PCR reactions containing viral genomes were identified by nested PCR with gag primers (not shown). Each of these wells was then subjected to nested PCR over 4 overlapping regions, labeled A–D. (A) Shown are representative amplification products from 2 defective proviruses. Provirus 1 shows an intact region D, but a deletion affecting regions A–C. Provirus 2 does not show an intact amplicon for any of the 4 regions. (B) Table summarizing the results of whole-genome characterizations. Of the 32 genomes characterized, none exhibited full-length products for all 4 amplicons. (C) Shown are resulting amplicons from primer pair A for a number of single HIV proviruses taken from each of the treatment conditions. DNA amplicons from the IL-15SA + CD8+ T cell condition were enriched for gross deletions as compared with other conditions — correct product sizes are indicated by the red line (P values calculated by χ2 test). (D) The products shown in C were sequenced and are shown aligned to the HIV reference genome. The ex vivo CD8+ T cells used in this HIVE assay have 2 immunodominant responses targeting HA9 and AK11 epitopes. Dashed lines indicate the positions of these epitopes in the viral genome. Proviral genomes that remain, following treatment with IL-15SA + CD8+ T cells, are significantly enriched for deletions spanning CD8+ T cell epitopes.

Similar articles

Cited by

References

    1. Chun TW, et al. Presence of an inducible HIV-1 latent reservoir during highly active antiretroviral therapy. Proc Natl Acad Sci U S A. 1997;94(24):13193–13197. doi: 10.1073/pnas.94.24.13193. - DOI - PMC - PubMed
    1. Finzi D, et al. Identification of a reservoir for HIV-1 in patients on highly active antiretroviral therapy. Science. 1997;278(5341):1295–1300. doi: 10.1126/science.278.5341.1295. - DOI - PubMed
    1. Wong JK, et al. Recovery of replication-competent HIV despite prolonged suppression of plasma viremia. Science. 1997;278(5341):1291–1295. doi: 10.1126/science.278.5341.1291. - DOI - PubMed
    1. Deeks SG. HIV infection, inflammation, immunosenescence, and aging. Annu Rev Med. 2011;62:141–155. doi: 10.1146/annurev-med-042909-093756. - DOI - PMC - PubMed
    1. Shan L, et al. Stimulation of HIV-1-specific cytolytic T lymphocytes facilitates elimination of latent viral reservoir after virus reactivation. Immunity. 2012;36(3):491–501. doi: 10.1016/j.immuni.2012.01.014. - DOI - PMC - PubMed

Publication types