

Optical coherence tomography angiography of normal skin and inflammatory dermatologic conditions
- PMID: 29356051
- PMCID: PMC5867274
- DOI: 10.1002/lsm.22788
Optical coherence tomography angiography of normal skin and inflammatory dermatologic conditions
Abstract
Background: In clinical dermatology, the identification of subsurface vascular and structural features known to be associated with numerous cutaneous pathologies remains challenging without the use of invasive diagnostic tools.
Objective: To present an advanced optical coherence tomography angiography (OCTA) method to directly visualize capillary-level vascular and structural features within skin in vivo.
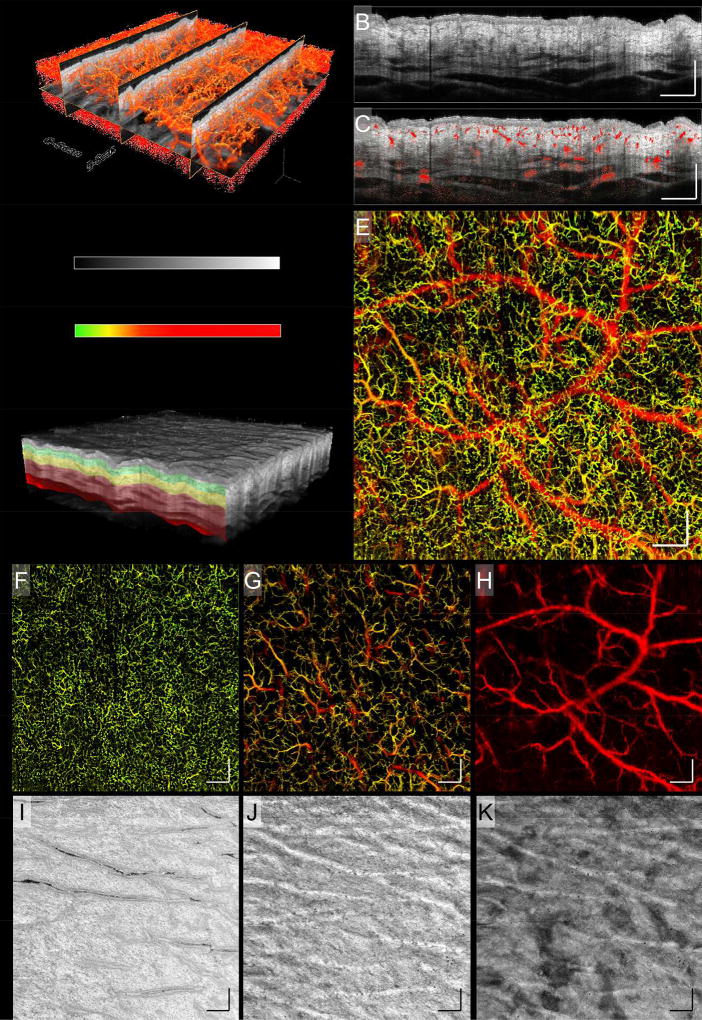
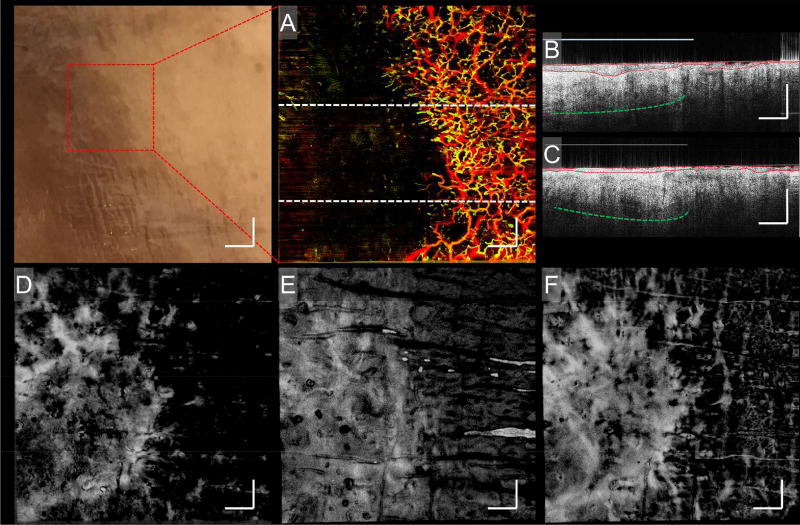
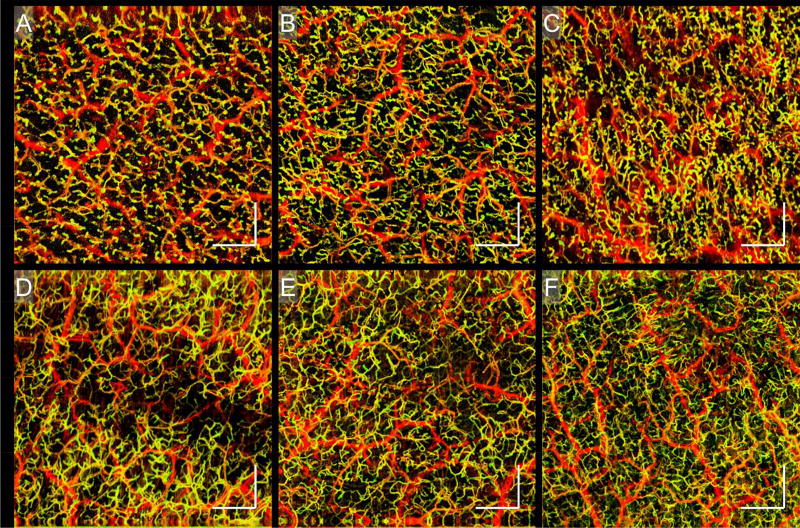
Methods: An advanced OCTA system with a 1310 nm wavelength was used to image the microvascular and structural features of various skin conditions. Subjects were enrolled and OCTA imaging was performed with a field of view of approximately 10 × 10 mm. Skin blood flow was identified using an optical microangiography (OMAG) algorithm. Depth-resolved microvascular networks and structural features were derived from segmented volume scans, representing tissue slabs of 0-132, 132-330, and 330-924 μm, measured from the surface of the skin.
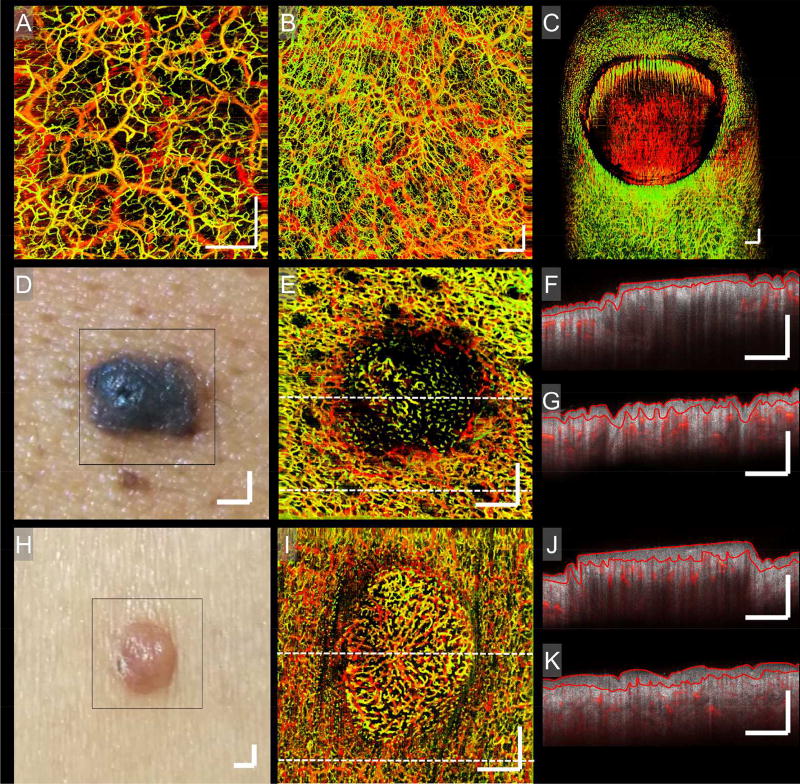
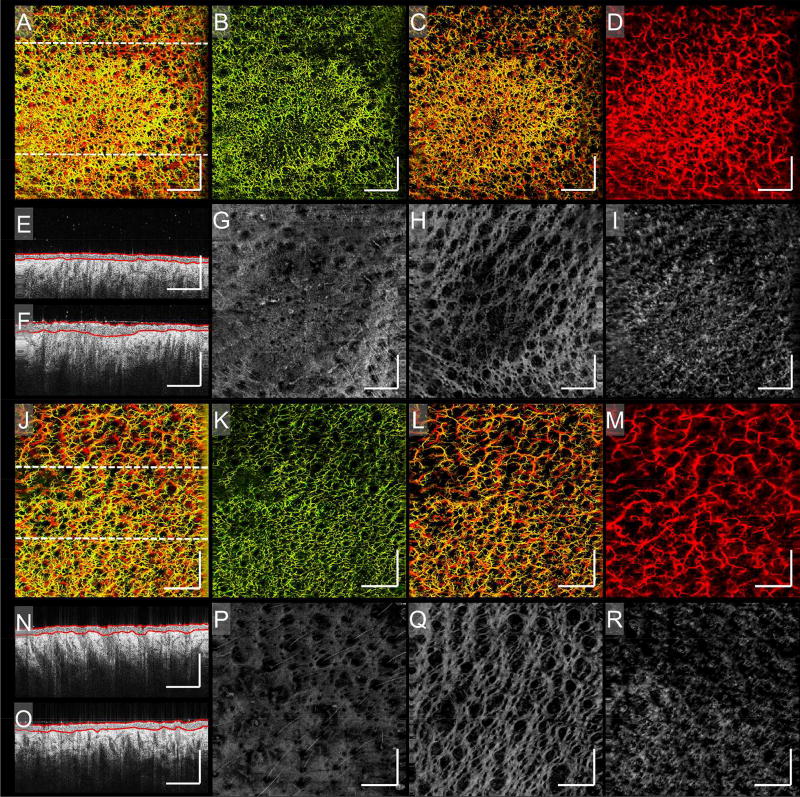
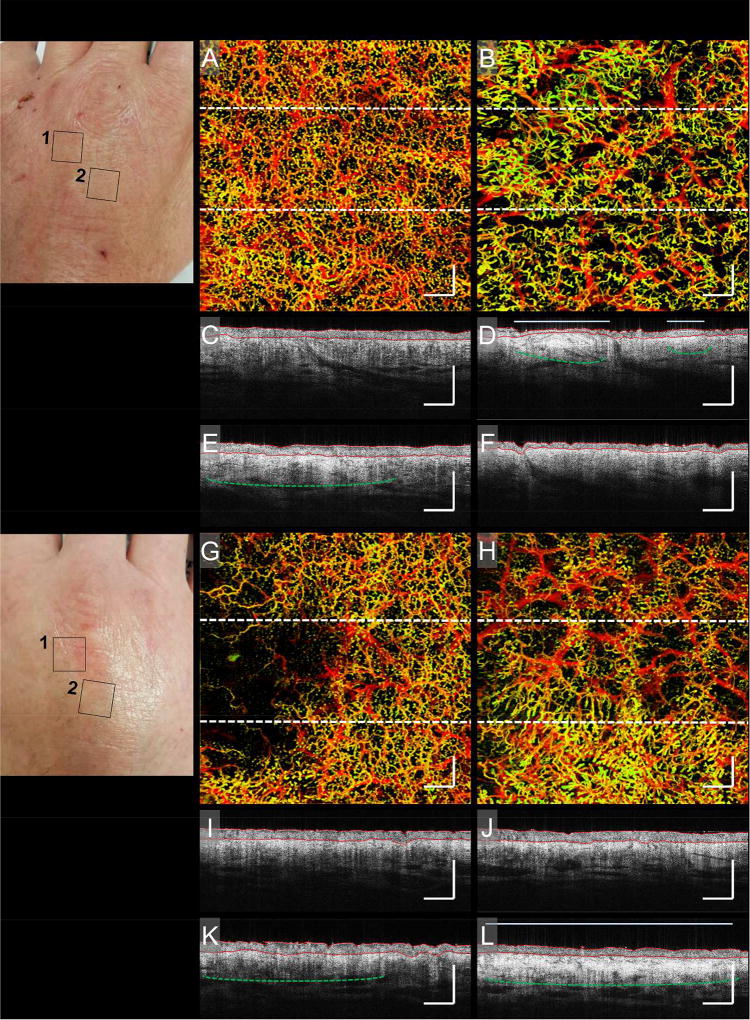
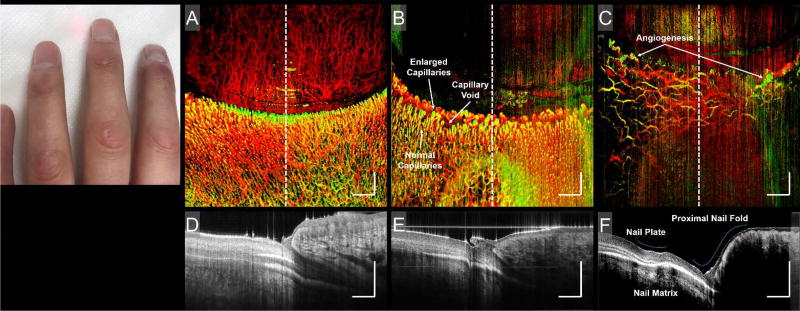
Results: Subjects with both healthy and pathological conditions, such as benign skin lesions, psoriasis, chronic graft-versus-host-disease (cGvHD), and scleroderma, were OCTA scanned. Our OCTA results detailed variations in vascularization and local anatomical characteristics, for example, depth-dependent vascular, and structural alterations in psoriatic skin, alongside their resolve over time; vascular density changes and distribution irregularities, together with corresponding structural depositions in the skin of cGvHD patients; and vascular abnormalities in the nail folds of a patient with scleroderma.
Conclusion: OCTA can image capillary blood flow and structural features within skin in vivo, which has the potential to provide new insights into the pathophysiology, as well as dynamic changes of skin diseases, valuable for diagnoses, and non-invasive monitoring of disease progression and treatment. Lasers Surg. Med. 50:183-193, 2018. © 2018 Wiley Periodicals, Inc.
Keywords: OCT angiography; graft-versus-hostdisease; optical coherence tomography; psoriasis; scleroderma; skin conditions.
© 2018 Wiley Periodicals, Inc.
Figures
Similar articles
-
Assessment of chronic radiation proctopathy and radiofrequency ablation treatment follow-up with optical coherence tomography angiography: A pilot study.World J Gastroenterol. 2019 Apr 28;25(16):1997-2009. doi: 10.3748/wjg.v25.i16.1997. World J Gastroenterol. 2019. PMID: 31086467 Free PMC article.
-
Potential use of OCT-based microangiography in clinical dermatology.Skin Res Technol. 2016 May;22(2):238-246. doi: 10.1111/srt.12255. Epub 2015 Sep 3. Skin Res Technol. 2016. PMID: 26335451 Free PMC article.
-
High resolution imaging of acne lesion development and scarring in human facial skin using OCT-based microangiography.Lasers Surg Med. 2015 Mar;47(3):231-8. doi: 10.1002/lsm.22339. Epub 2015 Mar 5. Lasers Surg Med. 2015. PMID: 25740313 Free PMC article.
-
The application of optical coherence tomography angiography in retinal diseases.Surv Ophthalmol. 2017 Nov-Dec;62(6):838-866. doi: 10.1016/j.survophthal.2017.05.006. Epub 2017 Jun 1. Surv Ophthalmol. 2017. PMID: 28579550 Review.
-
Optical coherence tomography in dermatology.G Ital Dermatol Venereol. 2015 Oct;150(5):603-15. Epub 2015 Jul 1. G Ital Dermatol Venereol. 2015. PMID: 26129683 Review.
Cited by
-
Current trends in the characterization and monitoring of vascular response to cancer therapy.Cancer Imaging. 2024 Oct 23;24(1):143. doi: 10.1186/s40644-024-00767-8. Cancer Imaging. 2024. PMID: 39438891 Free PMC article. Review.
-
Optimization-based vessel segmentation pipeline for robust quantification of capillary networks in skin with optical coherence tomography angiography.J Biomed Opt. 2019 Apr;24(4):1-11. doi: 10.1117/1.JBO.24.4.046005. J Biomed Opt. 2019. PMID: 31041858 Free PMC article.
-
Guided vascularization in the rat heart leads to transient vessel patterning.APL Bioeng. 2020 Mar 5;4(1):016105. doi: 10.1063/1.5122804. eCollection 2020 Mar. APL Bioeng. 2020. PMID: 32161835 Free PMC article.
-
Pediatric Transplant and Cellular Therapy Consortium RESILIENT Conference on Pediatric Chronic Graft-Versus-Host Disease Survivorship After Hematopoietic Cell Transplantation: Part I. Phases of Chronic GVHD, Supportive Care, and Systemic Therapy Discontinuation.Transplant Cell Ther. 2025 Feb;31(2):69.e1-69.e18. doi: 10.1016/j.jtct.2024.12.011. Epub 2024 Dec 17. Transplant Cell Ther. 2025. PMID: 39701289
-
Automatic 3D adaptive vessel segmentation based on linear relationship between intensity and complex-decorrelation in optical coherence tomography angiography.Quant Imaging Med Surg. 2021 Mar;11(3):895-906. doi: 10.21037/qims-20-868. Quant Imaging Med Surg. 2021. PMID: 33654663 Free PMC article.
References
-
- Braverman IM. The Cutaneous Microcirculation. J. Investig. Dermatol. Symp. Proc. 2000;5:3–9. - PubMed
-
- Braverman IM, Schechner JS. Contour Mapping of the Cutaneous Microvasculature by Computerized Laser Doppler Velocimetry. J. Invest. Dermatol. 1991;97:1013–1018. - PubMed
-
- Braverman IM. The cutaneous microcirculation: ultrastructure and microanatomical organization. Microcirc. N. Y. N 1994. 1997;4:329–340. - PubMed
-
- Albrecht HP, et al. Microcirculatory functions in systemic sclerosis: additional parameters for therapeutic concepts? J. Invest. Dermatol. 1993;101:211–215. - PubMed
-
- Chang E, Yang J, Nagavarapu U, Herron GS. Aging and survival of cutaneous microvasculature. J. Invest. Dermatol. 2002;118:752–758. - PubMed
Publication types
MeSH terms
Grants and funding
LinkOut - more resources
Full Text Sources
Other Literature Sources
Medical
