Review
. 2018 Mar;30(12):e1704007.
doi: 10.1002/adma.201704007. Epub 2018 Jan 22.

Emerging Strategies of Cancer Therapy Based on Ferroptosis

Affiliations
Review

Emerging Strategies of Cancer Therapy Based on Ferroptosis

Zheyu Shen et al. Adv Mater. 2018 Mar.

Abstract

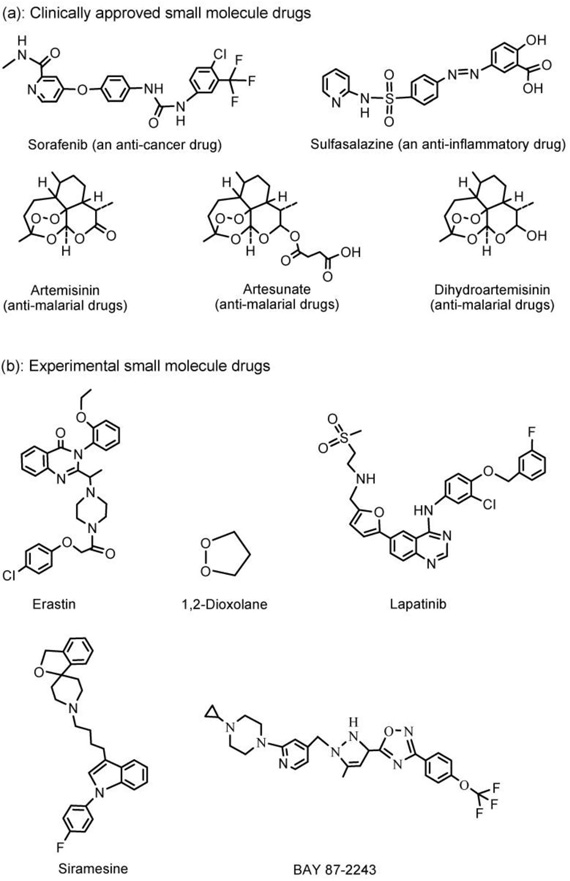
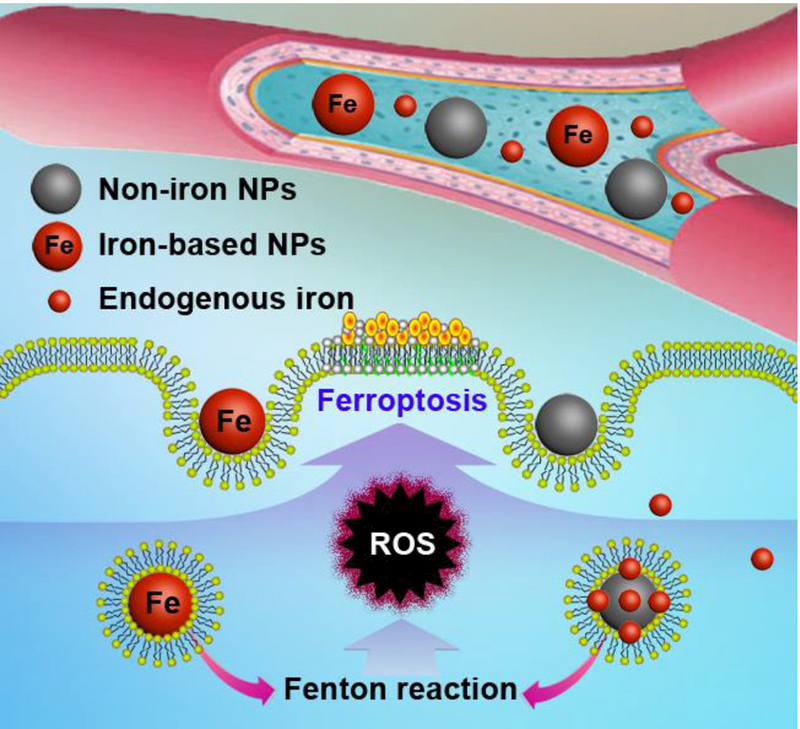
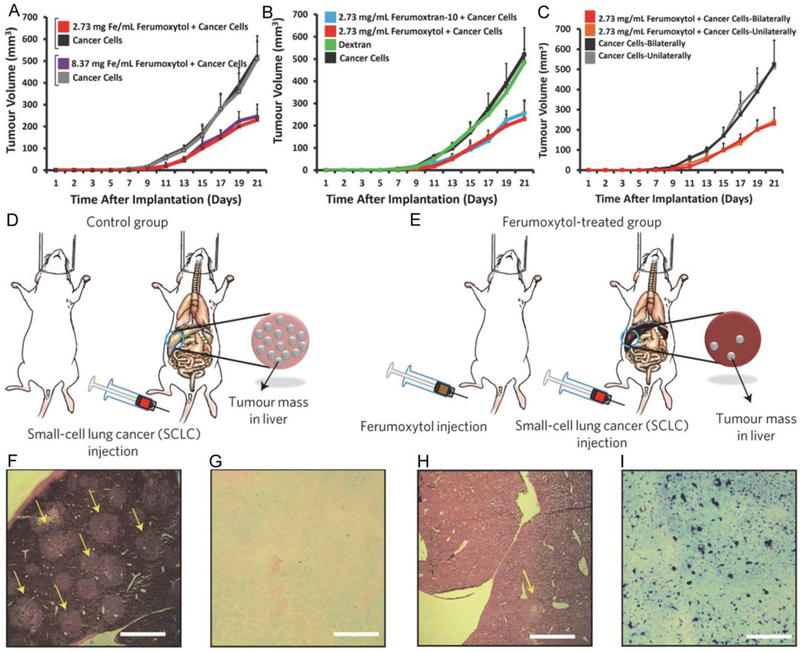
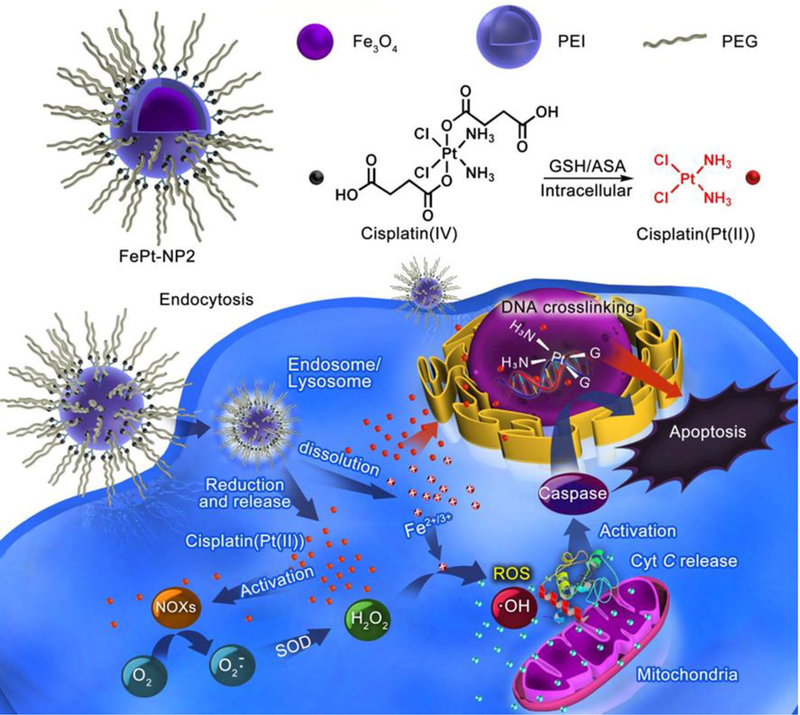
Ferroptosis, a new form of regulated cell death that is iron- and reactive oxygen species dependent, has attracted much attention in the research communities of biochemistry, oncology, and especially material sciences. Since the first demonstration in 2012, a series of strategies have been developed to induce ferroptosis of cancer cells, including the use of nanomaterials, clinical drugs, experimental compounds, and genes. A plethora of research work has outlined the blueprint of ferroptosis as a new option for cancer therapy. However, the published ferroptosis-related reviews have mainly focused on the mechanisms and pathways of ferroptosis, which motivated this contribution to bridge the gap between biological significance and material design. Therefore, it is timely to summarize the previous efforts on the emerging strategies for inducing ferroptosis and shed light on future directions for using such a tool to fight against cancer. Here, the current strategies of cancer therapy based on ferroptosis will be elaborated, the design considerations and the advantages and limitations are highlighted, and finally a future perspective on this emerging field is given.

Keywords: Fenton reaction; cancer therapy; ferroptosis; iron-based nanomaterials; lipid peroxidation.


Figures

Figure 1.
Figure 1.
Structures of the clinically approved (a) and experimental (b) small molecule drugs that are able to induce ferroptosis in cancer cells.
Figure 2.
Figure 2.
Mechanism scheme of the iron-based and indirect iron-based nanomaterials for ferroptosis-based cancer therapy. These nanomaterials can release their own iron or loaded endogenous iron in lysosome after endocytosis, which can be involved in the Fenton reaction to produce ROS and induce lipid peroxidation.
Figure 3.
Figure 3.
A-C: Inhibition of tumor growth by the ferumoxytol (i.e. IO NPs). 2.3 × 10⁶ MMTV-PyMT-derived cancer cells were inoculated to mice in the mammary fat pad with and without IO NPs. A: Tumor growth inhibited by the Ferumoxytol compared with controls (untreated) with 2 different concentrations of iron. B: Tumor growth inhibited by 2 different IO NPs (i.e. ferumoxytol, and ferumoxytran-10) compared with controls (untreated, or dextran only). C: Growth of the tumors inoculated unilaterally or bilaterally with 2.3 × 10⁶ MMTV-PyMT-derived cancer cells in the mammary fat pad, with or without co-implantation of ferumoxytol (2.73 mg Fe / mL). Mean ± SD, n = 7. D,E: Inhibition of the liver metastases development by pretreatment with the ferumoxytol. Experimental methods: mice were injected with either saline (left) or ferumoxytol (3 × 10 mg Fe per kg−1; right), followed by intravenous injection of 1 × 10⁴ KP1-GFP-Luc cells. F-I: Corresponding histopathology: representative hematoxylin and eosin (H&E) stained images show marked tumor cell infiltration (yellow arrows) of a normal liver (control) (F), but not for a liver treated with ferumoxytol (H). Prussian blue stains show almost no iron deposition in an untreated liver (control) (G), but obvious iron deposition in a liver treated with ferumoxytol (I). Scale bars, 1 mm. Reproduced with permission.[45] Copyright 2016, Nature Publishing Group.
Figure 4.
Figure 4.
Schematic design of self-sacrificing IO NPs with cisplatin (IV) prodrug (FePt-NP2). The released cisplatin after endocytosis can activate NOXs that catalyze formation of H2O2 from O2. Both the formed H2O2 and the released Fe2+/3+ induce ROS via Fenton reaction, which results in fast lipid and protein oxidation and DNA damage. Reproduced with permission.[47] Copyright 2017, American Chemical Society.
Figure 5.
Figure 5.
A: Schematic generation of 1O2 via a chemical reaction between LAHP and catalytic ions (i.e. Fe2+) by the Russell mechanism. IO-LAHP NPs were fabricated by tethering phosphate group terminated hydrophobic (p1) and hydrophilic (p2) polymer brushes on surface. After internalization with cancer cells, the release of Fe2+ ions under acidic environment generate 1O2 species which exert cancer cell death through ROS mediated mechanism. B, C: UV and FL detection of 1O2 generation by 1O2 scavenger and SOSG. D: TEM image of IO NPs of Wustite-magnetite mixed phases with diameter of about 22 nm. E: Release profiles of iron ions from the IO-LAHP NPs under different pH values of 5.4, 6.8, and 7.4, respectively. Reproduced with permission.[48] Copyright 2017, Wiley-VCH.
Figure 6.
Figure 6.
A: Cell viability study in U87MG cell model after incubation with PBS, IO-LAHP, Au-LAHP, or IO-LA NPs for 48 h. The doses of Au-LAHP NPs were normalized to LAHP molecules. Values are mean ± s.d. (n = 3). B: Merged confocal microscopy images of cells incubated with different formulations for 24 h and stained with DAPI and TUNEL-FITC. Yellow arrows show the size shrinkage and shape abnormality of cell nucleus. C: Flow cytometry study of cells treated with different formulations for 24 h and stained with Annex V-FITC/PI apoptosis kit. Values indicate the percentages of early apoptotic cells. D: Overall tumor growth inhibition curves of mouse group treated with different formulations with total of three doses every three days (black triangles). Data represents mean ± s.d. (n = 5 / group, **P < 0.01). Reproduced with permission.[48] Copyright 2017, Wiley-VCH.
Figure 7.
Figure 7.
A: Schematic preparation of Fe3O4-embedded and H2O2-encapsulated PLGA polymersomes (H2O2/Fe3O4-PLGA) by a double-emulsion process. B: TEM image of the Fe3O4-PLGA polymersomes. C: high-magnification TEM image of a single Fe3O4-PLGA polymersome. D: TEM image of the H2O2/Fe3O4-PLGA polymersomes. E: high-magnification image of a single H2O2/Fe3O4-PLGA polymersome. F: SEM image of the H2O2/Fe3O4-PLGA polymersomes. The inset is a high magnification image of a single H2O2/Fe3O4-PLGA polymersome. G: Cryo-TEM image of a single H2O2/Fe3O4-PLGA polymersome with a hollow structure. Reproduced with permission.[49] Copyright 2016, American Chemical Society.
Figure 8.
Figure 8.
A: Schematic design of the AFeNPs. B: Cell viabilities of the MCF-7 cells with incubation of AFeNPs at pH 7.4 and 6.5 with various concentrations of H2O2 (mean ± S.D., n = 6, **P < 0.01, and ***P < 0.001). C: Confocal images of MCF-7 cells (stained with DCFH-DA) treated with AFeNPs only, H2O2 only, and both at pH 6.5. D: Change of the relative tumor volume after different treatments (mean ± S.D., n = 5, *P < 0.05, **P < 0.01, and ***P < 0.001). E: Change of the H2O2 concentration in the tumor after different treatments (mean ± S.D., n = 3, *P < 0.05, ***P < 0.001). Intratumoral AFeNP injection: (i.t.); intravenous AFeNP injection without magnetic targeting: (i.v.); intravenous AFeNP injection with magnetic targeting: (i.v.) + magnet. Reproduced with permission.[51] Copyright 2016, Wiley-VCH.
Figure 9.
Figure 9.
A: Schematic design of MON-p53. B: TEM images of PEI/p53. C: TEM images of MON-p53. D: Schematic illustration of the anticancer therapy by MON-p53. (I) Endocytosis of MON-p53. (II) Fenton reaction induced by MON. (III) Transfection and expression of p53 protein. (IV) Inhibition of transmembrane SLC7A11 protein mediated by p53 protein. (V) Fenton reaction regulated LPO accumulation and SLC7A11 inhibition induced GSH depletion caused ferroptosis; p53 protein regulated apoptosis pathway and cause apoptosis. (E-G): Cells morphology with PEI/p53 (with a p53 content of 2 μg/mL) mediated apoptosis. (H-J): Cells morphology with MON-p53 mediated ferroptosis (with a p53 content of 2 μg/mL). K: Survival curves of mice receiving injections of Era at a dose of 5 mg/kg, MONP at a dose of 5 mg/kg, and DNA dose of 0.375 mg/kg (n = 7 for all groups) in HT1080 tumor bearing mice. L: HT1080 tumor volume curves of mice at the first 25 days. Reproduced with permission.[55] Copyright 2017, American Chemical Society.
Figure 10.
Figure 10.
The pH-responsive theranostic probe and its active intracellular Fe release process. FePt/GO CNs enter the tumor cells via folate receptor-mediated endocytosis, subsequently Fe is released from FePt due to the acidic stimuli in tumor cells, and the released Fe catalyzes H2O2 into ROS (Fenton reaction), which could damage the cellular membranes, eventually leading to ferroptosis. Reproduced with permission.[56] Copyright 2017, American Chemical Society.
Figure 11.
Figure 11.
A: Design of the non-iron ultrasmall αMSH-PEG-C’ dots (6-nm) with a fluorescent (Cy5 encapsulated) core and polyethylene glycol (PEG) coating and alpha melanocytestimulating hormone (αMSH)-modified exterior. B: Nanoparticle treatment induces cell death of M21 cells cultured in amino-acid-free media. C: M21 cells treated with 15 μM αMSH-PEG-C’ dots in full media for 72 h before creating xenografts in immunodeficient (SCID/Beige) mice demonstrate growth inhibition (inverted triangles) relative to untreated control cells (circles). Schematic shows workflow, consisting of (1) particle-loading M21 melanoma cells, by treatment at 15 μM for 48 h in culture under full media conditions, and (2) injecting 5 × 10⁶ particle-loaded M21 cells into mice to assay xenograft tumor growth versus control untreated cells. D: The nanoparticle-induced ferroptosis is executed following iron uptake into cells, suppression of glutathione, and accumulation of lipid ROS. Lipid ROS may accumulate in glutathione-suppressed cells due to lowered activity of the glutathione peroxidase 4 (GPX4) enzyme that protects cells from lipid peroxidation and inhibits ferroptosis. Reproduced with permission.[60] Copyright 2016, Nature Publishing Group.
Figure 12.
Figure 12.
Inhibition of the HSF1-HSPB1 pathway increases anticancer activity of erastin in vivo. (a) HSF1 and HSPB1 knockdown HeLa cells were more sensitive to erastin in vivo. SCID mice were injected subcutaneously with indicated HeLa cells (1 × 10⁶ cells/mouse) and treated with erastin (20 mg/kg intravenously, twice every other day) at day 7 for 2 weeks. Tumor volume was calculated weekly. (b) The quantitative real-time polymerase chain reaction (qPCR) analysis of the indicated gene expression in isolated tumor at day 28. (c) KRIBB3 increased anticancer activity of erastin in vivo. SCID mice were injected subcutaneously with indicated HeLa cells (1 × 10⁶ cells/mouse) and treated with erastin (20 mg/kg intravenously, twice every other day) with or without KRIBB3 (50 mg/kg intraperitoneally, once every other day) at day 7 for 2 weeks. Tumor volume was calculated weekly. (d) The qPCR analysis of the PTGS2 gene expression in isolated tumor at day 28. (Mean ± S.E., n=5~8 mice/group, *P < 0.05). Reproduced with permission.[70] Copyright 2016, Nature Publishing Group.

References

    1. Dixon SJ, Lemberg KM, Lamprecht MR, Skouta R, Zaitsev EM, Gleason CE, Patel DN, Bauer AJ, Cantley AM, Yang WS, Morrison III B, Stockwell BR, Cell 2012, 149, 1060. - PMC - PubMed
    1. Tan S, Schubert D, Maher P, Curr. Top. Med. Chem 2001, 1, 497. - PubMed
    1. Doll S, Conrad M, IUBMB Life 2017, 69, 423. - PubMed
    1. Seiler A, Schneider M, Forster H, Roth S, Wirth EK, Culmsee C, Plesnila N, Kremmer E, Radmark O, Wurst W, Cell Metab 2008, 8, 237. - PubMed
    1. Dolma S, Lessnick SL, Hahn WC, Stockwell BR, Cancer Cell 2003, 3, 285. - PubMed