

The effects of estrogen deficiency on cortical bone microporosity and mineralization
- PMID: 29357314
- PMCID: PMC6377161
- DOI: 10.1016/j.bone.2018.01.019
The effects of estrogen deficiency on cortical bone microporosity and mineralization
Abstract
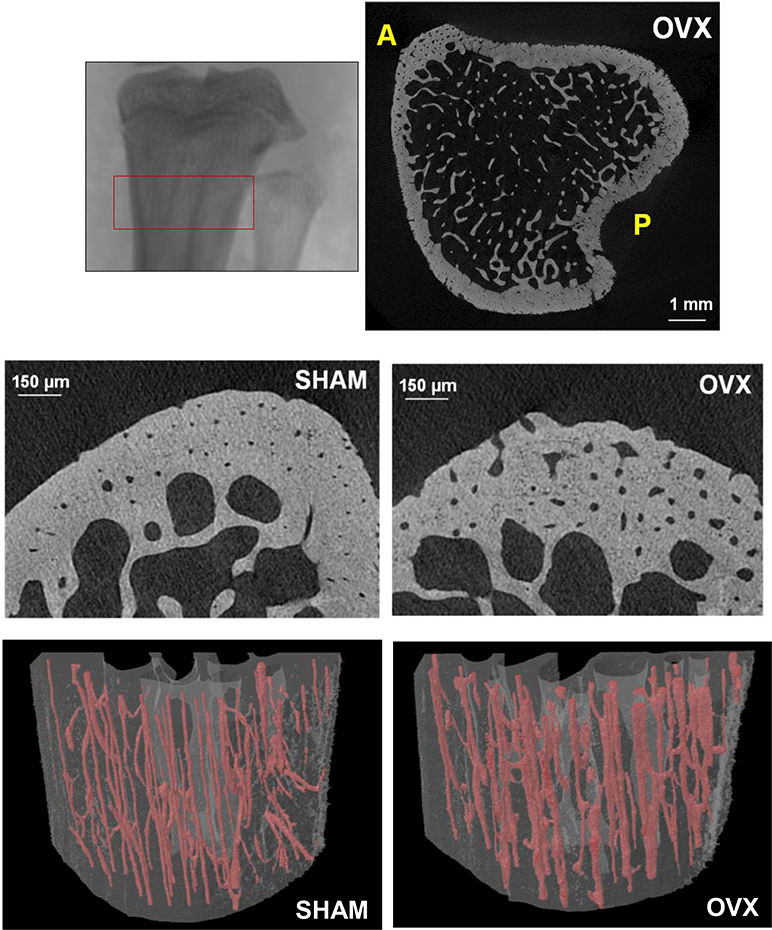
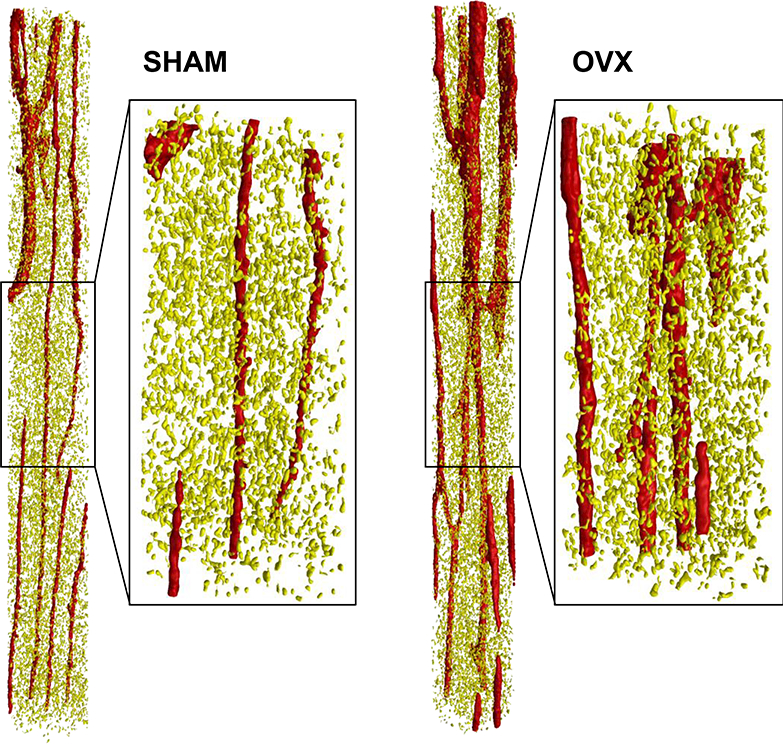
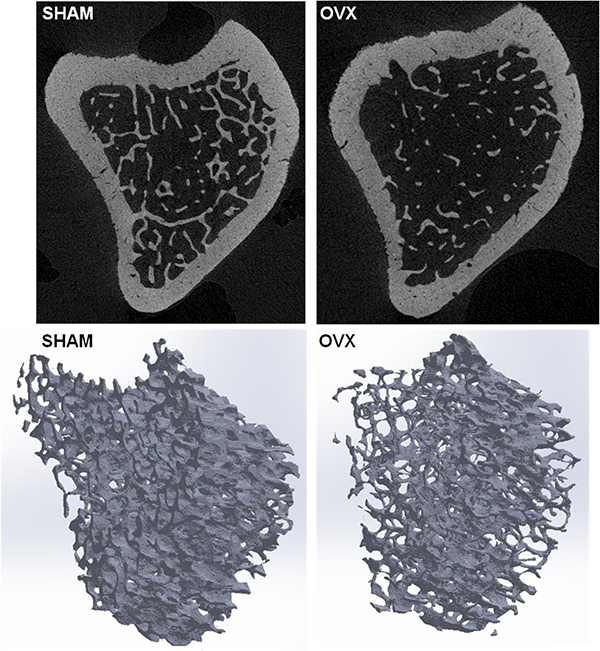
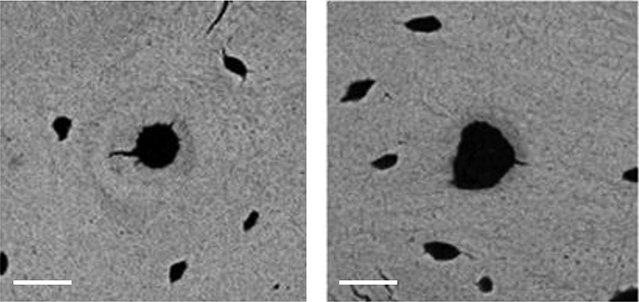
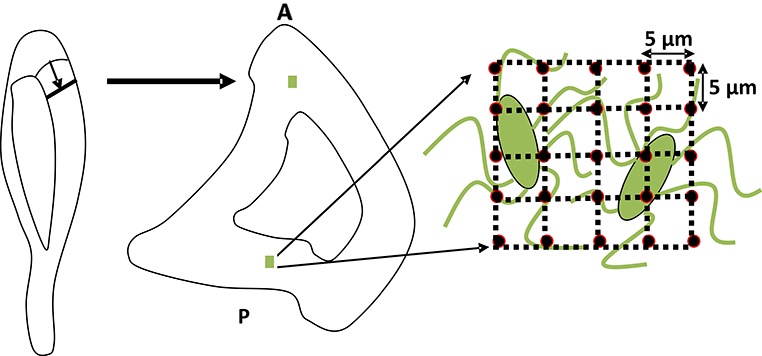
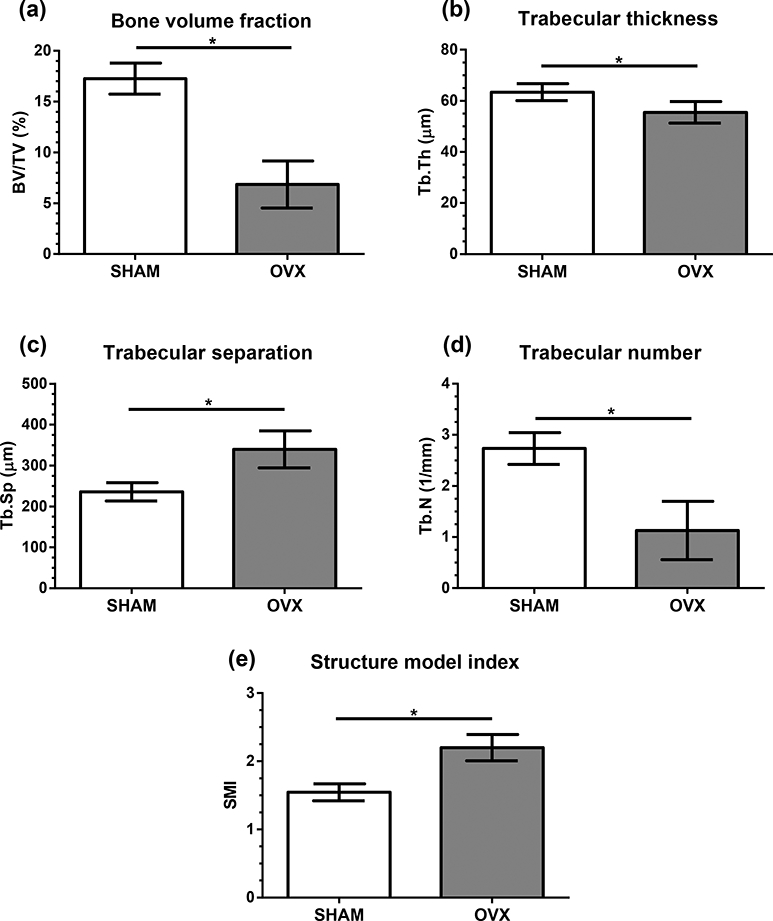
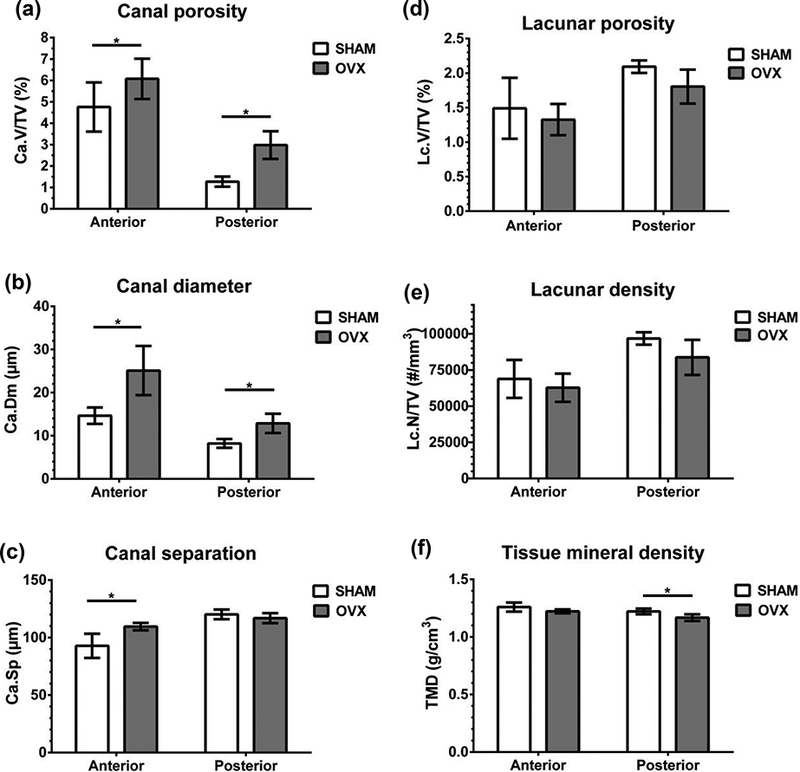
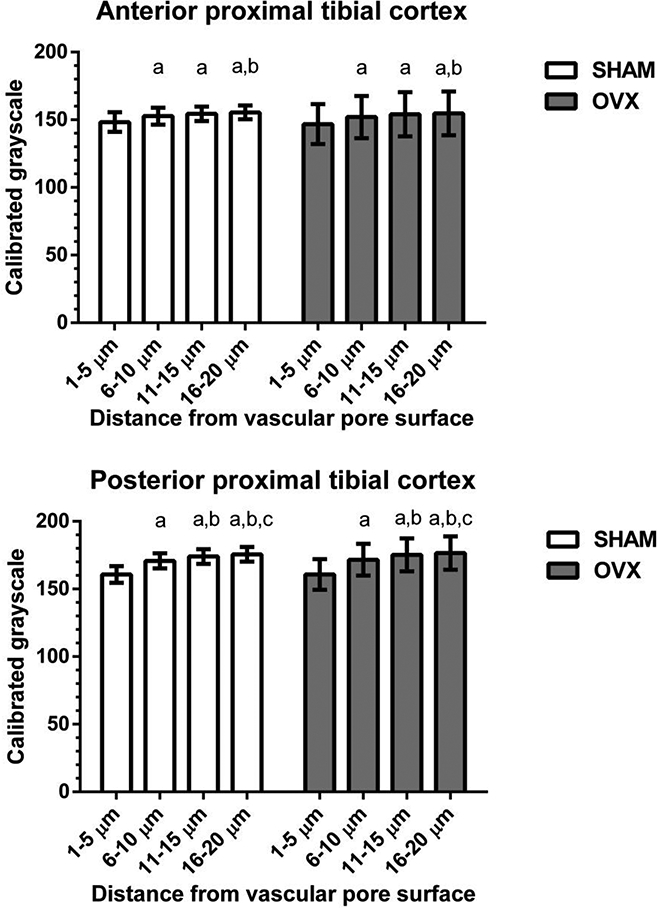
Recent studies have demonstrated matrix-mineral alterations in bone tissue surrounding osteocytes in estrogen-deficient animals. While cortical bone porosity has been shown to be a contributor to the mechanical properties of bone tissue, little analysis has been done to investigate the effects of estrogen deficiency on bone's microporosities, including the vascular and osteocyte lacunar porosities. In this study we examined alterations in cortical bone microporosity, mineralization, and cancellous bone architecture due to estrogen deficiency in the ovariectomized rat model of postmenopausal osteoporosis. Twenty-week-old female Sprague-Dawley rats were subjected to either ovariectomy or sham surgery. Six weeks post-surgery tibiae were analyzed using high-resolution micro-CT, backscattered electron imaging, nanoindentation, and dynamic histomorphometry. Estrogen deficiency caused an increase in cortical bone vascular porosity, with enlarged vascular pores and little change in tissue mineral density in the proximal tibial metaphysis. Measurements of cancellous architecture corresponded to previous studies reporting a decrease in bone volume fraction, an increase in trabecular separation, and a decrease in trabecular number in the proximal tibia due to estrogen deficiency. Nanoindentation results showed no differences in matrix stiffness in osteocyte-rich areas of the proximal tibia of estrogen-deficient rats, and bone labeling and backscattered electron imaging showed no significant changes in mineralization around the vascular pores. The findings demonstrate local surface alterations of vascular pores due to estrogen deficiency. An increase in cortical vascular porosity may diminish bone strength as well as alter bone mechanotransduction via interstitial fluid flow, both of which could contribute to bone fragility during postmenopausal osteoporosis.
Keywords: Bone mechanotransduction; Cortical porosity; Osteocyte lacunar porosity; Osteoporosis; Vascular porosity.
Copyright © 2018 Elsevier Inc. All rights reserved.
Figures
References
-
- Almeida M, Han L, Martin-Millan M, Plotkin LI, Stewart SA, Roberson PK, Kousteni S, O’Brien CA, Bellido T, Parfitt AM, Weinstein RS, Jilka RL, Manolagas SC. Skeletal involution by age-associated oxidative stress and its acceleration by loss of sex steroids. J Biol Chem 2007;282: 27285–27297. - PMC - PubMed
-
- Cooper D, Turinsky A, Sensen C, Hallgrimsson B. Effect of voxel size on 3D micro-CT analysis of cortical bone porosity. Calcif Tissue Int 2007;80: 211–19. - PubMed
-
- Matsumoto T, Yoshino M, Asano T, Uesugi K, Todoh M, Tanaka M. Monochromatic synchrotron radiation muCT reveals disuse-mediated canal network rarefaction in cortical bone of growing rat tibiae. J Appl Physiol 2006;100: 274–80. - PubMed
-
- Schneider P, Stauber M, Voide R, Stampanoni M, Donahue LR, Muller R. Ultrastructural properties in cortical bone vary greatly in two inbred strains of mice as assessed by synchrotron light based micro- and nano-CT. J Bone Miner Res 2007;22: 1557–70. - PubMed
-
- Cowin SC. Bone poroelasticity. J Biomech 1999;32: 217–38. - PubMed
Publication types
MeSH terms
Substances
Grants and funding
LinkOut - more resources
Full Text Sources
Other Literature Sources
Medical
