. 2018 Jan 22;14(1):e1006802.
doi: 10.1371/journal.ppat.1006802. eCollection 2018 Jan.

Regional and subtype-dependent miRNA signatures in sporadic Creutzfeldt-Jakob disease are accompanied by alterations in miRNA silencing machinery and biogenesis

Affiliations

Regional and subtype-dependent miRNA signatures in sporadic Creutzfeldt-Jakob disease are accompanied by alterations in miRNA silencing machinery and biogenesis

Franc Llorens et al. PLoS Pathog. .

Abstract

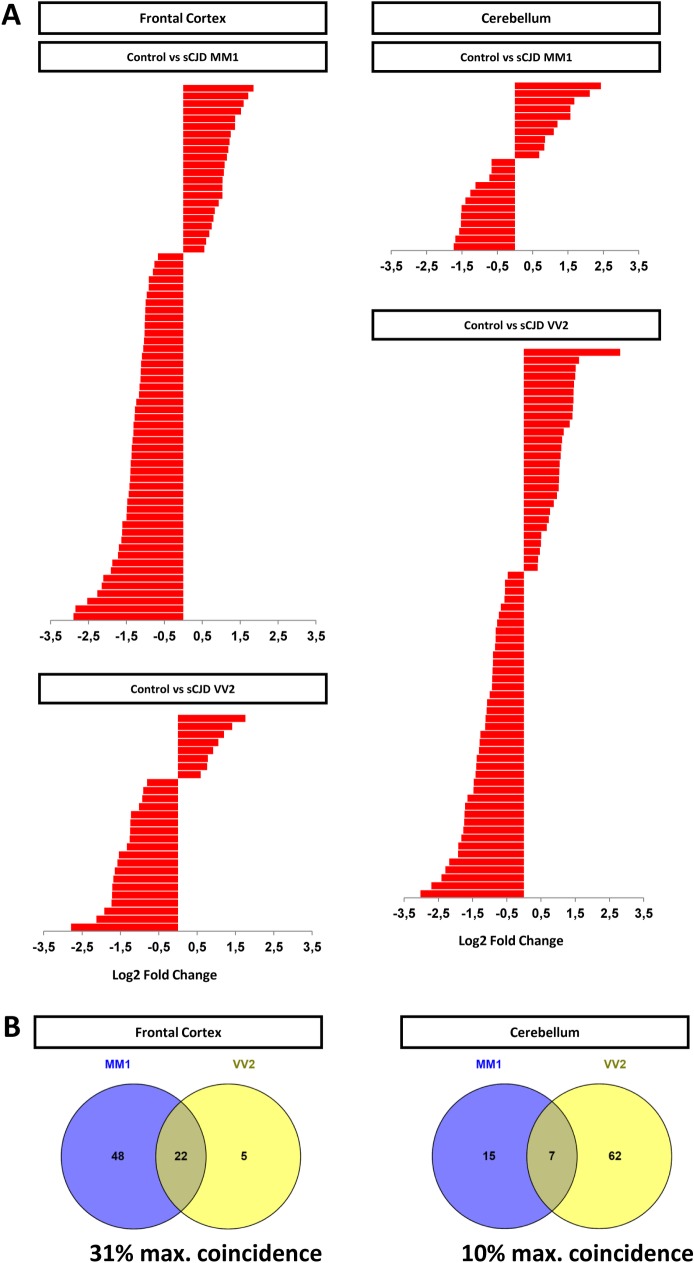
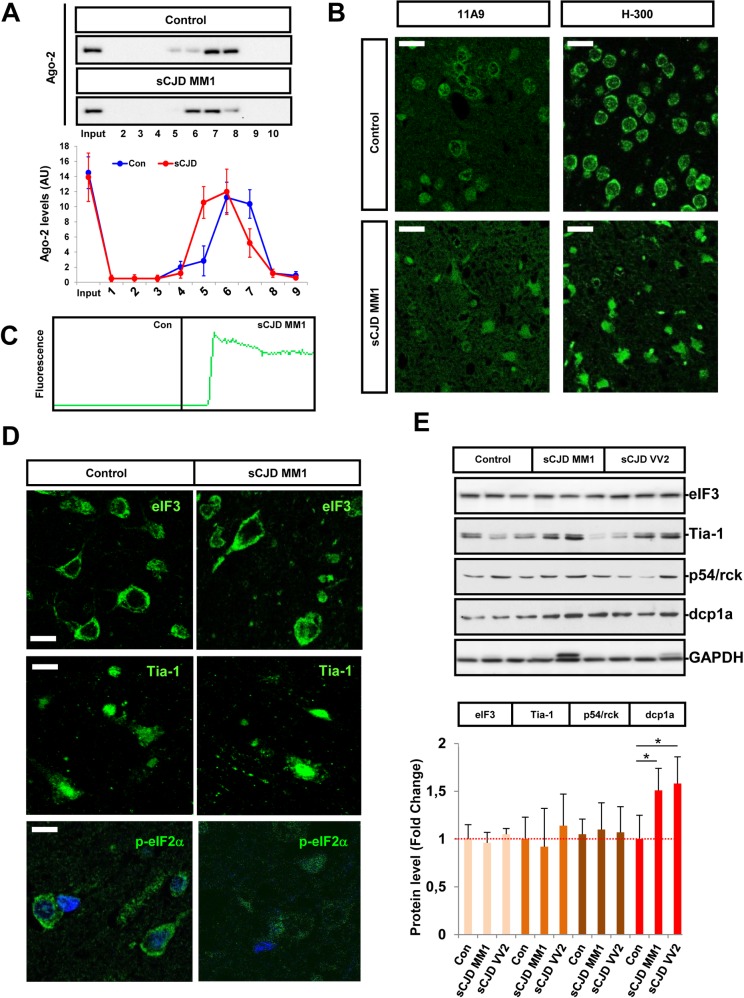
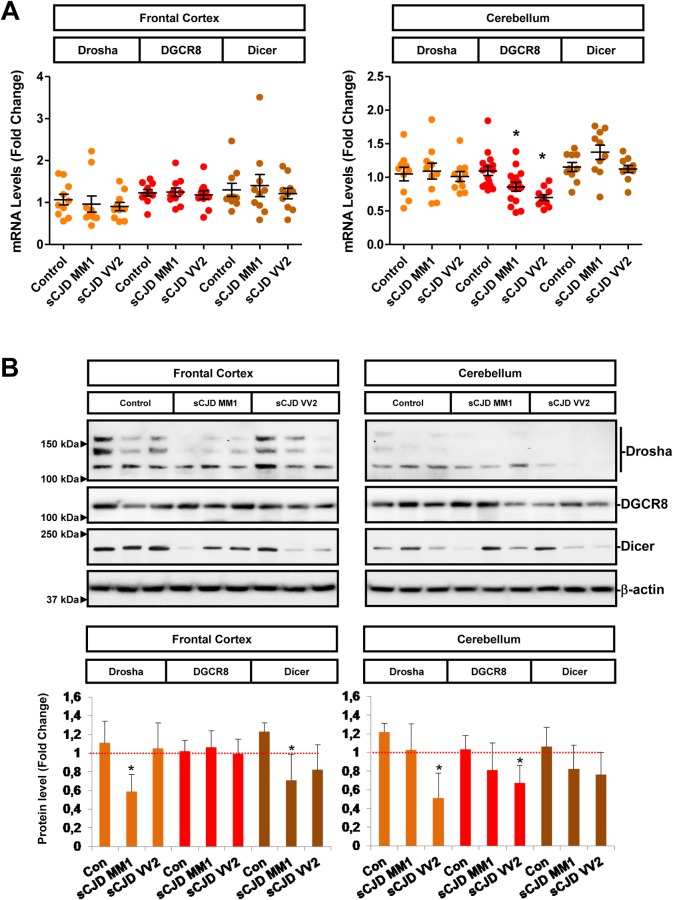
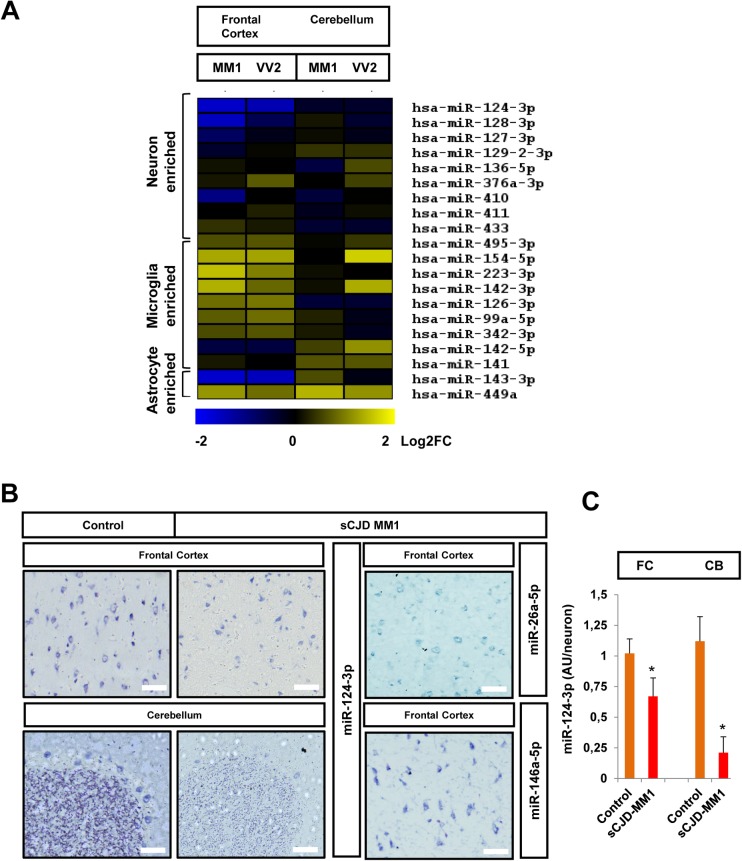
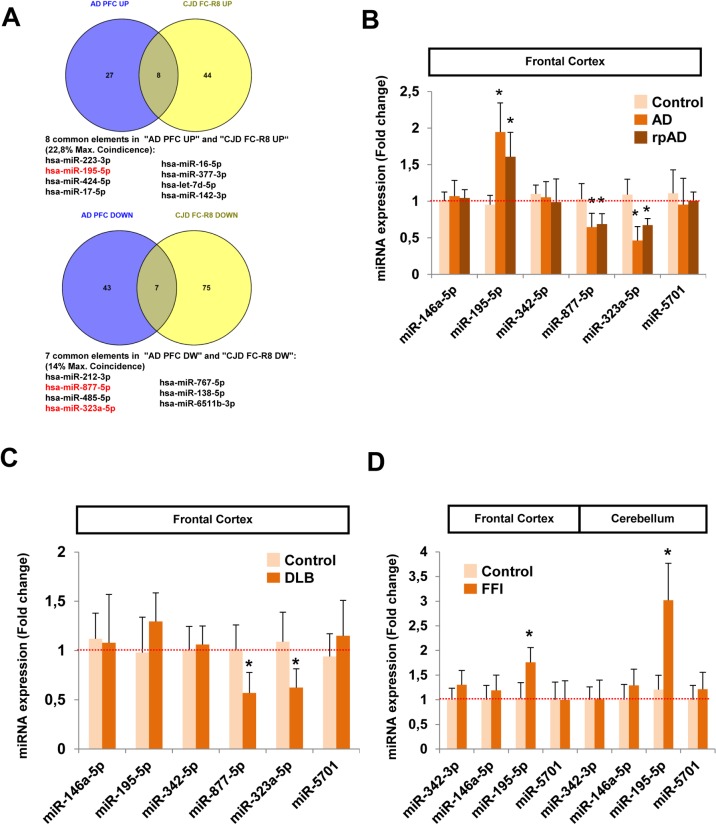
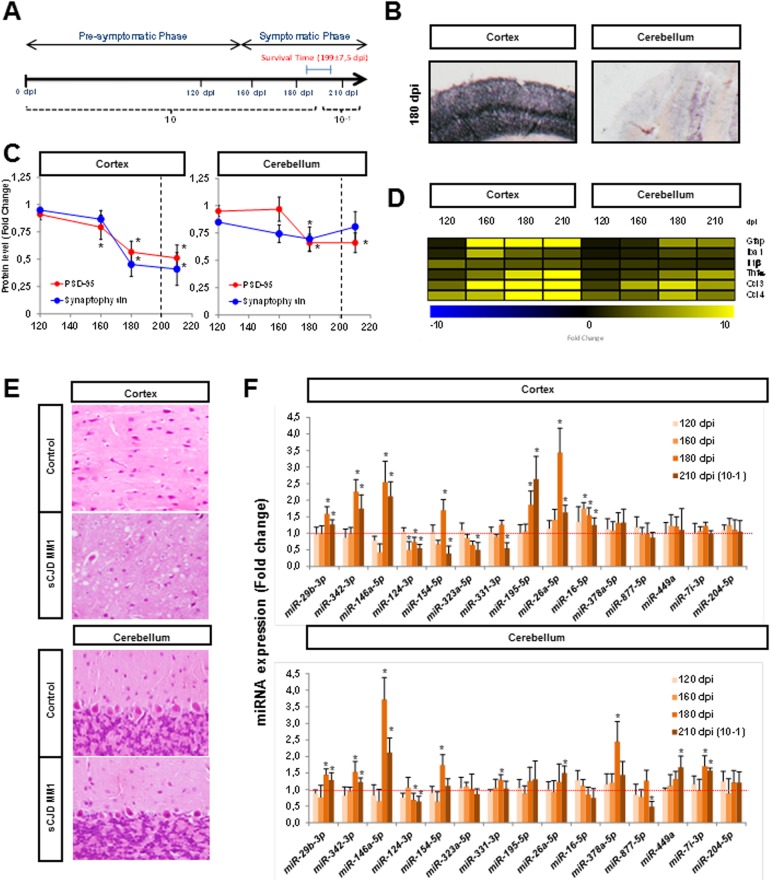
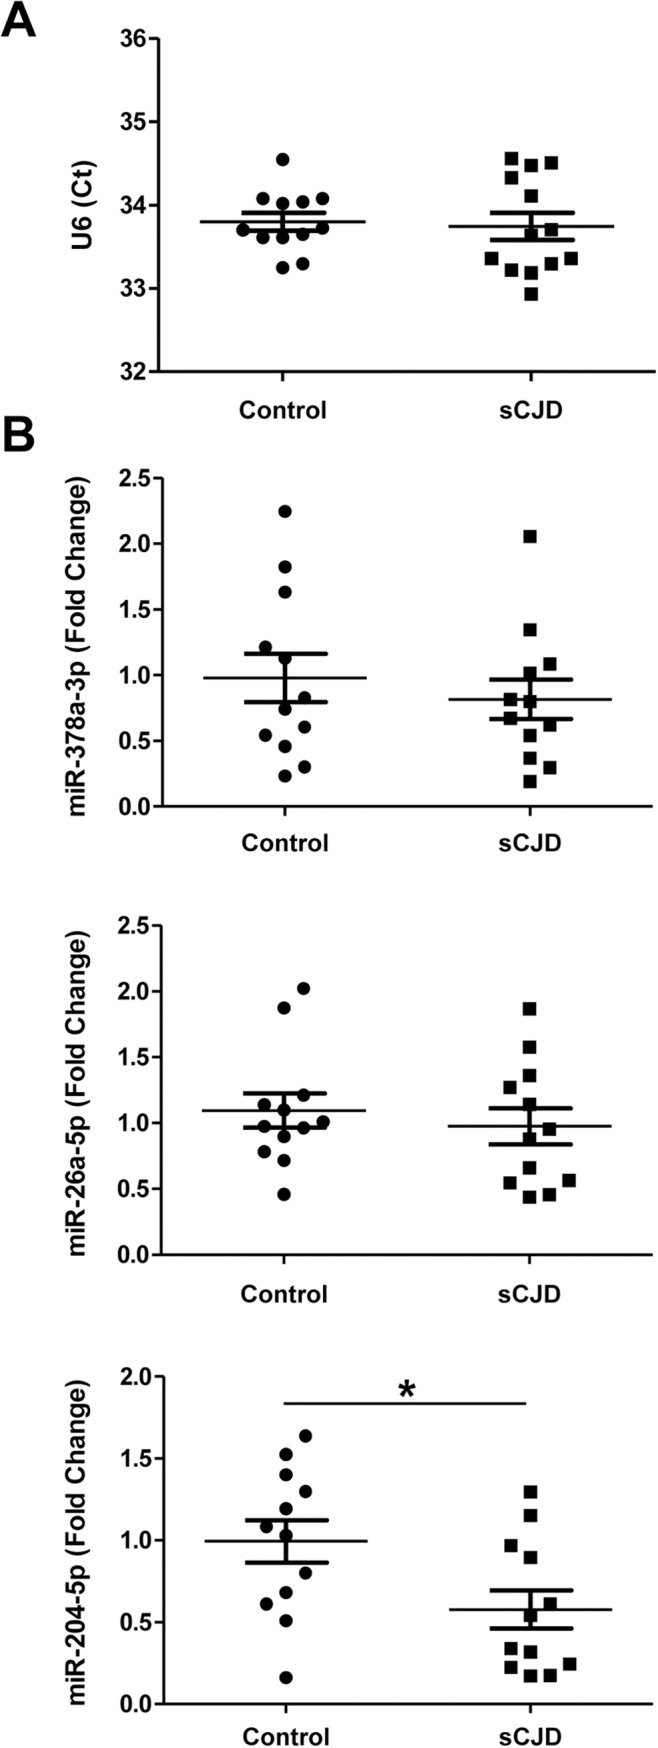
Increasing evidence indicates that microRNAs (miRNAs) are contributing factors to neurodegeneration. Alterations in miRNA signatures have been reported in several neurodegenerative dementias, but data in prion diseases are restricted to ex vivo and animal models. The present study identified significant miRNA expression pattern alterations in the frontal cortex and cerebellum of sporadic Creutzfeldt-Jakob disease (sCJD) patients. These changes display a highly regional and disease subtype-dependent regulation that correlates with brain pathology. We demonstrate that selected miRNAs are enriched in sCJD isolated Argonaute(Ago)-binding complexes in disease, indicating their incorporation into RNA-induced silencing complexes, and further suggesting their contribution to disease-associated gene expression changes. Alterations in the miRNA-mRNA regulatory machinery and perturbed levels of miRNA biogenesis key components in sCJD brain samples reported here further implicate miRNAs in sCJD gene expression (de)regulation. We also show that a subset of sCJD-altered miRNAs are commonly changed in Alzheimer's disease, dementia with Lewy bodies and fatal familial insomnia, suggesting potential common mechanisms underlying these neurodegenerative processes. Additionally, we report no correlation between brain and cerebrospinal fluid (CSF) miRNA-profiles in sCJD, indicating that CSF-miRNA profiles do not faithfully mirror miRNA alterations detected in brain tissue of human prion diseases. Finally, utilizing a sCJD MM1 mouse model, we analyzed the miRNA deregulation patterns observed in sCJD in a temporal manner. While fourteen sCJD-related miRNAs were validated at clinical stages, only two of those were changed at early symptomatic phase, suggesting that the miRNAs altered in sCJD may contribute to later pathogenic processes. Altogether, the present work identifies alterations in the miRNA network, biogenesis and miRNA-mRNA silencing machinery in sCJD, whereby contributions to disease mechanisms deserve further investigation.


Conflict of interest statement

The authors have declared that no competing interests exist."

Figures

Fig 1
Fig 1. Small RNA-Seq analysis and miRNA expression levels in the FC and CB of sCJD.
(A) Relative quantitation of regulated miRNAs in the FC and CB of sCJD MM1 and VV2 subtypes compared to age and gender matched controls by small RNA-Seq. For FC 13 controls, 11 sCJD MM1 and 13 sCJD VV2 were analyzed. For CB: 12 controls, 12 sCJD MM1 and 9 sCJD VV2 were analyzed. Differential expression in miRNA sequencing data was evaluated with the DESeq2 tool and significantly differently expressed miRNAs were detected according to an adjusted p value of <0.05. Data represent log2 fold change for each comparison. log2 fold change was >0.5 for upregulated miRNAs and <-0.5 for downregulated miRNAs. MA plots are also supplied for data visualization (S1 Fig). (B) Venn diagram of subtype-dependent altered miRNA in the FC and CB of sCJD by small RNA-Seq. Percentage of maximal coincidence (percentage of maximal number of miRNAs that can be coincident between groups) is indicated.
Fig 2
Fig 2. Regional and subtype-dependent miRNA expression confirmation and representative miRNA incorporation into functional complexes.
(A) Validation of the small RNA-Seq signature in selected miRNAs by RT-qPCR analysis in the FC (upper panel) and CB (lower panel) of controls, sCJD MM1 and VV2. Results were normalized to the housekeeping genes U6 snRNA (figure) and RNU5 expression, which showed similar results in the expression analysis of deregulated miRNAs between control and sCJD cases. Housekeeping gene levels remained unaltered between groups. Normalization was performed relative to controls. Error bars indicate SD. (B) Detection of sCJD-related miRNAs by RT-qPCR in Ago immunoprecipitates from the FC of controls (n = 3) and sCJD MM1 brain homogenates (n = 3). The two Ago antibodies used (11A9 and H-300) were able to immunoprecipitate Ago-2 from brain tissue (left panel) and reported similar results in the specific enrichment of sCJD-related miRNAs (146a-5p, 26a-5p, 195-5p, 154-5p, 204-5p and 5701) in the FC of sCJD MM1 cases (right panels). miRNA-204-5p was selected as negative control, since no changes were detected between control and sCJD cases with small RNA-Seq and RT-qPCR analysis. Non-specific immunoglobulins (NS) were used as control antibody for the immunoprecipitation. Error bars indicate SD. (C) Upper panel: western blot analysis of Ago-2 (11A9 antibody) in the FC and CB control, sCJD MM1 and VV2 cases. Four representative cases per diagnostic group and brain region are shown in the western blot. Quantifications derived from densitometry analysis were performed in 15 cases per diagnostic group (n = 15/group). β-actin was used as loading control. Densitometries of the western blots are shown. Normalization was performed relative to controls. Error bars indicate SD. Bottom panel: Gene expression levels of Ago-2 in the FC and CB of controls, sCJD MM1 and VV2 cases by RT-qPCR. Results were normalized to housekeeping genes GAPDH (figure) and GUSB with similar results. Housekeeping levels remained unaltered between groups. 10 cases per diagnostic group (n = 10/group) were analyzed. In all cases, statistical significance (compared to controls) was set at *p<0.05.
Fig 3
Fig 3. Alterations in the levels and distribution of the miRNA silencing machinery in sCJD.
(A) Western blot analysis for Ago-2 immunodetection (upper panel) and densitometry (lower panel) of the chromatography gel filtration fractions from the FC of control (n = 3) and sCJD MM1 (n = 3) cases. Western blot analysis shows a representative image of a control and a sCJD case, while densitometry shows mean values and SD of all cases studied. (B) Representative fluorescence photomicrographs of Ago immunoreactivity in the FC of control and sCJD MM1 cases. The two antibodies used (11A9 and H-300) showed similar Ago distribution between control and sCJD MM1 cases. Scale bar = 25μm (C) RT-QuIC analysis of Ago-2 immunoprecipitates (11A9) obtained from the FC of brain homogenates of control (n = 3) and sCJD MM1 (n = 3) cases. RT-QuIC assays were run in triplicate for each sample. A representative curve for each condition is shown. (D) Representative fluorescence photomicrographs of eIF3, Tia-1 and p-eIF2α(Ser51) immunoreactivity in the FC of control and sCJD MM1 cases. Scale bar for eIF3 = 10 μm and Tia-1 = 20μm, for p-eIF2α(Ser51) = 10μm (E) Western blot analysis of eIF3, Tia-1, p54/rck and dcp1a in the FC of control, sCJD MM1 and VV2 cases. Three representative cases per diagnostic group and brain region are shown in the western blot. Quantifications derived from densitometry analysis were performed in 15 cases per diagnostic group (n = 15/group). GAPDH was used as a loading control. Densitometries of the western blots are shown. Normalization was performed relative to controls. Error bars indicate SD. In all cases, statistical significance (compared to controls) was set at *p<0.05.
Fig 4
Fig 4. Altered expression levels of miRNA biogenesis components in sCJD.
(A) Gene expression levels of Drosha (n = 10), DGCR8 (n = 10) and Dicer (n = 10) in the FC and CB of controls, sCJD MM1 and VV2 cases by RT-qPCR. Results were normalized to housekeeping genes GAPDH (figure) and GUSB with similar results. Housekeeping levels remained unaltered between groups. (B) Protein levels of Drosha, DGCR8, Dicer in the FC and CB of controls, sCJD MM1 and VV2 cases, by western blot analysis. Three representative cases per diagnostic group and brain region are shown in the western blot. Quantifications derived from densitometry analysis were performed in 15 cases per diagnostic group (n = 15/group). β-actin was used as a loading control. Densitometries of the western blots are shown. Normalization was performed relative to controls. Error bars indicate SD. In all cases, statistical significance (compared to controls) was set at *p<0.05.
Fig 5
Fig 5. Neural-type miRNA profiling in sCJD.
(A) Heat map analysis of the neuron, microglia and astrocyte enriched miRNAs, whose levels were changed in the FC and CB of sCJD MM1 and VV2 cases by RNA-seq analysis. Neural-type enriched miRNAs were reported in the bibliography based on neural-type enrichment analysis (49). (B) In situ hybridization of miRNA-124-3p in the FC and CB of control and sCJD MM1 brain tissue, and of miRNAs 26a-5p and 146a-5p in the FC of sCJD MM1 brain tissue. (C) Quantification of miRNA-124-3p intensity in the FC and CB of control and sCJD MM1 neurons. >100 neurons in total were quantified for each group. Normalization was performed relative to controls. AU/neuron indicates arbitrary units quantified in the densitometry analysis for each neuron. Error bars indicate SD. Scale bar in FC = 30μm and in CB = 50μm. In all cases, statistical significance (compared to controls) was set at *p<0.05.
Fig 6
Fig 6. Analysis of commonly altered miRNAs in sCJD, AD, DLB and FFI.
(A) Venn diagrams of the comparison between altered miRNAs in AD and sCJD. Commonly deregulated miRNAs in the PFC of AD cases obtained from small RNA-seq analysis (20) (blue circles) and in the FC of sCJD cases obtained from small RNA-seq analysis in the present work (yellow circles). Common elements and percentage of maximal coincidence between groups are shown. Among these, the deregulated expression levels of miRNA-195-5p, miRNA-877-5p and miRNA-323a-5p (marked in red) were previously validated by qPCR in the FC of sCJD cases (Fig 2). (B) RT-qPCR analysis for miRNA-146a-5p, miRNA-195-5p, miRNA-342-5p, miRNA-877-5p, miRNA-323a-5p and miRNA-5701 in the FC of controls (n = 5), AD (n = 8) and rpAD (n = 6) cases. (C) RT-qPCR analysis for miRNA-146a-5p, miRNA-195-5p, miRNA-342-5p, miRNA-877-5p, miRNA-323a-5p and miRNA-5701 in the FC of controls (n = 5) and DLB (n = 5) cases. (D) RT-qPCR analysis for miRNA-342-5p, miRNA-146a-5p, miRNA-195-5p and miRNA-5701 in the FC and CB of controls (n = 3) and FFI cases (n = 3). Results were normalized to the housekeeping U6 snRNA expression, which remained unaltered between groups. Normalization was performed relative to controls. Error bars indicate SD. In all cases, statistical significance (compared to controls) was set at *p<0.05.
Fig 7
Fig 7. Regional and temporal-dependent neuropathological characteristics and miRNA signatures in the sCJD MM1 mouse model tg340-PRNP129MM.
(A) tg340 mice were inoculated with control or sCJD MM1 homogenates; cortex and CB samples were collected at different time points: 120 dpi for pre-symptomatic phase and 160 dpi, 180 dpi and 210 dpi for symptomatic phase (n = 4–5 per group). Animals sacrificed at 210 dpi were inoculated with a 10–1 inoculum dilution. (B) PET-blot analysis for the detection of PrPSc in the cortex and CB of sCJD MM1 inoculated tg340 mice at clinical disease stage. (C) Densitometric analysis of western blots developed for PSD-95 and synaptophysin in the cortex and CB of tg340 samples at different disease stages. Significant alterations on PSD-95 and synaptophysin levels between control and sCJD inoculated animals is indicated. Statistical significance was set at *p<0.05, (n = 4–5 per group). (D) Heat map analysis of key inflammatory mediators and cytokines measured with RT-qPCR analysis in the cortex and CB of control and sCJD MM1 inoculated tg340 mice at different stages of the disease. Fold change between sCJD MM1 infected and control animals is shown. (E) Hematoxylin-eosin staining in the cortex and CB of control and sCJD MM1 infected tg340 animals. (F) RT-qPCR analysis of the miRNAs validated in human sCJD tissue in the cortex and CB of tg340 mice. Samples from different time points of disease progression were analyzed. Fold change between sCJD MM1 infected and control animals is shown. Results were normalized to the housekeeping gene U6 snRNA expression. U6 levels remained unaltered between groups. Normalization was performed relative to controls. Error bars indicate SD. In all cases, statistical significance (compared to controls) was set at *p<0.05.
Fig 8
Fig 8. miRNA profiling in the CSF of control and sCJD cases.
RT-qPCR analysis of the housekeeping U6 snRNA (A) and miRNA-378a-3p, miRNA-26a-5p and miRNA-204-5p (B) in the CSF of control (n = 12) and sCJD cases (n = 12). Samples were normalized by the relative expression of the housekeeping small nuclear RNA U6, which showed stable Ct values between the studied groups. Statistical significance was set at *p<0.05.

Similar articles

Cited by

References

    1. Puoti G, Bizzi A, Forloni G, Safar JG, Tagliavini F, Gambetti P. Sporadic human prion diseases: Molecular insights and diagnosis. Lancet Neurol. 2012;11: 618–628. doi: 10.1016/S1474-4422(12)70063-7 - DOI - PubMed
    1. Gambetti P, Kong Q, Zou W, Parchi P, Chen SG. Sporadic and familial CJD: Classification and characterisation. British Medical Bulletin. 2003. pp. 213–239. doi: 10.1093/bmb/66.1.213 - DOI - PubMed
    1. Parchi P, De Boni L, Saverioni D, Cohen ML, Ferrer I, Gambetti P, et al. Consensus classification of human prion disease histotypes allows reliable identification of molecular subtypes: An inter-rater study among surveillance centres in Europe and USA. Acta Neuropathol. 2012;124: 517–529. doi: 10.1007/s00401-012-1002-8 - DOI - PMC - PubMed
    1. Parchi P, Giese a, Capellari S, Brown P, Schulz-Schaeffer W, Windl O, et al. Classification of sporadic Creutzfeldt-Jakob disease based on molecular and phenotypic analysis of 300 subjects. Ann Neurol. 1999;46: 224–233. doi: 10.1002/1531-8249(199908)46:2<224::AID-ANA12>3.0.CO;2-W - DOI - PubMed
    1. Llorens F, Lopez-Gonzalez I, Thune K, Carmona M, Zafar S, Andeoletti O, et al. Subtype and regional-specific neuroinflammation in sporadic creutzfeldt-jakob disease. Front Aging Neurosci. 2014;6 doi: 10.3389/fnagi.2014.00198 - DOI - PMC - PubMed

Publication types

Supplementary concepts