

ApoL1 renal risk variants induce aberrant THP-1 monocyte differentiation and increase eicosanoid production via enhanced expression of cyclooxygenase-2
- PMID: 29357411
- PMCID: PMC6087794
- DOI: 10.1152/ajprenal.00254.2017
ApoL1 renal risk variants induce aberrant THP-1 monocyte differentiation and increase eicosanoid production via enhanced expression of cyclooxygenase-2
Abstract
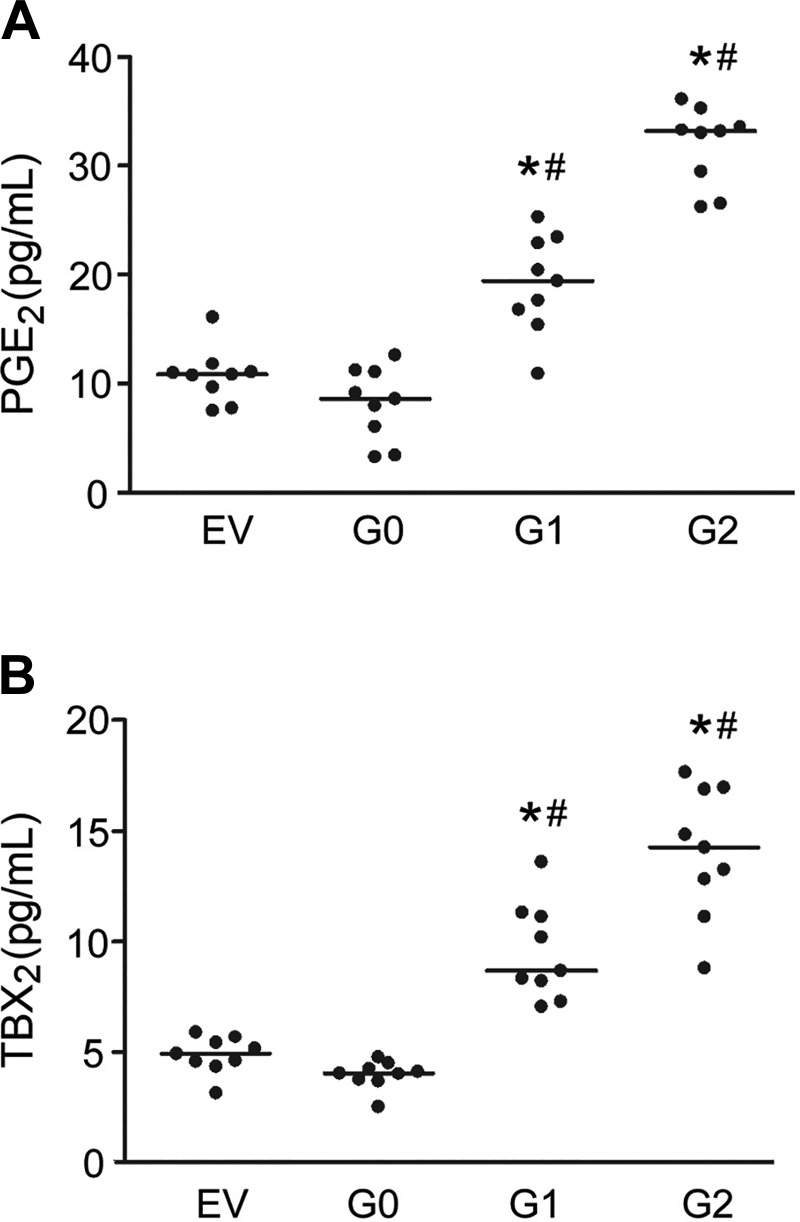
Apolipoprotein L1 ( ApoL1) genetic variants are strongly associated with kidney diseases. We investigated the role of ApoL1 variants in monocyte differentiation and eicosanoid production in macrophages, as activated tissue macrophages in kidney might contribute to kidney injury. In human monocyte THP-1 cells, transient overexpression of ApoL1 (G0, G1, G2) by transfection resulted in a 5- to 11-fold increase in CD14 and CD68 gene expression, similar to that seen with phorbol-12-myristate acetate treatment. All ApoL1 variants caused monocytes to differentiate into atypical M1 macrophages with marked increase in M1 markers CD80, TNF, IL1B, and IL6 and modest increase in the M2 marker CD163 compared with control cells. ApoL1-G1 transfection induced additional CD206 and TGFB1 expression, and ApoL1-G2 transfection induced additional CD204 and TGFB1 expression. Gene expression of prostaglandin E2 (PGE2) synthase and thromboxane synthase and both gene and protein expression of cyclooxygenase-2 (COX-2) were increased by ApoL1-G1 and -G2 variants compared with -G0 transfection. Higher levels of PGE2 and thromboxane B2, a stable metabolite of thromboxane A2, and transforming growth factor (TGF)-β1 were released into the supernatant of cultured THP-1 cells transfected with ApoL1-G1 and -G2, but not -G0. The increase in PGE2, thromboxane B2, and TGF-β1 was inhibited by COX-2-specific inhibitor CAY10404 but not by COX-1-specific inhibitor SC-560. These results demonstrate a novel role of ApoL1 variants in the regulation of monocyte differentiation and eicosanoid metabolism, which could modify the immune response and promote inflammatory signaling within the local targeted organs and tissues including the kidney.
Keywords: TGF-β1; apolipoprotein L1; cyclooxygenase-2; macrophage polarization.
Figures


Similar articles
-
APOL1 renal risk variants promote cholesterol accumulation in tissues and cultured macrophages from APOL1 transgenic mice.PLoS One. 2019 Apr 18;14(4):e0211559. doi: 10.1371/journal.pone.0211559. eCollection 2019. PLoS One. 2019. PMID: 30998685 Free PMC article.
-
Paracrine up-regulation of monocyte cyclooxygenase-2 by platelets: role of transforming growth factor-beta1.Cardiovasc Res. 2007 May 1;74(2):270-8. doi: 10.1016/j.cardiores.2006.12.013. Epub 2006 Dec 23. Cardiovasc Res. 2007. PMID: 17250815
-
Effects of hypoxia on monocyte inflammatory mediator production: Dissociation between changes in cyclooxygenase-2 expression and eicosanoid synthesis.J Biol Chem. 2003 Oct 3;278(40):38607-16. doi: 10.1074/jbc.M305944200. Epub 2003 Jul 21. J Biol Chem. 2003. Retraction in: J Biol Chem. 2018 Dec 28;293(52):20013. doi: 10.1074/jbc.RX118.007017. PMID: 12874281 Retracted.
-
Cyclooxygenase-2-prostaglandin E2-eicosanoid receptor inflammatory axis: a key player in Kaposi's sarcoma-associated herpes virus associated malignancies.Transl Res. 2013 Aug;162(2):77-92. doi: 10.1016/j.trsl.2013.03.004. Epub 2013 Apr 6. Transl Res. 2013. PMID: 23567332 Free PMC article. Review.
-
APOL1 polymorphisms and kidney disease: loss-of-function or gain-of-function?Am J Physiol Renal Physiol. 2019 Jan 1;316(1):F1-F8. doi: 10.1152/ajprenal.00426.2018. Epub 2018 Oct 17. Am J Physiol Renal Physiol. 2019. PMID: 30332315 Free PMC article. Review.
Cited by
-
Poly-(ADP-ribose) polymerases inhibition by olaparib attenuates activities of the NLRP3 inflammasome and of NF-κB in THP-1 monocytes.PLoS One. 2024 Feb 9;19(2):e0295837. doi: 10.1371/journal.pone.0295837. eCollection 2024. PLoS One. 2024. PMID: 38335214 Free PMC article.
-
APOL1 C-Terminal Variants May Trigger Kidney Disease through Interference with APOL3 Control of Actomyosin.Cell Rep. 2020 Mar 17;30(11):3821-3836.e13. doi: 10.1016/j.celrep.2020.02.064. Cell Rep. 2020. PMID: 32187552 Free PMC article.
-
Serum-integrated omics reveal the host response landscape for severe pediatric community-acquired pneumonia.Crit Care. 2023 Mar 1;27(1):79. doi: 10.1186/s13054-023-04378-w. Crit Care. 2023. PMID: 36859478 Free PMC article.
-
Role of Apolipoprotein L1 in Human Parietal Epithelial Cell Transition.Am J Pathol. 2018 Nov;188(11):2508-2528. doi: 10.1016/j.ajpath.2018.07.025. Epub 2018 Sep 8. Am J Pathol. 2018. PMID: 30201495 Free PMC article.
-
Macrophage polarization in innate immune responses contributing to pathogenesis of chronic kidney disease.BMC Nephrol. 2020 Jul 13;21(1):270. doi: 10.1186/s12882-020-01921-7. BMC Nephrol. 2020. PMID: 32660446 Free PMC article. Review.
References
-
- Bautista-García P, Sánchez-Lozada LG, Cristóbal-García M, Tapia E, Soto V, Avila-Casado MC, Márquez-Velasco R, Bojalil R, Franco M, Herrera-Acosta J. Chronic inhibition of NOS-2 ameliorates renal injury, as well as COX-2 and TGF-beta 1 overexpression in 5/6 nephrectomized rats. Nephrol Dial Transplant 21: 3074–3081, 2006. doi: 10.1093/ndt/gfl444. - DOI - PubMed
-
- Beckerman P, Bi-Karchin J, Park AS, Qiu C, Dummer PD, Soomro I, Boustany-Kari CM, Pullen SS, Miner JH, Hu CA, Rohacs T, Inoue K, Ishibe S, Saleem MA, Palmer MB, Cuervo AM, Kopp JB, Susztak K. Transgenic expression of human ApoL1 risk variants in podocytes induces kidney disease in mice. Nat Med 23: 429–438, 2017. doi: 10.1038/nm.4287. - DOI - PMC - PubMed
Publication types
MeSH terms
Substances
Grants and funding
LinkOut - more resources
Full Text Sources
Other Literature Sources
Research Materials
Miscellaneous