. 2018 Apr 1;119(4):1340-1355.
doi: 10.1152/jn.00168.2017. Epub 2017 Dec 27.

Transmitter release site organization can predict synaptic function at the neuromuscular junction

Affiliations

Transmitter release site organization can predict synaptic function at the neuromuscular junction

Rozita Laghaei et al. J Neurophysiol. .

Abstract

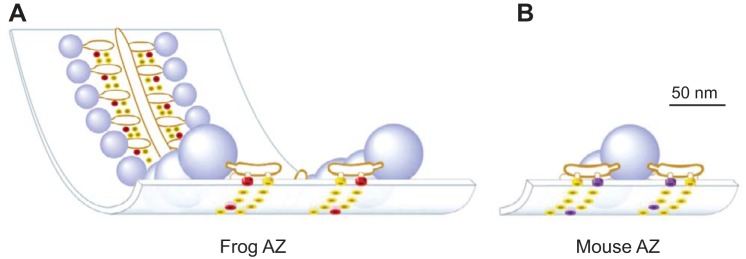
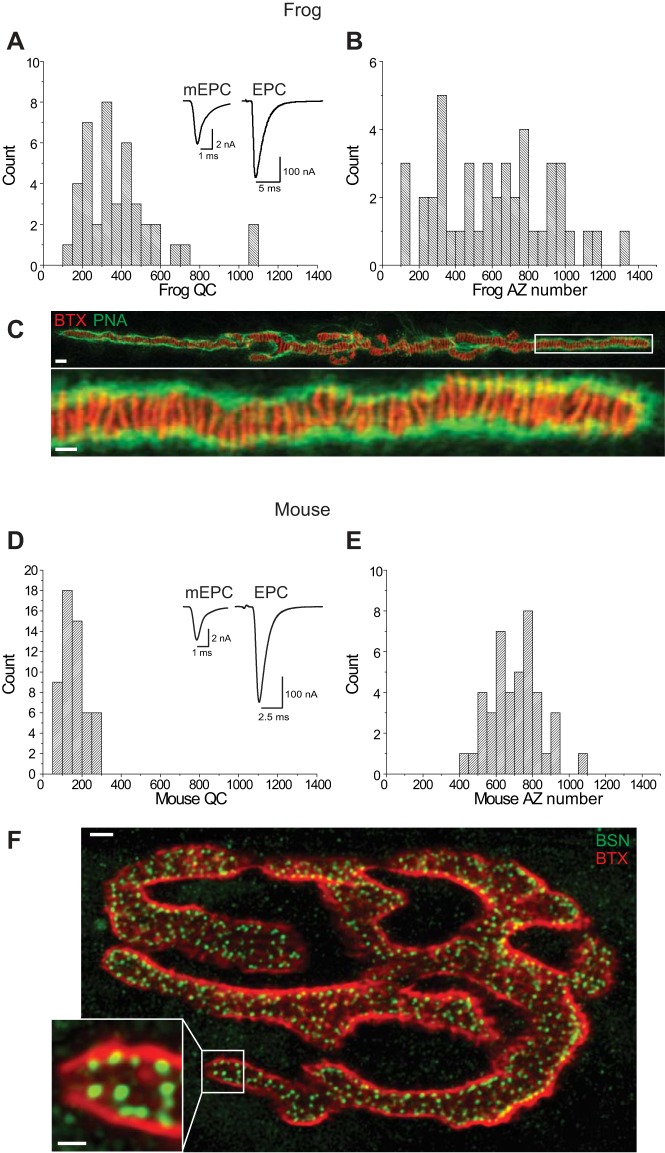
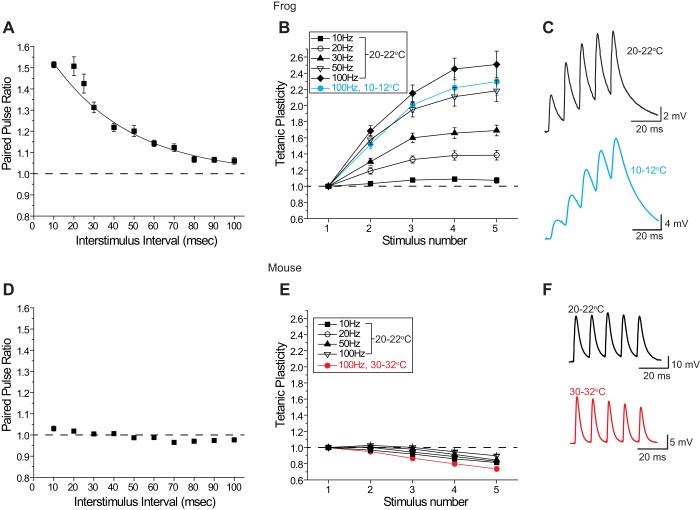
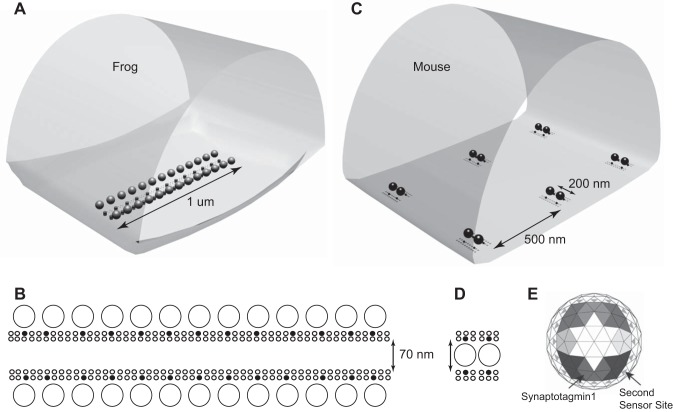
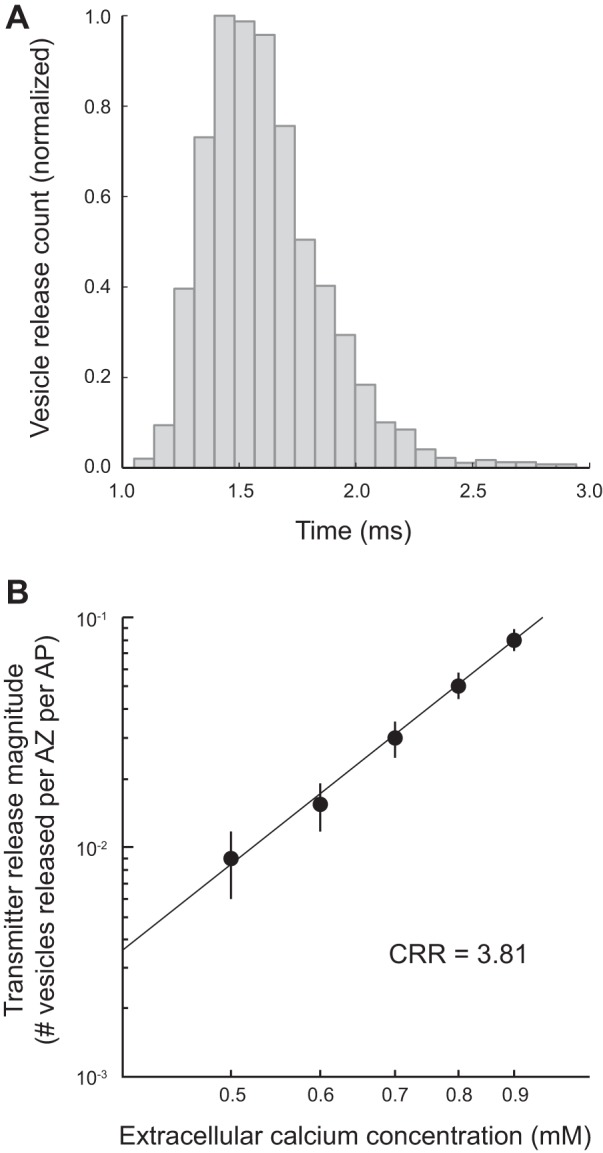
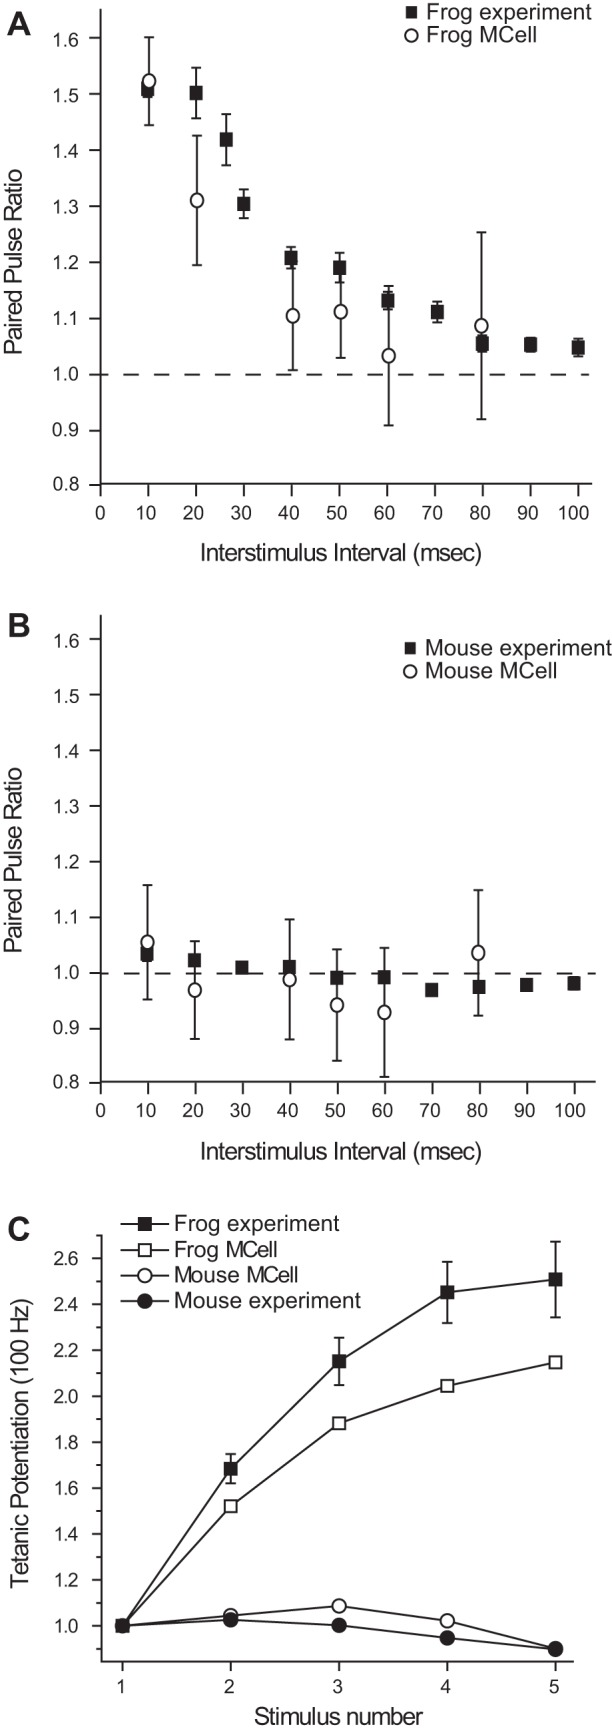
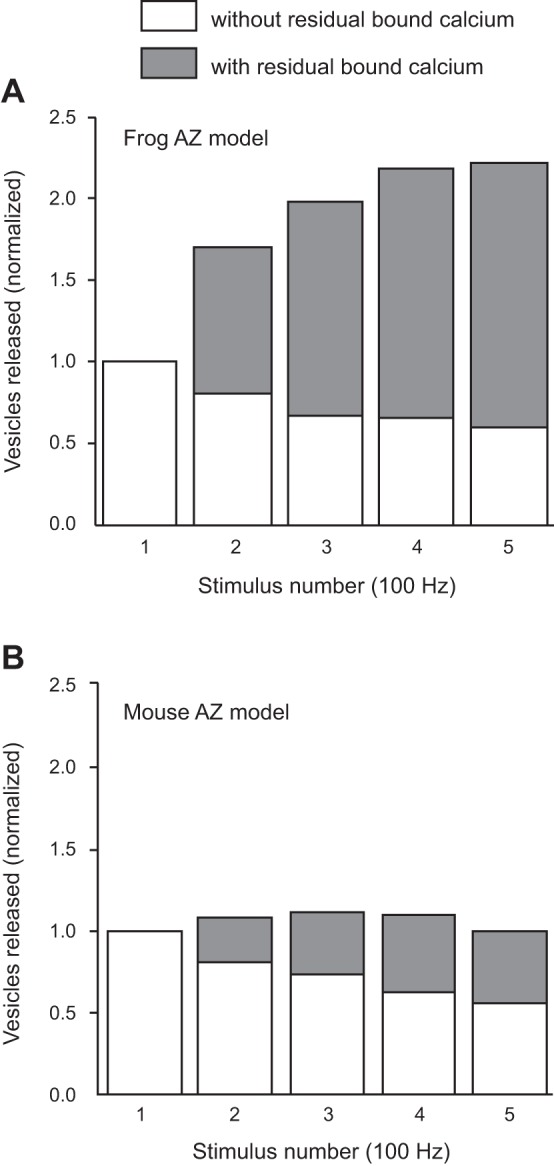
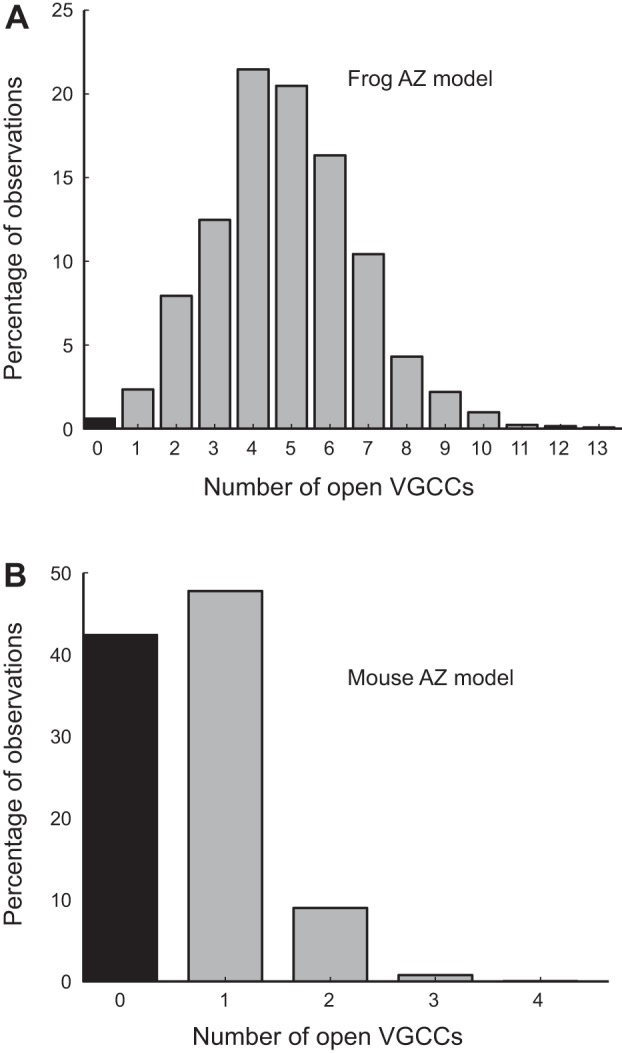
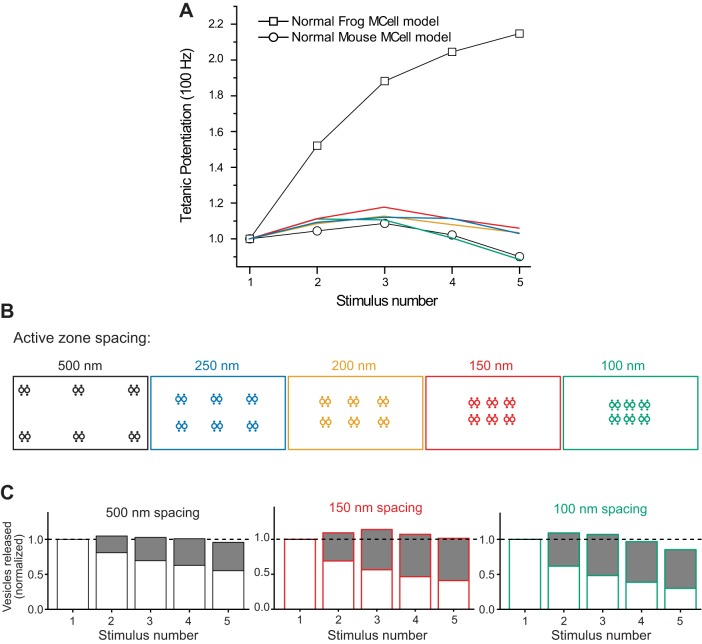
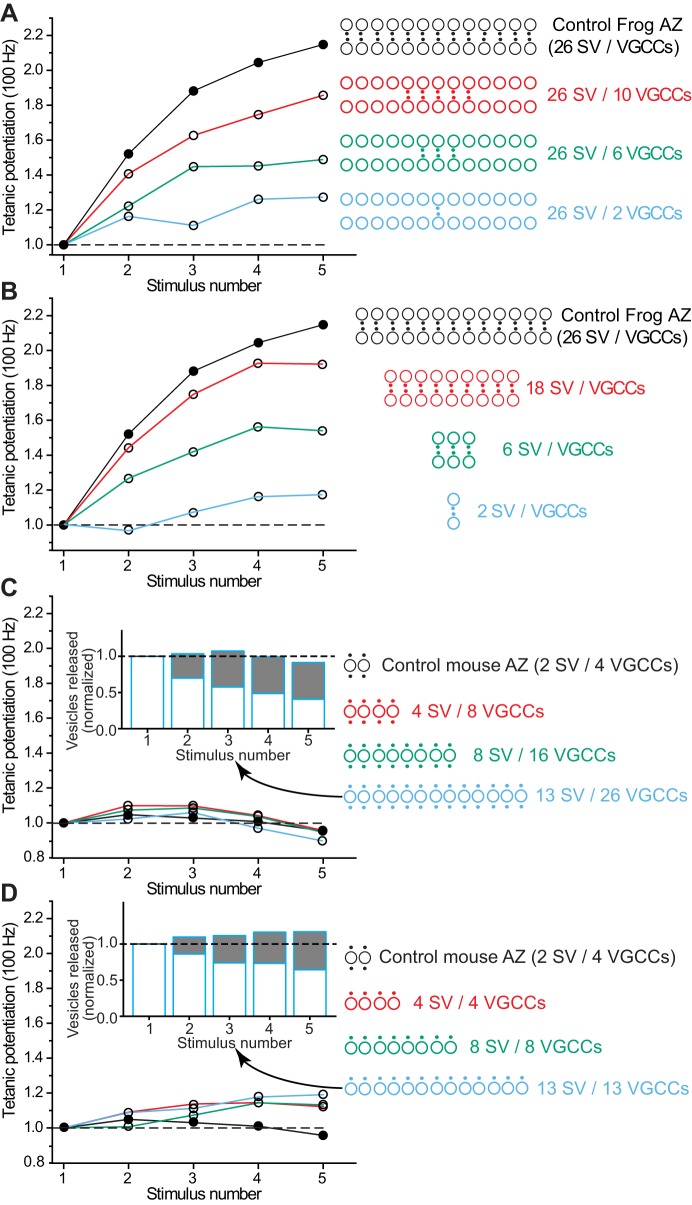
We have investigated the impact of transmitter release site (active zone; AZ) structure on synaptic function by physically rearranging the individual AZ elements in a previously published frog neuromuscular junction (NMJ) AZ model into the organization observed in a mouse NMJ AZ. We have used this strategy, purposefully without changing the properties of AZ elements between frog and mouse models (even though there are undoubtedly differences between frog and mouse AZ elements in vivo), to directly test how structure influences function at the level of an AZ. Despite a similarly ordered ion channel array substructure within both frog and mouse AZs, frog AZs are much longer and position docked vesicles in a different location relative to AZ ion channels. Physiologically, frog AZs have a lower probability of transmitter release compared with mouse AZs, and frog NMJs facilitate strongly during short stimulus trains in contrast with mouse NMJs that depress slightly. Using our computer modeling approach, we found that a simple rearrangement of the AZ building blocks of the frog model into a mouse AZ organization could recapitulate the physiological differences between these two synapses. These results highlight the importance of simple AZ protein organization to synaptic function. NEW & NOTEWORTHY A simple rearrangement of the basic building blocks in the frog neuromuscular junction model into a mouse transmitter release site configuration predicted the major physiological differences between these two synapses, suggesting that transmitter release site structure and organization is a strong predictor of function.

Keywords: active zone; neuromuscular junction; transmitter release.


Figures

Fig. 1.
Fig. 1.
Schematic diagrams of single active zone (AZ) organization within the frog (A) and mouse (B) neuromuscular junction (NMJ) based on electron microscopy data. Blue spheres = docked synaptic vesicles. Yellow disks = AZ membrane proteins of unknown identity. Red disks = Cav 2.2 type VGCCs. Purple disks = Cav 2.1 type VGCCs. [Adapted from Urbano et al. 2003 with permission from National Academy of Sciences. Copyright (2003) National Academy of Sciences, U.S.A.]
Fig. 2.
Fig. 2.
Quantal content and AZ number at frog and mouse NMJs. A: histogram plot of the distribution of quantal content (QC) measurements determined using 2-electrode voltage clamp at frog NMJs. Inset shows sample mEPP (left; average of 300 events) and EPP (right; average of 15 events) recordings. B: histogram plot of the distribution of AZ numbers measured across frog NMJs. C: representative image of a frog NMJ stained with Alexa-488 peanut lectin (PNA, green) to outline synapses, and Alexa-594 α-bungarotoxin (BTX, red) to stain postsynaptic acetylcholine receptors and predict the location of AZs (red stripes). White box in the top image identifies the region that is enlarged in the bottom image. Scale bars = 5 µm (top) and 2 µm (bottom). D: histogram plot of the distribution of quantal content measurements determined using 2-electrode voltage clamp at mouse NMJs. Inset shows sample mEPP (left; average of 300 events) and EPP (right; average of 15 events) recordings. E: histogram plot of the distribution of AZ numbers measured across mouse NMJs. F: representative image of a mouse NMJ stained with Alexa-488 conjugated secondary antibody that recognized an anti-bassoon primary antibody to identify the location of AZs (BSN, green), and Alexa-594 α-bungarotoxin (BTX, red) to stain postsynaptic acetylcholine receptors and identify the extent of each NMJ. White box in the larger image identifies the region that is enlarged in the inset image. Scale bars = 5 µm (large image) and 2 µm (inset).
Fig. 3.
Fig. 3.
Short-term plasticity measured at frog (A–C) and mouse (D–F) NMJs. A: plot of the changes in paired-pulse ratio (EPP2/EPP1) at the frog NMJ when 2 stimuli were delivered at varying interstimulus intervals (10–100 ms). Paired-pulse facilitation is very sensitive to interstimulus interval at the frog NMJ. B: plot of tetanic potentiation, normalized to the amplitude of the first EPP (EPPx/EPP1), when 5 stimuli were delivered to the frog motor nerve at varying frequencies (10–100 Hz). Data plotted in black were collected at room temperature (20–22°C); data plotted in blue were recorded at 10–12°C. The magnitude of tetanic potentiation is very sensitive to stimulus frequency at the frog NMJ. C: sample EPPs recorded from a frog NMJ during a 100-Hz stimulus train at 20–22°C (black) and 10–12°C (blue). D: plot of the changes in paired-pulse ratio (EPP2/EPP1) at the mouse NMJ when 2 stimuli were delivered at varying interstimulus intervals (10–100 ms). Paired-pulse facilitation is minimal and relatively insensitive to interstimulus interval at the mouse NMJ. E: plot of tetanic potentiation, normalized to the amplitude of the first EPP (EPPx/EPP1), when 5 stimuli were delivered to the mouse motor nerve at varying frequencies (10–100 Hz). Data plotted in black were collected at room temperature (20–22°C); data plotted in red were recorded at 30–32°C. At the mouse NMJ, mild tetanic potentiation gives way to mild depression at room temperature, and this form of short-term plasticity is relatively insensitive to stimulus frequency. Mild depression persists even at warmer temperatures (30–32°C). F: sample EPPs recorded from a mouse neuromuscular junction during a 100-Hz stimulus train at 20–22°C (black) and 30–32°C (red).
Fig. 4.
Fig. 4.
Diagrams of MCell models used for frog and mouse active zones. A: visualization output of the geometry used for the frog AZ MCell model. A single AZ is modeled along with the surrounding intraterminal space. The walls of this space are reflective to simulate the potential contribution from neighboring AZs. B: organization of elements within the modeled frog AZ. A total of 26 docked synaptic vesicles (large circles) are positioned laterally and adjacent to two double rows of membrane proteins (small circles), some of which (filled circles) are VGCCs. C: visualization output of the geometry used for the mouse AZ MCell model. A total of six AZs are modeled along with the surrounding intraterminal space. The walls of this space are reflective to simulate the potential contribution from neighboring AZs. D: organization of elements within the modeled mouse AZ. A total of 2 docked synaptic vesicles (large circles) are positioned between two double rows of membrane proteins (small circles), some of which (filled circles) are VGCCs. E: the undersurface of each docked synaptic vesicle is populated with the Ca2+ binding sites of eight synaptotagmin 1 molecules (shaded large triangles; differences in shading depict the 5 binding sites for each of the 8 synaptotagmin 1 molecules), and 16 second Ca2+ sensor sites (small gray triangles). The kinetic values for Ca2+ ion binding to these sites are reported in Ma et al. (2015).
Fig. 5.
Fig. 5.
Distribution of transmitter release latencies and the Ca2+-release relationship (CRR) predicted by the mouse MCell model. A: histogram plot of the time course of single vesicle release events in the mouse MCell model following a presynaptic action potential closely matching previously published physiology data (Wang et al. 2010). B: plot of the changes in the magnitude of transmitter release (number of vesicles released per AZ per AP) as the extracellular Ca2+ concentration was varied in the mouse MCell model. When plotted on a log scale, these data are fit by line with a slope of 3.81, closely matching the known 4th-order relationship between extracellular Ca2+ and transmitter release.
Fig. 6.
Fig. 6.
Differences in short-term plasticity observed between frog and mouse NMJs are reproduced by a simple rearrangement in the organization of elements in the frog MCell model into the organization observed in the mouse AZ. A and B: plot of changes in the paired-pulse ratio at the frog (A) and mouse (B) NMJ when the interstimulus interval is changed. The experimental data collected (filled squares) are closely matched by the MCell simulation data (open circles) in both cases. C: plot of tetanic potentiation at 100 Hz in the frog (filled squares) and mouse (filled circles) is closely matched by MCell simulation of the frog AZ (open squares) and the mouse AZ (open circles) models.
Fig. 7.
Fig. 7.
Differences between frog and mouse MCell AZ models in the fraction of vesicle fusion events that included residual bound Ca2+ ions. A: in the frog AZ model, the vesicles that fuse during a train of action potentials at 100 Hz have a strongly increasing fraction of Ca2+ ions that remain bound from a prior action potential stimulus. B: in the mouse AZ model, there are fewer vesicle fusion events that are partially triggered by residual bound Ca2+ ions than observed in the frog model (A).
Fig. 8.
Fig. 8.
The number of VGCCs that open in frog and mouse AZ MCell models. Although both frog and mouse AZ models have VGCCs with a Po during an action potential of ~0.2, since the frog AZ has 26 VGCCs, the average number of VGCCs that open during an action potential in the frog AZ model (A) is much greater than in the mouse AZ model (B). Within one AZ in the mouse model, more than 40% of action potentials do not open any VGCCs (black bar; B), and most action potentials open only one VGCC. Within the frog AZ model, most action potential stimuli open 3–7 VGCCs, and failures (black bar; A) are rare.
Fig. 9.
Fig. 9.
The impact on tetanic potentiation of moving modeled mouse AZs closer together. A: plot of tetanic potentiation during a 100-Hz action potential train. Open squares and circles recapitulate the control MCell model data for frog and mouse AZs (see Fig. 6C). Plots in blue, yellow, red, and green represent short-term plasticity for the model in which the 6 modeled AZs are 250, 200, 150, and 100 nm apart from one another as color coded in the diagrams in B. C: plots of the fraction of vesicle fusion events that included residual bound Ca2+ ions (as described in Fig. 7) for 3 AZ spacing arrangements that resulted in the extremes in short-term synaptic plasticity at the modeled mouse AZ (500, 150, and 100 nm AZ spacing, and color coded as in A and B).
Fig. 10.
Fig. 10.
The impact on tetanic potentiation of altering the length of modeled frog and mouse AZs. A: the control frog model (filled circles) generates strong tetanic potentiation during a 100-Hz stimulus train, but this potentiation significantly weakens as the number of VGCCs is reduced (open circles). The diagrams at the right depict the organization of VGCCs (black dots) relative to synaptic vesicles (large open circles) as VGCCs are removed (plots and diagrams are color coded for clarity). B: the control frog model (filled circles) generates strong tetanic potentiation during a 100-Hz stimulus train, but this potentiation significantly weakens as the number of both VGCCs and docked synaptic vesicles are reduced. The diagrams at the right depict the organization of VGCCs (black dots) and synaptic vesicles (large open circles) as both are removed (plots and diagrams are color coded for clarity). C: the control mouse model (filled circles) generates mild tetanic depression during a 100-Hz stimulus train, and this mild depression does not change significantly as the mouse AZ arrangement is lengthened (adding two VGCCs for each additional docked synaptic vesicle). The diagrams at the right depict the organization of VGCCs (black dots) and docked synaptic vesicles (large open circles) as both are added (plots and diagrams are color coded for clarity). Inset: plot of the fraction of vesicle fusion events that included residual bound Ca2+ ions for the longest AZ plotted in blue. D: the control mouse model (filled circles) generates mild tetanic depression during a 100-Hz stimulus train, but this mild depression reverses to mild tetanic potentiation when the mouse AZ arrangement is changed and lengthened by only adding one VGCC for each docked synaptic vesicle. The diagrams at the right depict the organization of VGCCs (black dots) and docked synaptic vesicles (large open circles) as both are added (plots and diagrams are color coded for clarity). Inset: plot of the fraction of vesicle fusion events that included residual bound Ca2+ ions for the longest AZ plotted in blue.

References

    1. Adams BA. Temperature and synaptic efficacy in frog skeletal muscle. J Physiol 408: 443–455, 1989. doi:10.1113/jphysiol.1989.sp017469. - DOI - PMC - PubMed
    1. Althof D, Baehrens D, Watanabe M, Suzuki N, Fakler B, Kulik Á. Inhibitory and excitatory axon terminals share a common nano-architecture of their Cav2.1 (P/Q-type) Ca2+ channels. Front Cell Neurosci 9: 315, 2015. doi:10.3389/fncel.2015.00315. - DOI - PMC - PubMed
    1. Barrett EF, Barrett JN, Botz D, Chang DB, Mahaffey D. Temperature-sensitive aspects of evoked and spontaneous transmitter release at the frog neuromuscular junction. J Physiol 279: 253–273, 1978. doi:10.1113/jphysiol.1978.sp012343. - DOI - PMC - PubMed
    1. Baur D, Bornschein G, Althof D, Watanabe M, Kulik A, Eilers J, Schmidt H. Developmental tightening of cerebellar cortical synaptic influx-release coupling. J Neurosci 35: 1858–1871, 2015. doi:10.1523/JNEUROSCI.2900-14.2015. - DOI - PMC - PubMed
    1. Becker B, Klein EM, Striepens N, Mihov Y, Schlaepfer TE, Reul J, Goossens L, Schruers K, Kendrick KM, Hurlemann R. Nicotinic acetylcholine receptors contribute to learning-induced metaplasticity in the hippocampus. J Cogn Neurosci 25: 986–997, 2013. doi:10.1162/jocn_a_00383. - DOI - PubMed

Publication types

LinkOut - more resources