

Evolution of ventricular hypertrophy and myocardial mechanics in physiological and pathological hypertrophy
- PMID: 29357486
- PMCID: PMC6397414
- DOI: 10.1152/japplphysiol.00199.2016
Evolution of ventricular hypertrophy and myocardial mechanics in physiological and pathological hypertrophy
Abstract
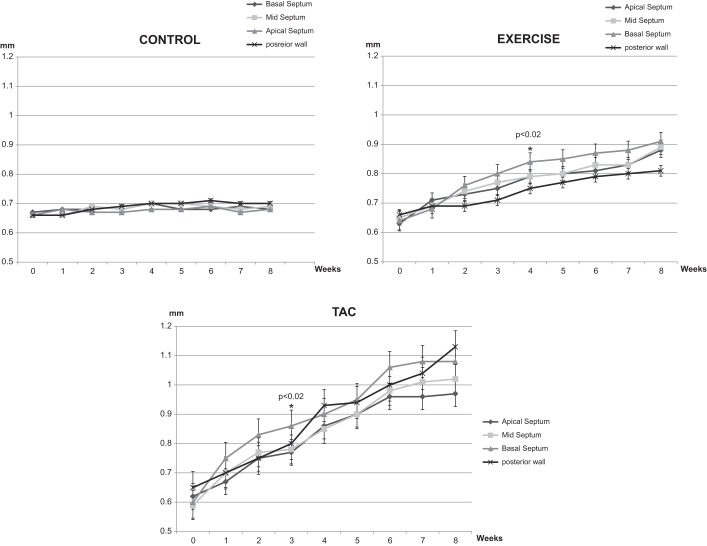
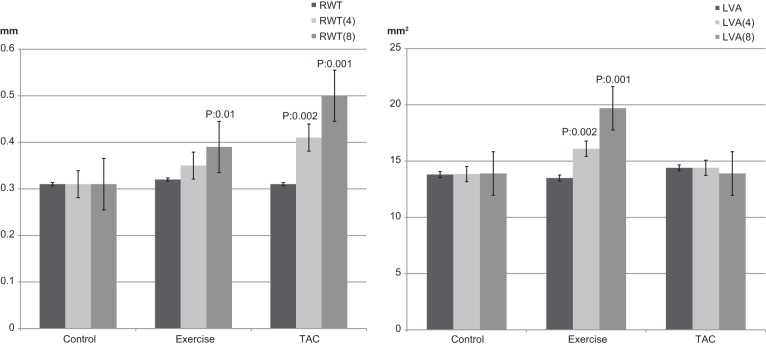
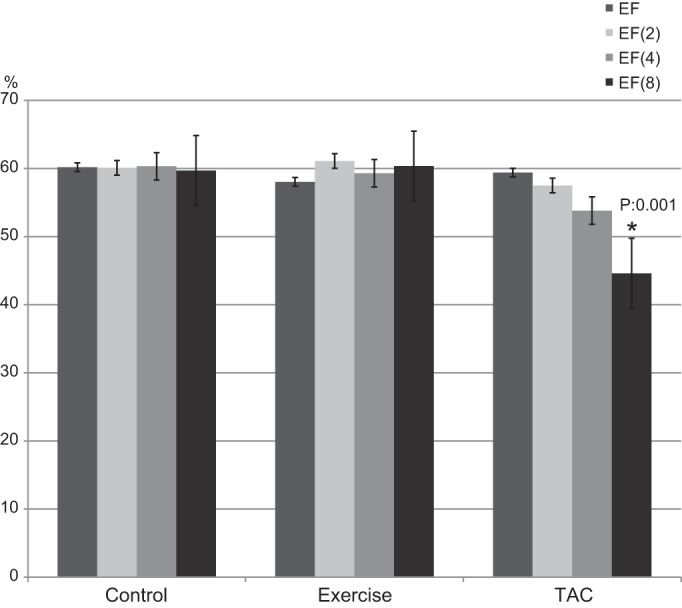
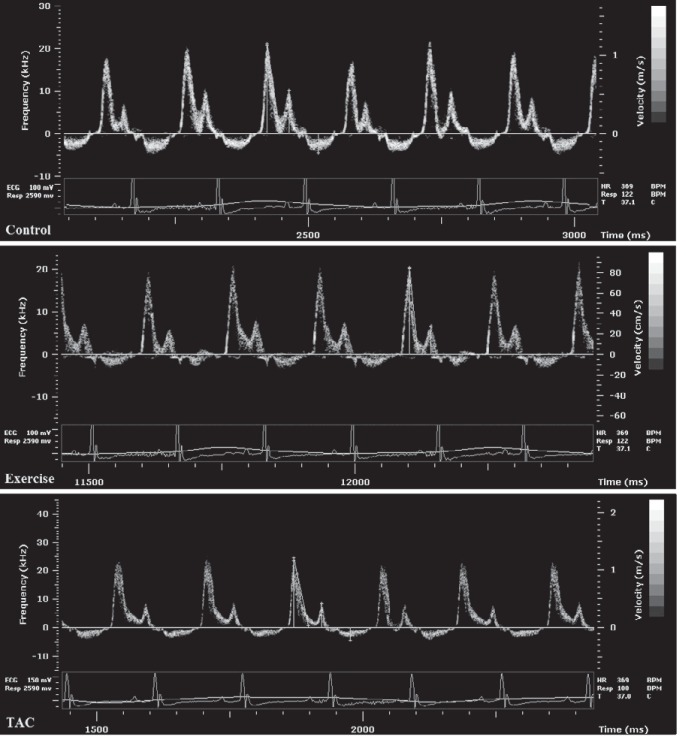
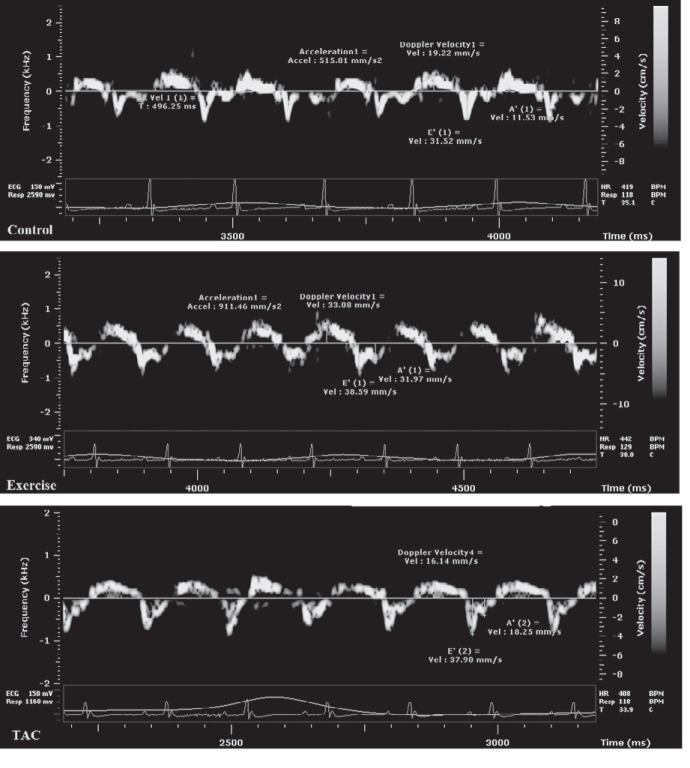
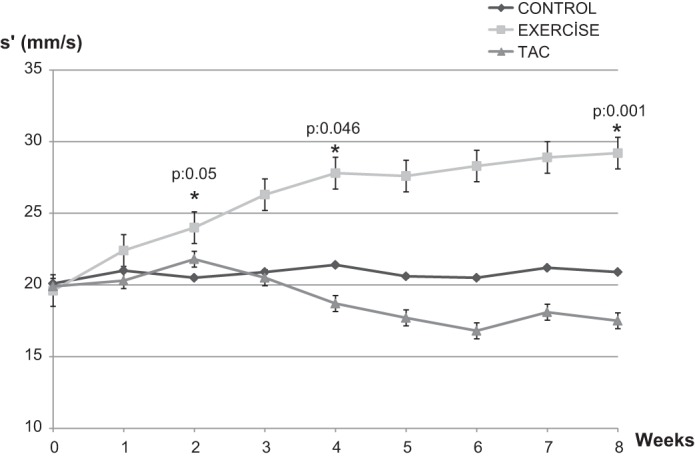
Left ventricular hypertrophy (LVH) is an adaptive response to physiological or pathological stimuli, and distinguishing between the two has obvious clinical implications. However, asymmetric septal hypertrophy and preserved cardiac function are noted in early stages in both cases. We characterized the early anatomic and functional changes in a mouse model of physiological and pathological stress using serial echocardiography-based morphometry and tissue velocity imaging. Weight-matched CF-1 male mice were separated into Controls ( n = 10), treadmill Exercise 1 h daily for 5 days/wk ( n = 7), and transverse aortic constriction (TAC, n = 7). Hypertrophy was noted first in the left ventricle basal septum compared with other segments in Exercise (0.84 ± 0.02 vs. 0.79 ± 0.03 mm, P = 0.03) and TAC (0.86 ± 0.05 vs. 0.77 ± 0.04 mm, P = 0.02) at 4 and 3 wk, respectively. At 8 wk, eccentric LVH was noted in Exercise and concentric LVH in TAC. Septal E/E' ratio increased in TAC (32.6 ± 3.7 vs. 37 ± 6.2, P = 0.002) compared with the Controls and Exercise (32.3 ± 5.2 vs. 32.8 ± 3.8 and 31.2 ± 4.9 vs. 28.2 ± 5.0, respectively, nonsignificant for both). Septal s' decreased in TAC (21 ± 3.6 vs. 17 ± 4.2 mm/s, P = 0.04) but increased in Exercise (19.6 ± 4.1 vs. 29.2 ± 2.3 mm/s, P = 0.001) and was unchanged in Controls (20.1 ± 4.2 vs. 20.9 ± 5.1 mm/s, nonsignificant). With similar asymmetric septal hypertrophy and normal global function during the first 4-8 wk of pathological and physiological stress, there is an early marginal increase with subsequent decrease in systolic tissue velocity in pathological but early and progressive increase in physiological hypertrophy. Tissue velocities may help adjudicate between these two states when there are no overt anatomic or functional differences. NEW & NOTEWORTHY Pathological and physiological stress-induced ventricular hypertrophy have different clinical connotations but present with asymmetric septal hypertrophy and normal global function in their early stages. We observed a marginal but statistically significant decrease in systolic tissue velocity in pathological but progressive increase in velocity in physiological hypertrophy. Tissue velocity imaging could be an important tool in the management of asymmetric septal hypertrophy by adjudicating between these two etiologies when there are no overt anatomic or functional differences.
Keywords: basal septal hypertrophy; early imaging biomarker; left ventricular remodeling; microimaging; pathological stress; physiological stress.
Conflict of interest statement
No conflicts of interest, financial or otherwise, are declared by the authors.
Figures
References
-
- Baltabaeva A, Marciniak M, Bijnens B, Moggridge J, He FJ, Antonios TF, MacGregor GA, Sutherland GR. Regional left ventricular deformation and geometry analysis provides insights in myocardial remodelling in mild to moderate hypertension. Eur J Echocardiogr 9: 501–508, 2008. doi:10.1016/j.euje.2007.08.004. - DOI - PubMed
Publication types
MeSH terms
LinkOut - more resources
Full Text Sources
Other Literature Sources