. 2018 Jan-Dec:10:1759091417753802.
doi: 10.1177/1759091417753802.

Stuck in a State of Inattention? Functional Hyperconnectivity as an Indicator of Disturbed Intrinsic Brain Dynamics in Adolescents With Concussion: A Pilot Study

Affiliations

Stuck in a State of Inattention? Functional Hyperconnectivity as an Indicator of Disturbed Intrinsic Brain Dynamics in Adolescents With Concussion: A Pilot Study

Angela M Muller et al. ASN Neuro. 2018 Jan-Dec.

Abstract

Sports-related concussion in youth is a major public health issue. Evaluating the diffuse and often subtle changes in structure and function that occur in the brain, particularly in this population, remains a significant challenge. The goal of this pilot study was to evaluate the relationship between the intrinsic dynamics of the brain using resting-state functional magnetic resonance imaging (rs-fMRI) and relate these findings to structural brain correlates from diffusion tensor imaging in a group of adolescents with sports-related concussions ( n = 6) and a group of healthy adolescent athletes ( n = 6). We analyzed rs-fMRI data using a sliding windows approach and related the functional findings to structural brain correlates by applying graph theory analysis to the diffusion tensor imaging data. Within the resting-state condition, we extracted three separate brain states in both groups. Our analysis revealed that the brain dynamics in healthy adolescents was characterized by a dynamic pattern, shifting equally between three brain states; however, in adolescents with concussion, the pattern was more static with a longer time spent in one brain state. Importantly, this lack of dynamic flexibility in the concussed group was associated with increased nodal strength in the left middle frontal gyrus, suggesting reorganization in a region related to attention. This preliminary report shows that both the intrinsic brain dynamics and structural organization are altered in networks related to attention in adolescents with concussion. This first report in adolescents will be used to inform future studies in a larger cohort.

Keywords: adolescents; attention; concussion; intrinsic dynamics; multimodal magnetic resonance imaging; networks; rich club.


Figures
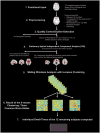
Figure 1.
Figure 1.
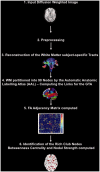
Visual representation of the processing and analysis steps for the fMRI data. fMRI = functional magnetic resonance imaging.
Figure 2.
Figure 2.
Visual representation of the processing and analysis steps for the DTI data. GTA = graph theoretical analysis; DTI = diffusion tensor imaging; FA = fractional anisotropy.
Figure 3.
Figure 3.
The 24 ICA components selected for the SWA. Figure 3 shows the 24 ICA components that were used for the subsequent SWA grouped by their subsystem membership. The ICs forming the primary-perception-production subsystem are highlighted by blue-colored labels in the figure: C06 = primary visual network (PrimVis); C23 = higher visual network (HighVis); C39 = bilateral lingual gyrus network (Ling); C38 = bilateral inferior occipital gyrus network (IOG); C25 = precuneus network (Precun); C11 = bilateral sensorimotor network (SM); C04 = bilateral paracentral network (Paracent); C02 = bilateral rolandic operculum network (RolOp); C09 = bilateral auditory network (Aud). The ICs forming the In-Output-Attention interface are highlighted by orange-colored labels in the figure: C07 = anterior cingulate network (ACC); C17 = bilateral posterior insula (pIns) network; C08 = bilateral supplementary motor area (SMA); C28 = dorsal attention network (DAN); C29 = frontoparietal network (FPN); C31 = right pars triangularis network (rTriang); C26 = bilateral inferior frontal gyrus network (bilIFG); C32 = bilateral middle frontal gyrus network (bilMFG). The ICs constituting the higher cognition functions subsystem are highlighted by recolored labels in the figure: C12 = right executive-control network (RECN); C24 = left executive-control network (LECN); C05 = language network (Lang); C20 = bilateral fusiform gyrus network (Fus); C30 = bilateral posterior middle temporal gyrus network (pMTG); C03 = posterior DMN (pDMN); C21 = anterior DMN (aDMN). SWA = sliding windows analysis; ICA = independent component analysis; ICs = independent components.
Figure 4.
Figure 4.
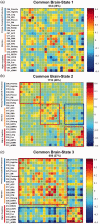
The three brain states. (a–c) The different network configurations of the three brain states that were extracted using k-mean clustering of the 2,400 windows (200 windows of 30 TRs = 60s length for each of the 12 participants) that were analyzed in the context of the SWA. The cluster matrixes show the 24 ICs arranged in three groups; group membership is indicated by colored bars on the left side (blue = ICs representing primary perception [auditory and visual] and production [motion] networks, orange = ICs representing attention networks, and red representing higher order cognitive network). Red rectangles highlight positive correlations or coupling between networks/ICs, and blue rectangles highlight negative correlations or decoupling between the networks/ICs. Further, positive correlations between networks/ICs and subsystems are coded in warm/red colors, and negative correlations between networks/ICs and subsystems in cold/blue colors. SWA = sliding windows analysis; IC = independent components; IOG = inferior occipital gyrus; ACC = anterior cingulate; SMA = supplementary motor area; DAN = dorsal attention network; FPN = frontoparietal network; LECN = left executive-control network; RECN = right executive-control network; aDMN = anterior default mode network; pDMN = posterior default mode network; MTG = middle temporal gyrus.
Figure 5.
Figure 5.
Mean dwell time versus brain states. Illustration of the group-specific differences in dwell time. While the healthy controls spent about the same time in each of the brain states, the concussion group spent most of the time during the resting-state scan in Brain State 2 and clearly less time in the Brain States 1 and 3. The t test revealed groupwise significant differences between the dwell times for Brain States 2 and 3. The concussion group spent significantly more time in Brain State 2 (t = 2.62; p = .0254) than the healthy controls, and the latter spent significantly more time in Brain State 3 (t = 2.532; p = .0302) than the concussion group. TBI = traumatic brain injury; HC = healthy control; SEM = standard error of the mean.
Figure 6.
Figure 6.
Weighted rich club distribution of the adolescents diagnosed with concussion and the healthy controls. RC = rich club.
Figure 7.
Figure 7.
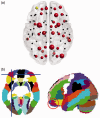
Illustration of the rich club members in the healthy controls. (a) Localization of the analyzed rich club nodes in the healthy controls. The red color indicates a rich club node, the size of the red nodes relates to their degree. Yellow marks the node in the most rostral part of left middle frontal gyrus whose value in nodal strength value was significantly associated (Spearman’s r = −.86) with the subjects’ dwell time in Brain State 3. (b) Localization (regions highlighted by red circle) of the node in the AAL template.

Similar articles

Cited by

References

    1. Agarwal S., Stamatakis E. A., Geva S., Warburton E. A. (2016) Dominant hemisphere functional networks compensate for structural connectivity loss to preserve phonological retrieval with aging. Brain Behav 6(9): e00495. - PMC - PubMed
    1. Anderson V., Spencer-Smith M., Leventer R., Coleman L., Anderson P., Williams J., Greenham M., Jacobs R. (2009) Childhood brain insult: Can age at insult help us predict outcome? Brain A J Neurol 132: 45–56. - PubMed
    1. Ashburner J. (2007) A fast diffeomorphic image registration algorithm. Neuroimage 38: 95–113. - PubMed
    1. Barker-Collo S., Jones K., Theadom A., Sarkey N., Dowell A., McPherson K., Ameratunga S., Dudley M., Te Ao B., Feigin V. (2015) Neuropsychological outcome and its correlates in the first year after adult mild traumatic brain injury: A population-based New Zealand study. Brain Inj 29(13–14): 1604–1616. - PubMed
    1. Barlow K. M., Crawford S., Stevenson A., Sandhu S. S., Belanger F., Dewey D. (2010) Epidemiology of postconcussion syndrome in pediatric mild traumatic brain injury. Pediatrics 126: e374–e381. - PubMed

Publication types

MeSH terms

LinkOut - more resources