. 2018 Feb 13;10(2):375-389.
doi: 10.1016/j.stemcr.2017.12.018. Epub 2018 Jan 18.

Isogenic FUS-eGFP iPSC Reporter Lines Enable Quantification of FUS Stress Granule Pathology that Is Rescued by Drugs Inducing Autophagy

Affiliations

Isogenic FUS-eGFP iPSC Reporter Lines Enable Quantification of FUS Stress Granule Pathology that Is Rescued by Drugs Inducing Autophagy

Lara Marrone et al. Stem Cell Reports. .

Abstract

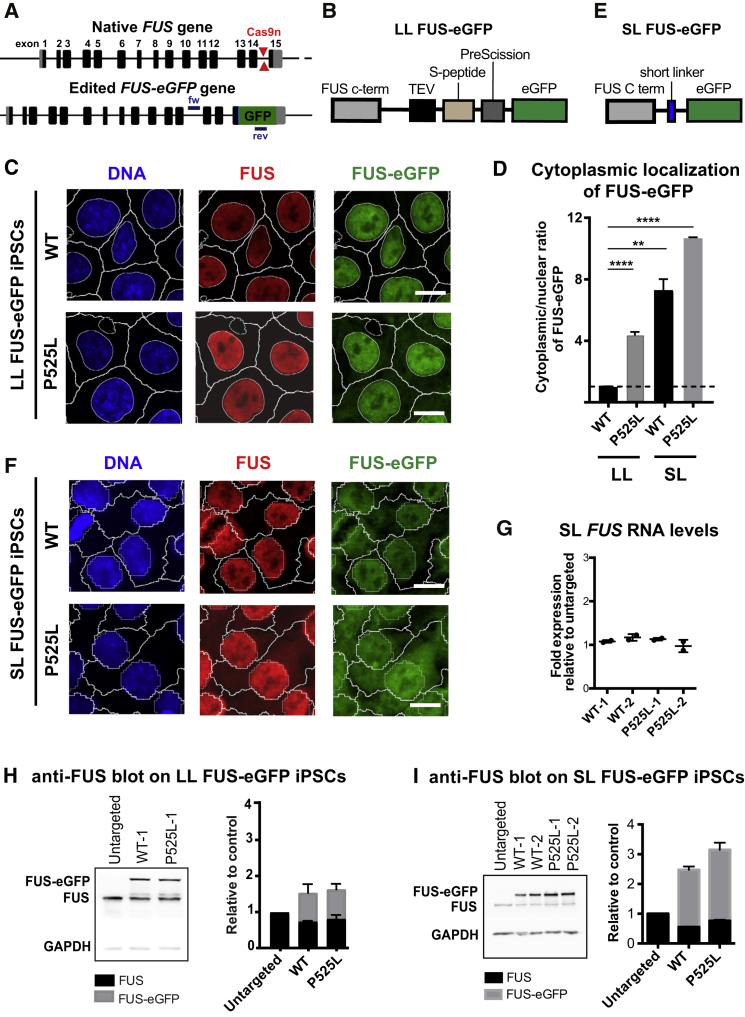
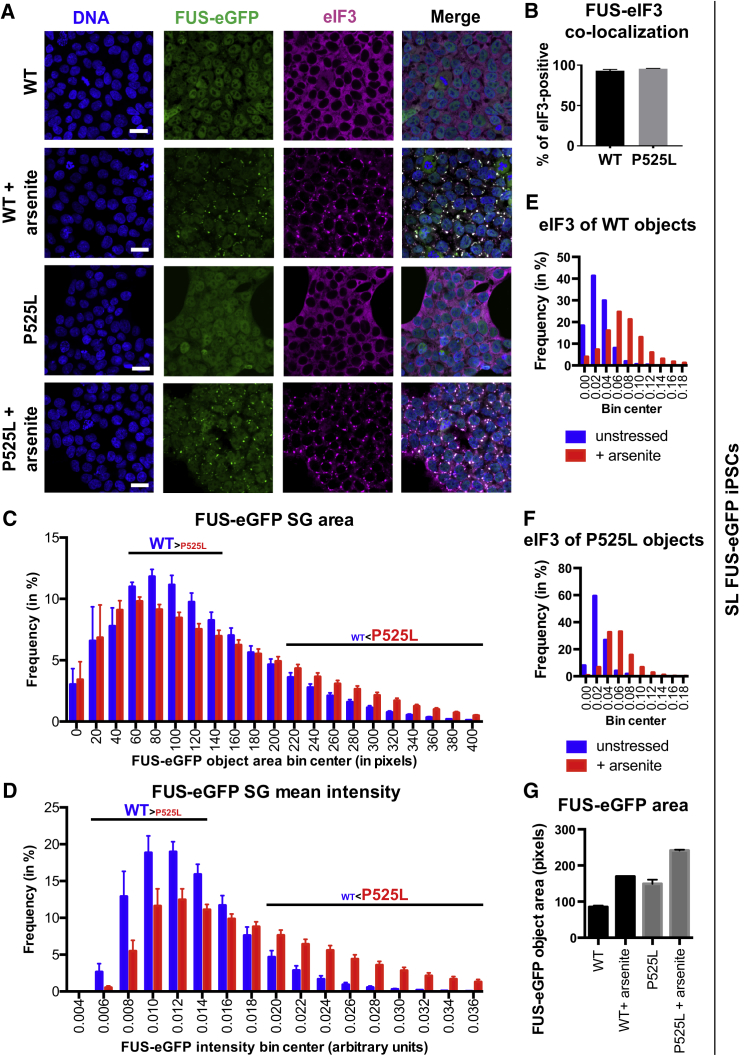
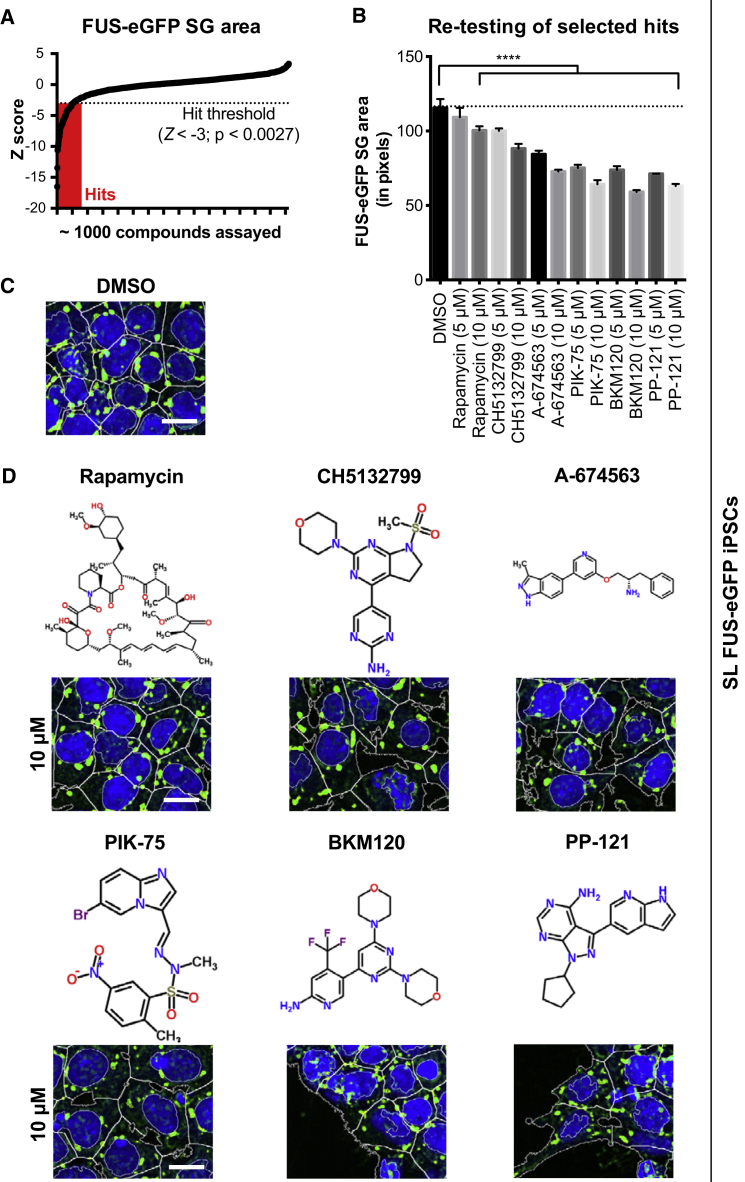
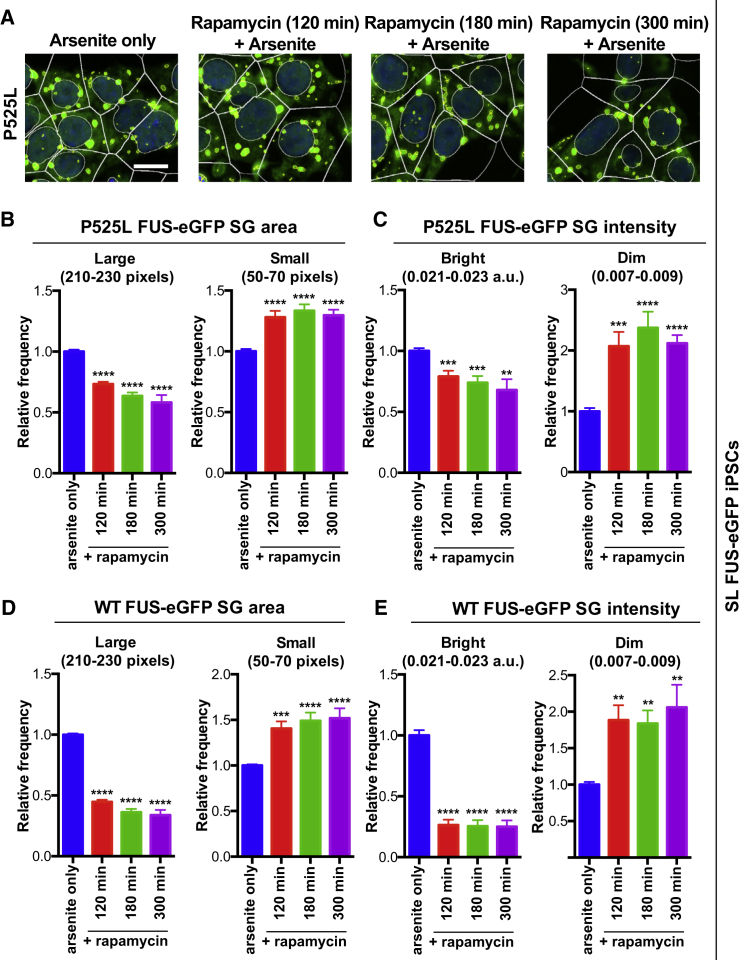
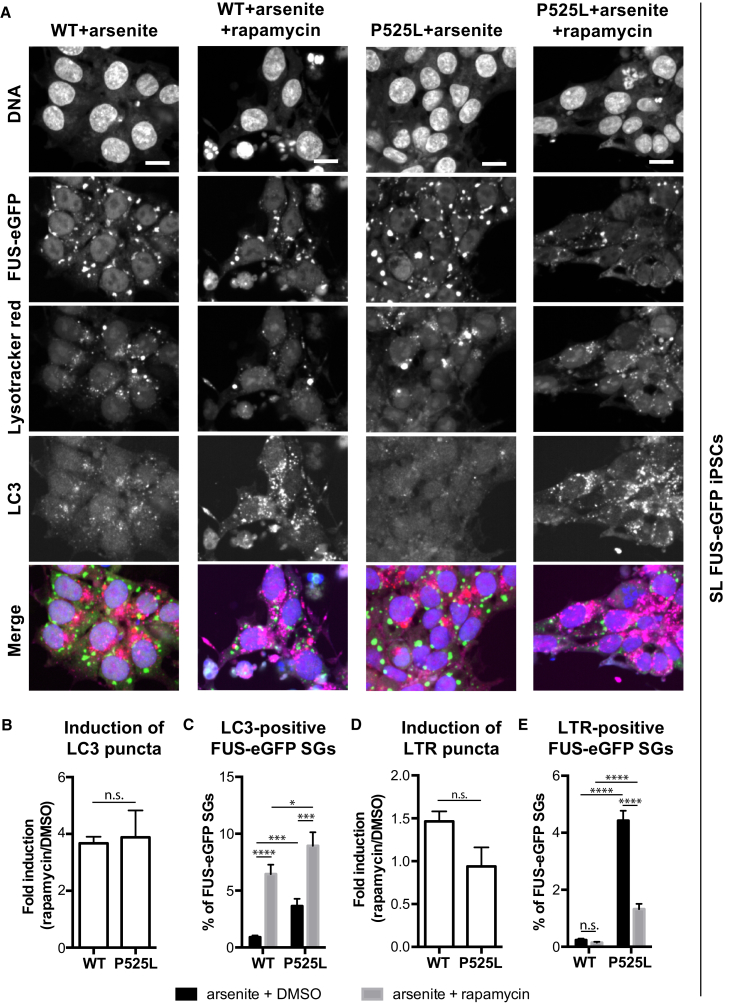
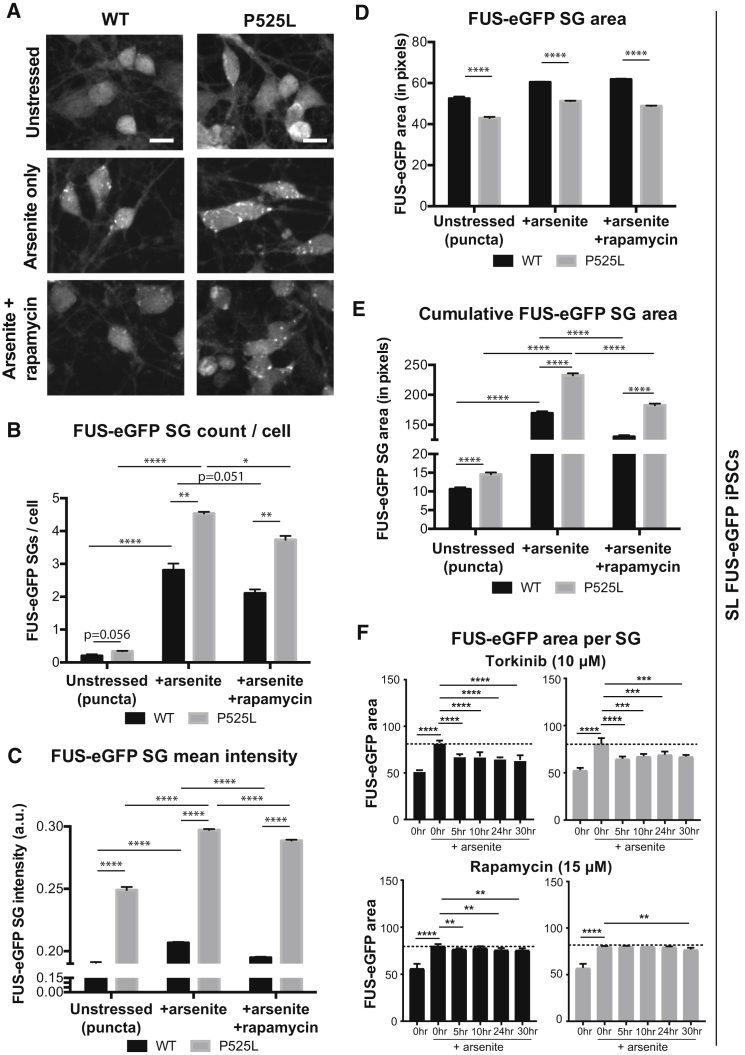
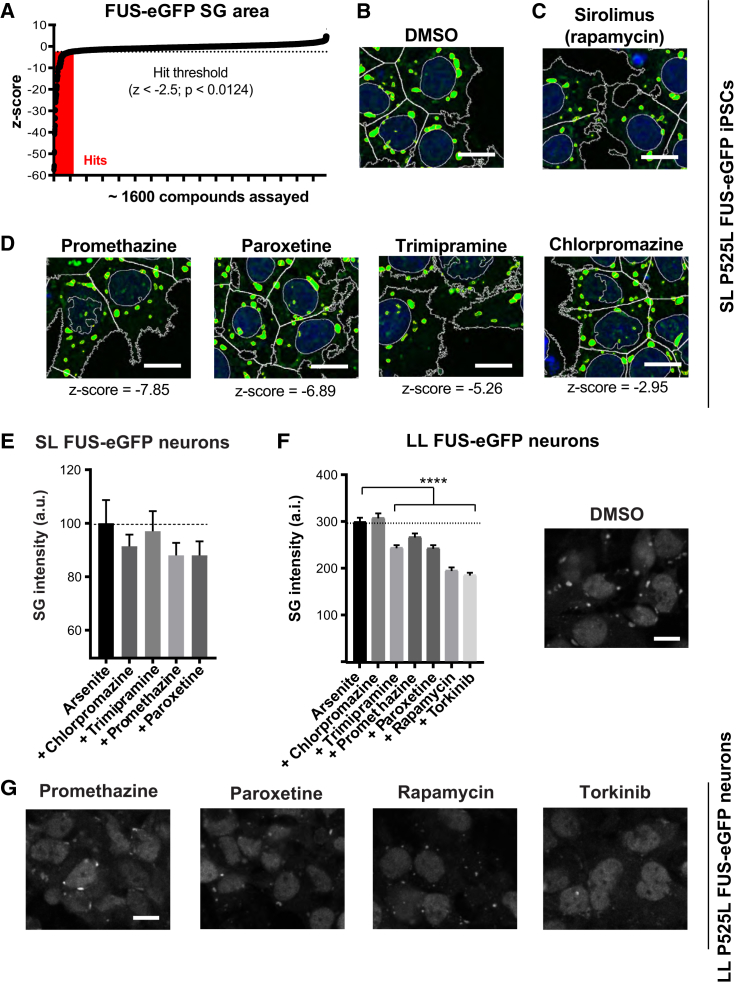
Perturbations in stress granule (SG) dynamics may be at the core of amyotrophic lateral sclerosis (ALS). Since SGs are membraneless compartments, modeling their dynamics in human motor neurons has been challenging, thus hindering the identification of effective therapeutics. Here, we report the generation of isogenic induced pluripotent stem cells carrying wild-type and P525L FUS-eGFP. We demonstrate that FUS-eGFP is recruited into SGs and that P525L profoundly alters their dynamics. With a screening campaign, we demonstrate that PI3K/AKT/mTOR pathway inhibition increases autophagy and ameliorates SG phenotypes linked to P525L FUS by reducing FUS-eGFP recruitment into SGs. Using a Drosophila model of FUS-ALS, we corroborate that induction of autophagy significantly increases survival. Finally, by screening clinically approved drugs for their ability to ameliorate FUS SG phenotypes, we identify a number of brain-penetrant anti-depressants and anti-psychotics that also induce autophagy. These drugs could be repurposed as potential ALS treatments.

Keywords: CRISPR/Cas9n; FUS; amyotrophic lateral sclerosis; autophagy; gene editing; induced pluripotent stem cells; stress granules.


Figures

Figure 1
Figure 1
Generation of FUS-eGFP Reporter iPSCs (A–F) Examples of FUS gene before and after gene editing to insert eGFP (A). Cas9n cut sites are shown with locations of primers used for genotyping. Schematic representation of the linkers used to knock in eGFP in LL (B) and SL (E) iPSC lines. Confocal micrographs showing FUS localization in WT and P525L FUS-eGFP cells for LL (C) and SL (F). Nuclear and cytoplasmic segmentation is displayed. Scale bar, 10 μm. (D) Quantification of the FUS-eGFP cytoplasmic-nuclear ratio in WT and P525L FUS-eGFP LL and SL iPSCs. All values are expressed as fold relative to LL WT FUS-eGFP iPSCs. Data represent results from three independent measurements. Error bars indicate SD. ∗∗p < 0.01 and ∗∗∗∗p < 0.0001. (G–I) qRT-PCR showing total FUS RNA levels (G). WB and relative quantification using an anti-FUS antibody showing expression of FUS and FUS-eGFP in LL (H) and SL (I) iPSCs. Results are shown for two different WT and P525L lines as biological replicates and were reproduced in three independent experiments. Error bars indicate SD.
Figure 2
Figure 2
Characterization of Stress Granules in WT and P525L FUS-eGFP SL iPSCs (A) Confocal micrographs demonstrating that iPSCs form FUS-eGFP SGs that co-localize with eIF3. Scale bar, 20 μm. (B–G) Quantification of SGs positive for FUS-eGFP in WT and P525L iPSCs (B). Error bars indicate SD. Histograms are shown for the frequency of WT and P525L FUS-eGFP SG area (C) and mean intensity (D). In contrast to SGs, FUS-eGFP puncta do not co-localize with eIF3-positive structures (E and F) and display smaller size (G). Data represent results from three independent experiments.
Figure 3
Figure 3
Identification of Compounds Reducing P525L FUS-eGFP SG Area in SL iPSCs (A) Results for ∼1,000 compounds on P525L FUS-eGFP SG area arranged in ascending order. Compounds were considered as hits when Z < −3. (B–D) Validation of selected compounds at 5 and 10 μM for their effects on P525L FUS-eGFP SG area (B). Each time, images were acquired from at least six positions/well from three different wells per line. Error bars indicate SEM. ∗∗∗∗p < 0.0001. Example micrographs are shown for DMSO control (C) and selected hit compounds (D). Chemical structures for the selected compounds were downloaded from ChemSpider. Scale bar, 10 μm.
Figure 4
Figure 4
Rapamycin Treatment Ameliorates P525L FUS-eGFP SG Pathology in SL iPSCs (A) Confocal micrographs of P525L FUS-eGFP iPSCs treated with 15 μM rapamycin for time indicated. Arsenite was added for the final 1 hr. Scale bar, 10 μm. Individual FUS-eGFP drops were segmented and quantified by binning. The relative frequency of each bin was compared with 1 hr of arsenite only. (B) Rapamycin treatment reduces P525L FUS-eGFP droplet area. (C) Rapamycin treatment reduces P525L FUS-eGFP SG intensity. (D and E) WT iPSCs respond more promptly to rapamycin than P525L. (D) Droplet area. (E) Intensity. n = 3 independent experiments, and in each experiment images were acquired from at least six positions/well from four different wells per line. Error bars indicate SEM. ∗∗p < 0.01, ∗∗∗p < 0.001, and ∗∗∗∗p < 0.0001.
Figure 5
Figure 5
Induction of Autophagy Rescues P525L FUS-eGFP SG Pathology in iPSCs (A) Confocal micrographs of WT and P525L FUS-eGFP SL iPSCs treated with 15 μM rapamycin for 5 hr. Arsenite was added for the final 1 hr. LysoTracker red labels lysosomes, LC3 immunostaining highlights autophagosomes. Scale bar, 10 μm. (B) Two hours of rapamycin increases LC3 puncta per cell relative to DMSO. (C) Analysis of the frequency of LC3-positive FUS-eGFP SGs after 5 hr of rapamycin. (D) Increased frequency of LTR-positive puncta per cell upon rapamycin treatment for 2 hr relative to DMSO. (E) Analysis of the frequency of LTR-positive FUS-eGFP SGs after rapamycin treatment for 5 hr. All experiments used arsenite for 1 hr. n = 3 independent experiments, and images were acquired from at least six positions/well from four different wells per line. Error bars indicate SEM. p < 0.05, ∗∗∗p < 0.001, and ∗∗∗∗p < 0.0001.
Figure 6
Figure 6
Rapamycin Rescues P525L FUS-eGFP SG Pathology in SL iPSC-Derived Neurons (A) Fluorescence confocal micrographs of P525L FUS-eGFP iPSC-derived neurons treated with 15 μM rapamycin in the presence of arsenite stress. Scale bar, 10 μm. Individual FUS-eGFP objects were identified and quantified. n = 3. (B) Neurons with P525L FUS-eGFP have significantly more SGs per cell compared with WT and rapamycin reduces overall numbers. (C) Neurons with P525L FUS-eGFP have significantly brighter SGs compared with WT. Rapamycin significantly decreases the brightness of WT and P525L FUS-eGFP SGs. (D and E) P525L FUS-eGFP SGs in iPSC-derived neurons are significantly smaller compared with WT (D). However, total area of FUS-eGFP SGs per cell is significantly increased in neurons with P525L (E). (F) Comparison of torkinib and rapamycin effect on neuronal SG area. Torkinib (top) significantly reduces SG area in both WT (left) and P525L (right) FUS-eGFP neurons after 5 hr of treatment. Rapamycin (bottom) is effective at the tested concentration only upon 24 hr treatment in P525L neurons (right). Effects on SG area appear earlier in WT cells (left), but are not as strong as under torkinib treatment. Error bars indicate SEM. p < 0.05, ∗∗p < 0.01, ∗∗∗p < 0.001, and ∗∗∗∗p < 0.0001.
Figure 7
Figure 7
Identification of Drugs for Repurposing (A–D) Chart of Z scores from drug screen identifying US FDA-approved drugs able to reduce SG area (A). Representative images are shown for DMSO control in (B), sirolimus in (C), and selected anti-depressants and anti-psychotics in (D). Scale bars, 10 μm. (E) SL P525L FUS-eGFP neurons treated with chlorpromazine, paroxetine, promethazine, and trimipramine show a slight reduction in FUS SG intensity. Error bars represent SEM. (F and G) LL P525L FUS-eGFP neurons treated with the indicated compounds show a reduction in FUS SG intensity (F), which is significant for paroxetine, promethazine, rapamycin, and torkinib as displayed in the respective confocal micrographs (G). Scale bar, 10 μm. n = 3 independent experiments and in each experiment, images were acquired from three positions/well from three different wells per line. Error bars represent SEM. ∗∗p < 0.01, ∗∗∗p < 0.001, and ∗∗∗∗p < 0.0001.

References

    1. Barmada S.J., Serio A., Arjun A., Bilican B., Daub A., Ando D.M., Tsvetkov A., Pleiss M., Li X., Peisach D. Autophagy induction enhances TDP43 turnover and survival in neuronal ALS models. Nat. Chem. Biol. 2014;10:677–685. - PMC - PubMed
    1. Buchan J.R., Kolaitis R.M., Taylor J.P., Parker R. Eukaryotic stress granules are cleared by autophagy and Cdc48/VCP function. Cell. 2013;153:1461–1474. - PMC - PubMed
    1. Conte A., Lattante S., Zollino M., Marangi G., Luigetti M., Del Grande A., Servidei S., Trombetta F., Sabatelli M. P525L FUS mutation is consistently associated with a severe form of juvenile amyotrophic lateral sclerosis. Neuromuscul. Disord. 2012;22:73–75. - PubMed
    1. Daigle J.G., Lanson N.A., Jr., Smith R.B., Casci I., Maltare A., Monaghan J., Nichols C.D., Kryndushkin D., Shewmaker F., Pandey U.B. RNA-binding ability of FUS regulates neurodegeneration, cytoplasmic mislocalization and incorporation into stress granules associated with FUS carrying ALS-linked mutations. Hum. Mol. Genet. 2013;22:1193–1205. - PMC - PubMed
    1. Dormann D., Rodde R., Edbauer D., Bentmann E., Fischer I., Hruscha A., Than M.E., Mackenzie I.R., Capell A., Schmid B. ALS-associated fused in sarcoma (FUS) mutations disrupt Transportin-mediated nuclear import. EMBO J. 2010;29:2841–2857. - PMC - PubMed

Publication types

MeSH terms