. 2018 Apr 15;78(8):2065-2080.
doi: 10.1158/0008-5472.CAN-17-0123. Epub 2018 Jan 22.

Small-Molecule Activators of Protein Phosphatase 2A for the Treatment of Castration-Resistant Prostate Cancer

Affiliations

Small-Molecule Activators of Protein Phosphatase 2A for the Treatment of Castration-Resistant Prostate Cancer

Kimberly McClinch et al. Cancer Res. .

Abstract

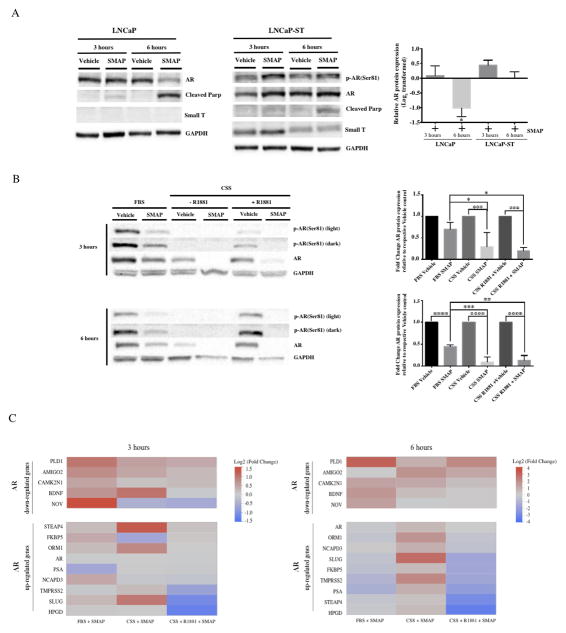
Primary prostate cancer is generally treatable by androgen deprivation therapy, however, later recurrences of castrate-resistant prostate cancer (CRPC) that are more difficult to treat nearly always occur due to aberrant reactivation of the androgen receptor (AR). In this study, we report that CRPC cells are particularly sensitive to the growth-inhibitory effects of reengineered tricyclic sulfonamides, a class of molecules that activate the protein phosphatase PP2A, which inhibits multiple oncogenic signaling pathways. Treatment of CRPC cells with small-molecule activators of PP2A (SMAP) in vitro decreased cellular viability and clonogenicity and induced apoptosis. SMAP treatment also induced an array of significant changes in the phosphoproteome, including most notably dephosphorylation of full-length and truncated isoforms of the AR and downregulation of its regulatory kinases in a dose-dependent and time-dependent manner. In murine xenograft models of human CRPC, the potent compound SMAP-2 exhibited efficacy comparable with enzalutamide in inhibiting tumor formation. Overall, our results provide a preclinical proof of concept for the efficacy of SMAP in AR degradation and CRPC treatment.Significance: A novel class of small-molecule activators of the tumor suppressor PP2A, a serine/threonine phosphatase that inhibits many oncogenic signaling pathways, is shown to deregulate the phosphoproteome and to destabilize the androgen receptor in advanced prostate cancer. Cancer Res; 78(8); 2065-80. ©2018 AACR.


Conflict of interest statement

CONFLICTS OF INTEREST

The Icahn School of Medicine at Mount Sinai on behalf of the authors have filed patents covering composition of matter on the small molecules disclosed herein for the treatment of human cancer and other diseases.

Figures

Figure 1
Figure 1. Prostate cancer cell lines are sensitive to SMAP
A) Prostate cancer cell lines’ IC50’s to TRC-382 as determined by Oncopanel 240 (Eurofins Pathlab, Inc) screen of 240 cancer cell lines. IC50’s are shown relative to the average IC50 (19.6μM) for all 240 cell lines treated with TRC-382. B) LNCaP and 22Rv1 cells were treated with vehicle, 10, 20, 30, and 40μM of SMAP or TRC-766, a biologically inactive analogue of SMAP, and cell viability was measured at 48-hours by MTT analysis. C) Clonogenic assay of LNCaP and 22Rv1 cells treated with vehicle control, 5, 7.5, 10, 12.5 and 15μM of SMAP (top) or TRC-766 (bottom) for 2 weeks. Quantification of the cell colony formation is shown. Data are means ± SD. One-way ANOVA performed for LNCaP cells treated with SMAP (P<0.0001), LNCaP cells treated with 766 (P=0.9993), 22Rv1 cells treated with SMAP (P<0.0001), and 22Rv1 treated with 766 (P=0.9993). Full details of ANOVA and Dunnett’s test provided in Tables S2 and 3. D) Annexin V/7AAD staining of LNCaP and 22Rv1 cells after 24-hours of exposure to vehicle control, 10, 20, and 30μM of SMAP. Quantification of Annexin V stained cells is shown. Data are means ± SD. ANOVA performed for LNCaP cells treated with SMAP (P=0.1015) and 22Rv1 cells treated with SMAP (P=0.0195). Full details of ANOVA and Dunnett’s test provided in Table S4. E) Western blot analysis of cleaved PARP and Caspase-3 normalized to GAPDH in LNCaP and 22Rv1 cells treated with vehicle control, 10, 20, and 30μM of SMAP and harvested at 6, 12, and 24-hours. Asterisks indicate conditions that met statistical significance based on Dunnett’s test between the indicated group and the control, where *P<0.05, **P<0.01, ***P< 0.001.
Figure 2
Figure 2. Phosphoproteomics Analysis of LNCaP Cells with SMAP
A) Volcano plot of the unique phosphosites identified. Horizontal line indicates the P<0.05 cutoff (calculated from Welch’s t-test between DMSO and SMAP treatment). Vertical lines mark the 2-fold change cutoffs. The S308 AR phosphosite (purple dot) was found to be significantly dephosphorylated upon SMAP treatment. B) The top scoring protein-protein interaction (PPI) network result from MCODE. Blue (red) nodes represent proteins that are dephosphorylated (hyperphosphorylated) upon treatment. Larger circles represent proteins with higher degree (number of interactions); circles with dark borders meet P<0.05 from Welch’s test. C) Bar plot summarizing the Kinase Substrate Enrichment Analysis (KSEA) results. Only kinases with at least 3 identified substrates are listed. Negative scores indicate kinases with decreased activity output in the treatment group; positive scores are for those with increased activity outputs. Blue (red) bars indicate kinases that meet a P<0.05 significance cutoff for being significantly downregulated (upregulated) as calculated from the weighted z-score method employed by Casado et al., D) KSEA-calculated kinases with P<0.05 scores were analyzed for documented interactions to AR. There were 4 resulting hits, as shown. The majority (3 of the 4 kinases) have significantly downregulated output upon treatment, as measured by KSEA (blue circles). Experiments were done in triplicates; Data are means ± SD. One-way ANOVA test was utilized to determine P-values represented in the figure *P<0.05, **P<0.01, ***P<0.001.
Figure 3
Figure 3. SMAP treatment leads to AR protein degradation and changes in AR target gene mRNA expression in LNCaP and 22Rv1 cells
A) Western blot analysis of p-AR (ser81), AR (N and C terminus), and PSA normalized to GAPDH in LNCaP cells treated with vehicle control, 10, 20, and 30μM of SMAP and harvested at 1, 3, 6, 12, and 24-hours. Heat map of AR protein expression as determined by densitometry of the average fold-change of three experimental triplicates. Data are means ± SD and P-values are represented in the graph as *P<0.05, **P<0.01. ANOVA P<0.0001, Full details of ANOVA and Tukey’s test provided in Table S7. B) Quantified ratio of phosphorylated AR to total AR (average of N and C-terminus) at 1, 3, 6, 12, and 24-hours after vehicle control, 10, 20 and 20μM treatment with SMAP. Bars in graph represent fold change of SMAP treated to vehicle treated expression. C) Western blot analysis of AR (N or C terminus) normalized to GAPDH in 22Rv1 cells treated with vehicle control or 10, 20, and 30μM of SMAP and harvested at 1, 3, 6, 12, and 24-hours. Heat maps of AR protein expression levels as determined by densitometry of the average fold-change of three experimental triplicates. D) Heatmaps of mRNA expression levels of AR target genes of LNCaP and 22Rv1 SMAP-treated cells. Cells were treated with 30μM SMAP for 6, 12, and 24-hours and mRNA expression was determined by qRT-PCR. AR target genes are separated into two groups: up-regulated AR target genes and down-regulated AR target genes. ANOVA P-value provided for each target in Table S7. Experiments were performed in triplicate.
Figure 4
Figure 4. SMAP decreases AR half-life in LNCaP and 22Rv1 cells
A) Western blot analysis of AR in LNCaP and AR-WT and AR-V7 in 22Rv1 cells treated with vehicle control and cycloheximide or SMAP (3-hour pre-incubation) and cycloheximide for 1, 3, 6, and 9-hours. A dose of 30μM of SMAP and 100μg/ml of cycloheximide was used. Plot of AR half- life over a period of 9-hours in LNCaP cells and AR-WT and AR-V7 in 22Rv1 cells in the presence of vehicle control or SMAP. B) Western blot analysis of AR normalized to GAPDH in LNCaP and 22Rv1 cells treated for 6-hours with vehicle control, 30μM of SMAP, Bortezomib (100nM for LNCaP and 1μM for 22Rv1) or 30μM SMAP and Bortezomib. Western blot densitometry plot of AR relative to GAPDH. PP2A binds to AR after SMAP treatment. The densitometry results depict the averages of three independent experiments ± SD and P-values are represented in the graph *P<0.05, **P<0.01. ANOVA was performed for LNCaP treated with SMAP (P=0.0315), 22Rv1 AR WT (P=0.09) and 22Rv1 ARV7 (P=0.5349). Full details of ANOVA and Dunnett’s test are provided in Table S9. C) Co-immunoprecipitation of AR protein complexes in LNCaP cells treated with vehicle control or 30 μM of SMAP for 1 and 3-hours. Western blot analysis showing the co-immunoprecipitation of AR and PP2A-C alone and in the same complex. Western blot densitometry plot showing the binding fold change of AR with PP2A-C with DMSO and SMAP. The densitometry results depict the averages of three independent experiments ± SD. P-values represented in the figure *P<0.05, ***P<0.001.
Figure 5
Figure 5. PP2A mediates SMAP induced AR degradation
A) Western blot of phosphorylated AR at Serine 81, AR, Cleaved PARP, and Small T antigen normalized to GAPDH in LNCaP cells stably transduced with a retrovirus expressing the Small T antigen (LNCaP-ST). LNCaP and LNCaP-ST cells were treated with vehicle control or 30μM of SMAP for 3 and 6-hours. AR degradation by SMAP is increased in CSS media in LNCaP cells in presence and absence of R1881. The densitometry results depict the averages of three independent experiments ± SD and P-value is represented in the graph as *P<0.05 (ANOVA, P=0.0031). Full details of ANOVA and Tukey’s test are provided in Table S10. B) Western blot analysis of phosphorylated AR at Serine81 and AR normalized to GAPDH in LNCaP cells treated with vehicle control or 30μM of SMAP for 3 and 6-hours in FBS or CSS media. Cells that were treated in CSS media were also treated with and without 1nM of R1881 for 3 and 6-hours together with DMSO or SMAP. Western blot densitometry plot of AR relative to GAPDH. The densitometry results depict the averages of three independent experiments using ± SD and P-values are represented in the figure as *P<0.05, **P<0.01, ***P<0.001, ****P<0.0001. ANOVA was performed for LNCaP at 3-hours (P<0.0001) and 6-hours (P<0.0001). Full details of ANOVA and Tukey’s test are provided in Table S11. Heatmaps of AR target gene mRNA expression levels in LNCaP cells treated with vehicle control or 30μM of SMAP for 3 and 6-hours in FBS or CSS media. AR target genes are separated into two groups: up-regulated AR target genes and down-regulated AR target genes. Cells that were treated in CSS media were also treated with and without 1nM of R1881 for 3 and 6-hours together with DMSO or SMAP. P-values were calculated for each individual gene using one-way ANOVA (Table S12).
Figure 6
Figure 6. SMAP and SMAP-2 inhibit tumor growth in a LNCaP/AR xenograft model in both castrated and non-castrated male mice
A) Fold change in tumor volume was assessed every 2–3 days in non-castrated male mice, bearing on average 200mm3 LNCaP/AR tumors, treated with vehicle control (n=6), 100mg/kg SMAP BID (n=6), 400mg/kg SMAP BID (n=6), or 100mg/kg MDV3100 (n=5) QD for 38-days. Data shown represents the mean tumor volume ± SD. ANOVA P=0.0004; P-values are represented in the figure *P<0.05, **P<0.01, ***P<0.001. B) Fold change in body weight of mice over the course of the SMAP treatment study. C) Waterfall plot of % change in individual tumor volume from day 0 to 38 for each mouse in SMAP treatment study. ANOVA P=0.0246; P-values are represented in the figure by *P<0.05. Full details of ANOVA and Dunnett’s tests are provided in Table S13. D) Fold change in tumor volume was assessed every 2–3 days in non-castrated male mice bearing LNCaP/AR tumors, on average 100mm3, treated with vehicle control (n=11) or 100mg/kg SMAP-2 (n=8) orally BID for 28 days. E) Fold change in body weight of mice over the course of the SMAP-2 treatment study. F) Waterfall plot of % change in individual tumor volume from day 0 to day 28 for each mouse in SMAP-2 treatment study. G) Fold change in tumor volume assessed every 2–3 days in castrated male mice bearing LNCaP/AR tumors, on average 200–250mm3, treated with control (n=11) or 100mg/kg SMAP-2 (n=9) orally BID for 31 days. H) Fold change in body weight of castrated mice over the course of the SMAP-2 treatment study. I) Waterfall plot of % change in individual tumor volume from day 0 to 31 for each mouse in SMAP-2 treatment study.
Figure 7
Figure 7. SMAP-2 inhibits tumor growth and reduces AR and PSA expression in vivo in a pharmacodynamic study in castrated male LNCaP/AR xenograft mouse model
5x10⁶ LNCaP/AR cells were subcutaneously injected into the right flank of castrated SCID mice and allowed to grow to an average of 200mm3. Mice were treated BID with vehicle control, 30mg/kg SMAP-2, and 100 mg/kg SMAP-2 for 6 days. SMAP-2 was administered orally in a homogenous solution comprised of N,N-Dimethylacetamide, Solutol, and water. A) Fold change of tumor volume assessed every 2 days for the duration of the study. B) Fold change in body weight of mice over the course of the pharmacodynamic study. C) Waterfall plot of % change in individual tumor volumes from day 0 to 6. ANOVA P=0.0029. Full details of ANOVA and Dunnett’s test provided in Table S14. P-values represented in the figure *P<0.05, **P<0.01, ***P<0.001. D) Representative microscopy images of treated and control xenograft tumor sections resected 2-hours after final dose and stained for TUNEL and PCNA. Quantification of the percentage of TUNEL positive cells (green) (ANOVA, P=0.0289) and PCNA positive cells (brown) (ANOVA, P<0.0001) in treated and control xenograft tumors shown in E and F, respectively. Full details of ANOVA and Dunnett’s provided in Tables S15 and S16. G) Representative immunoblots of AR and PSA protein expression in control and treated xenograft tumors resected 2-hours after final dose as performed by immunoblotting and densitometry. H) Quantification of AR and I) PSA protein expression in control and treated xenograft tumors resected 2-hours after final dose as performed by immunoblotting and densitometry. ANOVA was performed for AR (P=0.0199) and PSA (P=0.0075). Full details of ANOVA and Dunnett’s tests are provided in Tables S17 and S18.

References

    1. de Bono JS, Logothetis CJ, Molina A, Fizazi K, North S, Chu L, et al. Abiraterone and increased survival in metastatic prostate cancer. N Engl J Med. 2011;364:1995–2005. - PMC - PubMed
    1. Scher HI, Fizazi K, Saad F, Taplin ME, Sternberg CN, Miller K, et al. Increased survival with enzalutamide in prostate cancer after chemotherapy. N Engl J Med. 2012;367:1187–97. - PubMed
    1. Galsky MD, Small AC, Tsao CK, Oh WK. Clinical development of novel therapeutics for castration-resistant prostate cancer: historic challenges and recent successes. CA Cancer J Clin. 2012;62:299–308. - PubMed
    1. Kiely M, Kiely PA. PP2A: The Wolf in Sheep’s Clothing? Cancers (Basel) 2015;7:648–69. - PMC - PubMed
    1. Yang CS, Xin HW, Kelley JB, Spencer A, Brautigan DL, Paschal BM. Ligand binding to the androgen receptor induces conformational changes that regulate phosphatase interactions. Mol Cell Biol. 2007;27:3390–404. - PMC - PubMed

Publication types

MeSH terms