. 2018 Jan 22;7(2):e006727.
doi: 10.1161/JAHA.117.006727.

Transplantation of Allogeneic Pericytes Improves Myocardial Vascularization and Reduces Interstitial Fibrosis in a Swine Model of Reperfused Acute Myocardial Infarction

Affiliations

Transplantation of Allogeneic Pericytes Improves Myocardial Vascularization and Reduces Interstitial Fibrosis in a Swine Model of Reperfused Acute Myocardial Infarction

Valeria Vincenza Alvino et al. J Am Heart Assoc. .

Abstract

Background: Transplantation of adventitial pericytes (APCs) promotes cardiac repair in murine models of myocardial infarction. The aim of present study was to confirm the benefit of APC therapy in a large animal model.

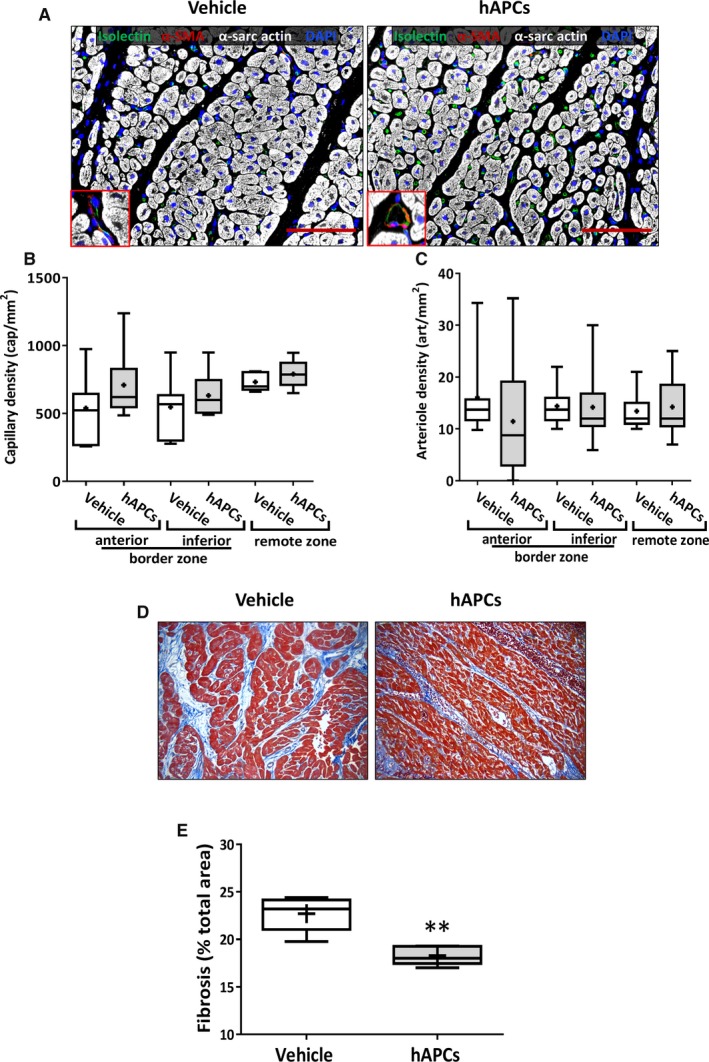
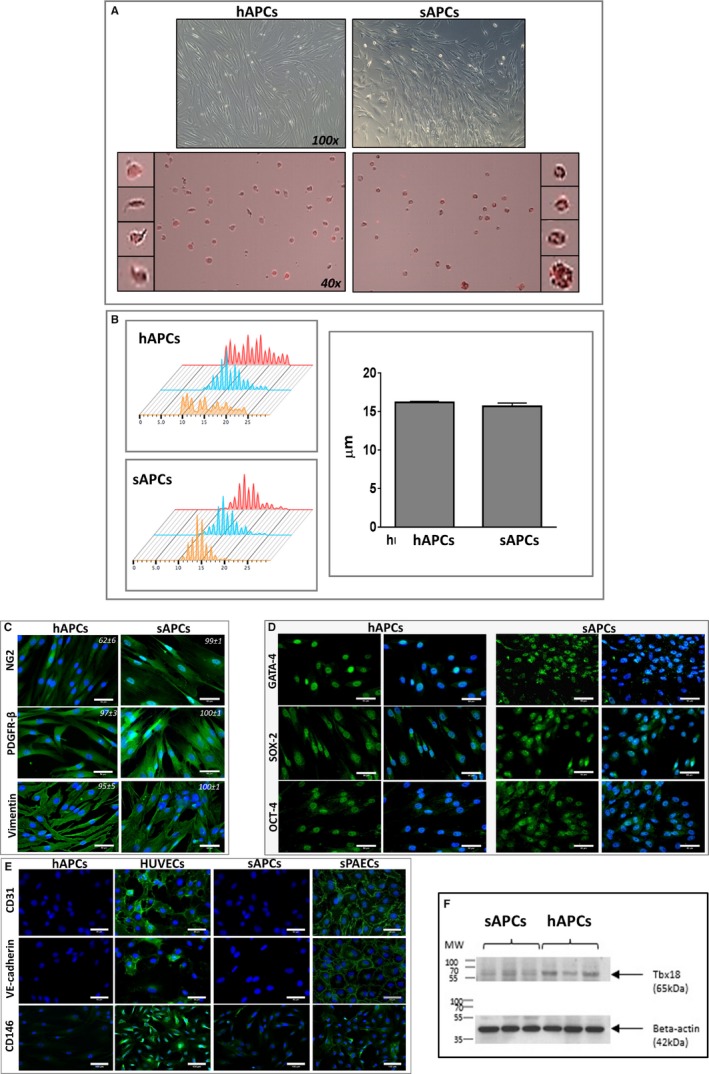
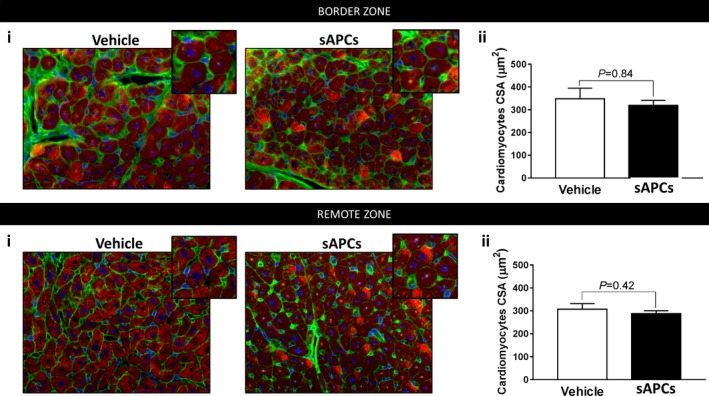
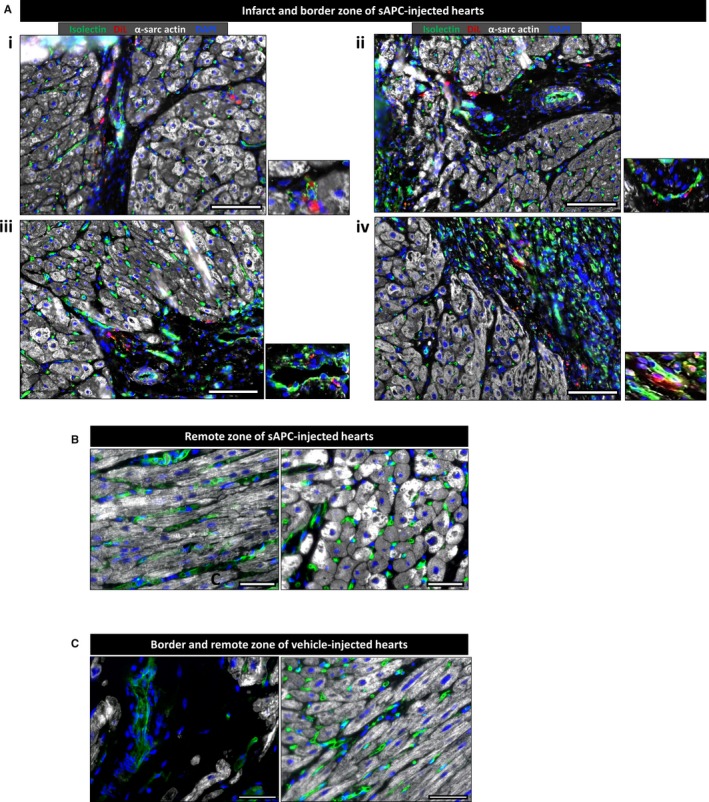
Methods and results: We performed a blind, randomized, placebo-controlled APC therapy trial in a swine model of reperfused myocardial infarction. A first study used human APCs (hAPCs) from patients undergoing coronary artery bypass graft surgery. A second study used allogeneic swine APCs (sAPCs). Primary end points were (1) ejection fraction as assessed by cardiac magnetic resonance imaging and (2) myocardial vascularization and fibrosis as determined by immunohistochemistry. Transplantation of hAPCs reduced fibrosis but failed to improve the other efficacy end points. Incompatibility of the xenogeneic model was suggested by the occurrence of a cytotoxic response following in vitro challenge of hAPCs with swine spleen lymphocytes and the failure to retrieve hAPCs in transplanted hearts. We next considered sAPCs as an alternative. Flow cytometry, immunocytochemistry, and functional/cytotoxic assays indicate that sAPCs are a surrogate of hAPCs. Transplantation of allogeneic sAPCs benefited capillary density and fibrosis but did not improve cardiac magnetic resonance imaging indices of contractility. Transplanted cells were detected in the border zone.

Conclusions: Immunologic barriers limit the applicability of a xenogeneic swine model to assess hAPC efficacy. On the other hand, we newly show that transplantation of allogeneic sAPCs is feasible, safe, and immunologically acceptable. The approach induces proangiogenic and antifibrotic benefits, though these effects were not enough to result in functional improvements.

Keywords: angiogenesis; cell therapy; large animal models; myocardial infarction; pericytes.


Figures

Figure 1
Figure 1
Study design. A, In the efficacy study, swine were subjected to closed‐chest 50‐minute balloon occlusion of the mid‐LAD artery to induce acute MI. At day 5 post‐MI, they underwent a comprehensive basal CMR study. Animals that did not show a transmural infarction (at least 50% of the wall thickness infarcted) were excluded. Immediately after day 5 CMR, animals were randomized to receive intramyocardial vehicle or APC injection via minithoracotomy. CMR was repeated at day 45 post‐MI and hearts were harvested for histology and other tests described in the Materials and Methods section. B, A similar protocol was used to assess cell engraftment with hearts being collected 5 days after vehicle or APC injection. APC indicates adventitial pericyte; CMR, cardiac magnetic resonance; I/R, ischemia/reperfusion; LAD, left anterior descending; MI, myocardial infarction.
Figure 2
Figure 2
Cardiac parameters of individual animals measured by CMR at day 5 (prior injection of vehicle or hAPCs) and day 45 post‐MI (end of the study). A, Representative late gadolinium enhancement images at day 5 and day 45 post‐MI in 2 swine injected with vehicle or hAPCs (donor human cell line ID# 6). B through F, Plot individual data of infarct size (B), LVEDV (C), LVESV (D) both normalized for body surface area, LVEF (E), and perfusion in the anterior and inferior border zones at day 45 post‐MI (F). G, Representative myocardial perfusion maps at day 45 post‐MI in 2 swine injected with vehicle or hAPCs (donor human cell line ID# 6). Perfusion maps were scaled between 0 and 200 mL/100 g per min. *P<0.05 and **P<0.01 vs day 5. CMR indicates cardiac magnetic resonance; hAPCs, human adventitial pericytes; ID, identity number; LVEDV, left ventricular end diastolic volume; LVEF, left ventricular ejection fraction; LVESV, left ventricular end systolic volume; MI, myocardial infarction.
Figure 3
Figure 3
Immunohistochemistry analysis of hearts collected at day 45 post‐MI from swine injected with vehicle or hAPCs. A, Representative confocal images of capillaries and arterioles in infarcted hearts injected with vehicle or hAPCs (donor human cell line ID# 6). Vessels are stained with isolectin GSIB4 (green) and α‐SMA (red); cardiomyocytes are stained with α‐sarc actin (white) and nuclei with DAPI (blue); Inserts show α‐SMA positive arterioles. Scale bar=100 μm. B and C, Graphs show capillary density (B) and arteriole density data (C). Values were not normally distributed. The bottom and top of the boxes represent the first and third quartiles, while whiskers indicate the 5 to 95 percentile. Median and mean values are represented as a horizontal line and “+” symbol inside the boxes, respectively. D and E, Analysis of fibrosis in the infarct border‐zone. Representative immunohistochemistry image of Azan‐Mallory (total optical magnification ×200) (D) and graphs showing the quantification of fibrosis in hearts injected with vehicle or hAPCs (donor human cell line ID# 6). E, **P<0.01 vs vehicle group. α‐SMA indicates α‐smooth muscle actin; α‐sarc actin, α‐sarcomeric actin; DAPI, 4′,6‐diamidino‐2‐phenylindole; hAPCs, human adventitial pericytes; ID, identity number.
Figure 4
Figure 4
Assessment of swine immune response to hAPC. A through F, Humoral immune response to hAPCs. hAPCs were incubated with swine or human serum (negative control) at different dilutions. There was no difference in the binding of anti‐swine IgM or IgG antibodies on hAPCs when incubated with human serum (A and C) or swine serum (B and D). Similarly, no difference was observed with regard to the levels of C3b, a metabolite of complement cascade (E and F). Data are expressed as mean±SEM; N=3 biological replicates. G and H, Cytotoxic activity of swine splenocytes on hAPCs. To investigate cell‐mediated immune response, hAPCs (target cells) were incubated with interleukin‐activated swine splenocytes (effector cells). G, Representative flow cytometry graphs of hAPCs challenged with increasing concentrations of swine splenocytes. Values in each quadrant represent the percent of total cells. H, Bar graphs show the percent of necrotic (Annexin V/P.I.+), late apoptotic (Annexin V+/P.I.+), early apoptotic (Annexin V+/P.I.), and viable (Annexin V/P.I.) hAPCs. Data are expressed as mean±SEM; N=2 biological replicates; *P<0.05 vs the “0:1” group. A.U. indicates Arbitrary Units; FITC, Fluorescein isothiocyanate; hAPCs, human adventitial pericytes; P.I., propidium iodide.
Figure 5
Figure 5
Comparison of APCs isolated from human and swine saphenous veins. A, Upper panels: phase contrast microscopy images of human and swine cells displaying similar spindle‐shape features (magnification ×100). Lower panels: Cells shown in the contrast‐phase microscopy images are stained with swine and human PE CD105 antibodies (PE=red laser) for measurement of cell size by Tali Image‐based cytometer (magnification ×40). B, Cell size histograms calculated by Tali and Novocyte 3000 (Acea, Biosciences, Inc). The X axis in the left panels represents the cell size and the Y axis represents the number of cells counted (3 cell lines for each group). The bar graph shows the mean and SEM, which was similar between groups, though the range of cell size was wider for hAPCs. C, Representative immunofluorescence microscopy images show both hAPCs and sAPCs express the typical mesenchymal markers NG2, PDGFR‐β, and Vimentin. Values in each panel represent the mean±SEM of 4 biological replicates. D, Immunofluorescence microscopy images show the expression of cardiac transcriptional factor GATA‐4, and the stemness markers OCT‐4 and SOX‐2. Blue fluorescence of DAPI recognizes nuclei. Magnification ×200 and ×400 (50‐μm scale bar). E, Representative immunofluorescence microscopy images of hAPCs and sAPCs confirming these cells do not express endothelial antigens, at variance with HUVECs and PAECs (positive controls). F, Western blot image showing Tbx18 protein corresponding to the 65 kDa MW within human and swine APC lysate. APCs indicates adventitial pericytes; DAPI, 4′,6‐diamidino‐2‐phenylindole; GATA‐4, GATA binding protein 4; hAPCs, human adventitial pericytes; HUVECs, human umbilical vein endothelial cells; MW, molecular weight; sPAECs, swine pulmonary artery endothelial cells; PDGFR‐β, platelet‐derived growth factor receptor‐β; OCT‐4, octamer‐binding transcription factor 4; sAPCs, swine adventitial pericytes; SOX‐2, sex determining region Y‐box 2.
Figure 6
Figure 6
Flow cytometry analyses of APCs isolated from human and swine saphenous veins. A and B, Representative flow cytometry gating procedure of hAPC line #1 and sAPC line #1 at P5. Total cell populations and the single cells (singlets) were gated according to FSC‐A vs SSC‐A and FSC‐A vs FSC‐H parameters (i and ii). Viable cells were distinguished from dead cells using Fixable Viability Dye eFluor780 (iii) and further gated for selected antigens (iv through xi and iv through xiii). Pericyte, mesenchymal, endothelial, and hematopoietic markers were studied. The FMO control was used in the assessment and gating of CD146+ and PDGFRβ+ cells, because of the use of multiple fluorochromes (vii through ix and viii through x). The same approach was used when studying the expression of CD45 and CD11b on sAPCs to exclude hematopoietic cell contamination in the cell culture system (xi through xiii). Data were acquired using FACSCantoII (BD Biosciences) or Novocyte 3000 flow cytometer (ACEA Biosciences, San Diego, CA, USA) and analyzed using the FlowJo v10.3 software. C and D, Flow cytometry histograms for each surface marker in representative hAPC (C) and sAPC lines (D). Negative control staining profiles are shown by the red histograms, whereas specific antibody staining profiles are shown by light blue histograms. Bar graphs show the mean±SEM values of 3 hAPC and sAPC lines. E and F, Gating and histograms of fresh isolated swine PBMNCs and swine PAEC line #1 at P5 used as positive control for the staining of hematopoietic and endothelial markers, respectively. In both cell lines, the negative control staining profile is shown by full red histogram, while the positive staining profile is shown by full light‐blue histogram. FSC‐A indicates Forward Scatter Area; FSC‐H, Forward Scatter Height; FMO, fluorescence minus 1; hAPCs, human adventitial pericytes; PB‐MNCs, Peripheral blood mononuclear cells; PDGFRβ, platelet‐derived growth factor receptor‐β; sAPCs, swine adventitial pericytes.
Figure 7
Figure 7
A, Representative phase‐contrast and fluorescent images of hAPCs (Ai), sAPCs (Aii), and sPAECs (Aiii) cultured alone or in combination (Aiv, hAPCs+sPAECs; Av, sAPCs+sPAECs at a 1:4 ratio). APCs are stained with the long‐term cell tracker Dil (red fluorescence). (Avi) Bar graph showing the fold increase in cumulative tube length induced by coculturing APCs with sPAECs in 2 separate experiments, each comprising 3 APC lines per group. Data are represented as mean±SEM, *P<0.05 and **P<0.01 vs sPAECs. B, Representative phase‐contrast images of sPAEC networks formed on Matrigel in the presence of EGM2 medium (Bi) or human (Bii) or swine APCCM (Biii‐v, 3 cell lines). Magnification ×10. (Bvi) Histograms summarize quantitative data of the tube length per field in an experiment comprising 3 APC lines per group). Data are represented as mean±SEM, **P<0.01 and ***P<0.001 vs PAECs. + P<0.05 vs hAPCCM. C, Bar graphs shows the expression of VEGF‐A (i), miR‐210 (ii), and miR‐132 (iii) in sAPC lysate under normoxia and following stimulation by hypoxia. D, VEGF‐A (i) and miR‐132 (iii) were also found in conditioned media and increased following hypoxia. Western blot image displaying secreted VEGF‐A (MW=22 kDa) and also larger bands under normoxia condition (ii). The antibody detection of these bands suggests that either multiple molecules are bound together in a multimerized complex or that VEGF‐A is bound to another molecule with the region bound by the antibody exposed/separate from the region bound by the corresponding molecule/receptor. Values are means±SEM. **P<0.01 vs normoxia. CM indicates conditioned medium; Dil, 1,1′‐Dioctadecyl‐3,3,3′,3′‐Tetramethylindocarbocyanine; hAPCs, human adventitial pericytes; miR, microRNA; MW, molecular weight; sAPCs, swine adventitial pericytes; sPAECs, swine pulmonary artery endothelial cells; VEGF‐A, vascular endothelial growth factor A.
Figure 8
Figure 8
Cytotoxic assay of sAPCs and swine splenocytes. To investigate the cell‐mediated immune response, sAPCs (target cells) were incubated with interleukin‐activated swine splenocytes (effector cells). A, Representative scattergram of sAPCs challenged with increasing concentrations of swine splenocytes. Values in each quadrant represent the percent of total cells. B, Bar graph showing the percent of necrotic (Annexin V/P.I.+), late apoptotic (Annexin V+/P.I.+), early apoptotic (Annexin V+/P.I.), and viable (Annexin V/P.I.) sAPCs. Data are expressed as mean±SEM; N=3 biological replicates. FITC indicates Fluorescein isothiocyanate; P.I., propidium iodide; sAPCs, swine adventitial pericytes.
Figure 9
Figure 9
Cardiac parameters of individual animals measured with CMR at day 5 (prior injection of vehicle or sAPCs) and day 45 post‐MI (end of the study). A, Representative late gadolinium enhancement images at day 5 and day 45 post‐MI in 2 pigs injected with vehicle or sAPCs (donor swine cell line ID# 3). B through E, Plot individual data of infarct size (B), LVEDV (C), LVESV (D), and LVEF (E). F and G, Perfusion in the anterior and inferior border zones at day 45 post‐MI. Individual data (F) and representative myocardial perfusion maps at day 45 post‐MI in 2 pigs injected with vehicle (ID# 4146) or sAPCs (ID# 4126) (G) Perfusion maps were scaled between 20 and 250 mL/min per 100 g. *P<0.05 and **P<0.01 vs day 5). CMR indicates cardiac magnetic resonance; ID, identity number; LVEDV, left ventricular end diastolic volume; LVEF, left ventricular ejection fraction; LVESV, left ventricular end systolic volume; MI, myocardial infarction; sAPCs, swine adventitial pericytes.
Figure 10
Figure 10
Benefit of sAPC therapy on microvascular density and fibrosis. A through C, Representative images (scale bar=100 μm) (A) and bar graphs showing the effect of cell therapy with sAPCs on capillary (B) and arteriole density (C). Representative images refers to hearts injected with vehicle or sAPCs (donor swine cell line ID# 5). The inserts illustrate arterioles stained with α‐SMA. Data are reported for 2 areas in the border zone and the remote zone. D, Illustrative microscopy images (total optical magnification ×200) and (E) bar graph illustrating the quantification of the fibrotic myocardium in the infarct border zone of swine hearts injected with vehicle or sAPCs (donor swine cell line ID# 2). *P<0.05, **P<0.01, ***P<0.001 vs vehicle. F, Correlation of capillary density and myocardial fibrosis in the whole population on swine injected with vehicle (blue dots) or sAPCs (red dots). α‐SMA indicates α‐smooth muscle actin; ID, identity number; sAPCs, swine adventitial pericytes.
Figure 11
Figure 11
Morphometric evaluation of cardiomyocytes hypertrophy. A and B, CSA was measured in hearts of animals given vehicle or sAPC therapy. Ai and Bi: Representative immunofluorescence images of Wheat Germ Agglutinin (green), α‐Sarc Actin (red), and DAPI (blue) in the border and remote zones. Inserts show cell size at a higher magnification. Total optical magnification ×400. Aii and Bii: Histograms summarize quantitative data of CSA. Data are presented as mean±SEM. N=5 per each group. Difference between groups was measured by unpaired Mann–Whitney test, and P value reported on the graphs. α‐sarc actin indicates α‐sarcomeric actin; CSA, cell cross‐sectional area; DAPI, 4′,6‐diamidino‐2‐phenylindole; sAPCs, swine adventitial pericytes.
Figure 12
Figure 12
Engraftment of sAPCs in infarcted hearts. A, Representative immunofluorescence images showing engraftment of sAPCs in the infarct and nearby border zone (N=2). sAPCs are recognized by the red fluorescence of the Vybrant Dil marker, which stains cell membranes. In addition, α‐Sarc Actin (white) identifies cardiomyocytes. Isolectin B4 (green) has been used as a marker for endothelial cells, while DAPI (blue) shows nuclei. sAPCs can be seen at a higher magnification in the inserts placed on the right of each image. B, Representative images showing absence of sAPCs to the remote zone. C, Images taken from a vehicle‐injected heart as a negative control for the Vybrant Dil staining. For all images, total optical magnification is ×200. The scale bar in all images is 50 μm. α‐sarc actin indicates α‐sarcomeric actin; DAPI, 4′,6‐diamidino‐2‐phenylindole; Dil, 1,1′‐Dioctadecyl‐3,3,3′,3′‐Tetramethylindocarbocyanine; sAPCs, swine adventitial pericytes.

References

    1. Ambrosy AP, Fonarow GC, Butler J, Chioncel O, Greene SJ, Vaduganathan M, Nodari S, Lam CS, Sato N, Shah AN, Gheorghiade M. The global health and economic burden of hospitalizations for heart failure: lessons learned from hospitalized heart failure registries. J Am Coll Cardiol. 2014;63:1123–1133. - PubMed
    1. Jadczyk T, Faulkner A, Madeddu P. Stem cell therapy for cardiovascular disease: the demise of alchemy and rise of pharmacology. Br J Pharmacol. 2013;169:247–268. - PMC - PubMed
    1. Li M, Izpisua Belmonte JC. Mending a faltering heart. Circ Res. 2016;118:344–351. - PubMed
    1. Khan AR, Farid TA, Pathan A, Tripathi A, Ghafghazi S, Wysoczynski M, Bolli R. Impact of cell therapy on myocardial perfusion and cardiovascular outcomes in patients with angina refractory to medical therapy: a systematic review and meta‐analysis. Circ Res. 2016;118:984–993. - PMC - PubMed
    1. Martin‐Rendon E. Meta‐analyses of human cell‐based cardiac regeneration therapies: what can systematic reviews tell us about cell therapies for ischemic heart disease? Circ Res. 2016;118:1264–1272. - PubMed

Publication types

MeSH terms