. 2018 Mar;59(3):550-563.
doi: 10.1194/jlr.M081323. Epub 2018 Jan 22.

Cerebral organoids derived from Sandhoff disease-induced pluripotent stem cells exhibit impaired neurodifferentiation

Affiliations

Cerebral organoids derived from Sandhoff disease-induced pluripotent stem cells exhibit impaired neurodifferentiation

Maria L Allende et al. J Lipid Res. 2018 Mar.

Abstract

Sandhoff disease, one of the GM2 gangliosidoses, is a lysosomal storage disorder characterized by the absence of β-hexosaminidase A and B activity and the concomitant lysosomal accumulation of its substrate, GM2 ganglioside. It features catastrophic neurodegeneration and death in early childhood. How the lysosomal accumulation of ganglioside might affect the early development of the nervous system is not understood. Recently, cerebral organoids derived from induced pluripotent stem (iPS) cells have illuminated early developmental events altered by disease processes. To develop an early neurodevelopmental model of Sandhoff disease, we first generated iPS cells from the fibroblasts of an infantile Sandhoff disease patient, then corrected one of the mutant HEXB alleles in those iPS cells using CRISPR/Cas9 genome-editing technology, thereby creating isogenic controls. Next, we used the parental Sandhoff disease iPS cells and isogenic HEXB-corrected iPS cell clones to generate cerebral organoids that modeled the first trimester of neurodevelopment. The Sandhoff disease organoids, but not the HEXB-corrected organoids, accumulated GM2 ganglioside and exhibited increased size and cellular proliferation compared with the HEXB-corrected organoids. Whole-transcriptome analysis demonstrated that development was impaired in the Sandhoff disease organoids, suggesting that alterations in neuronal differentiation may occur during early development in the GM2 gangliosidoses.

Keywords: Clustered Regularly Interspaced Short Palindromic Repeats/Cas9; GM2 gangliosidosis; Tay-Sachs disease; brain development; brain lipids; gangliosides; patient-derived induced pluripotent stem cells; sphingolipids; storage diseases.


Figures

Fig. 1.
Fig. 1.
Characterization of the infantile Sandhoff disease patient. A: Diseases, subunits, and substrates associated with GM2 gangliosidoses. B: The infantile Sandhoff disease patient (GSL033) was compound heterozygous for mutations in the HEXB gene, with one allele carrying an ∼16 Kb deletion that included the promoter, exons 1–5, and part of intron 5 (top) and the other allele harboring a splice-site point mutation near the 3′ end of intron 10 (bottom). The sequence of the HEXB gene shows the single-point mutation (IVS10-2A>G) in the acceptor splice site (underlined) of intron 10. C: β-Hexosaminidase activity detected in lysates from the Sandhoff disease patient’s fibroblasts compared with control fibroblasts. The bars represent β-hexosaminidase activity as percentage of control cells. ***P < 0.001, one-way ANOVA test with Bonferroni correction. D, E: Electron microscopy images of postmortem brain sample of the frontal lobe (D) and thalamus (E). Scale bars, 1 μm. F: MRI image of the patient’s brain at 2 years of age. GAGs, glycosaminoglycans; SD, Sandhoff disease.
Fig. 2.
Fig. 2.
Creation of isogenic control (HEXB-corrected) iPS cells and generation of cerebral organoids. A: Strategy for mutation correction to create isogenic control iPS cells. Fibroblasts from the Sandhoff disease patient, GSL033, were transfected using episomal vectors expressing reprogramming factors to generate an iPS cell line. Sandhoff disease iPS cells were transfected with a CRISPR/Cas9 vector expressing the HEXB-targeted sgRNA together with a single-stranded repair oligodeoxynucleotide (oligo) to correct the splice-site point mutation through homology-directed repair. iPS cell clones were screened for β-hexosaminidase activity to identify those recovering about 50% of the enzymatic activity found in the control iPS cell line and sequenced to confirm editing. B: Sequence of the targeted region of the HEXB gene. WT sequence, mutant SD sequence (showing the 20 bp sgRNA target sequence and the PAM sequence), a segment of the repair oligodeoxynucleotide, and the corrected HEXB gene (carrying the correct base in the acceptor splice site of intron 10, underlined) are shown. Sequences corresponding to exon 11 are shadowed in gray. The silent mutations to disrupt the PAM sequence and to create a KpnI site are highlighted in orange. C: β-Hexosaminidase activity of isogenic HEXB-corrected iPS cell clones. CRISPR/Cas9-edited iPS cell clones were isolated and screened for the recovery of about 50% of β-hexosaminidase activity in vitro. Three HEXB-corrected isogenic iPS cell clones (HEXB-corrected clones 1, 2, and 3) were further analyzed. β-Hexosaminidase activity was normalized by β-galactosidase activity per minute. Bars represent the mean β-hexosaminidase activity as percentage of control iPS cells. ***P < 0.001, one-way ANOVA test with Bonferroni correction between SD and each corrected clone. D: General scheme for the generation of cerebral organoids. Cerebral organoids were generated using the parental Sandhoff disease and the three isogenic HEXB-corrected iPS cell clones. This method leads to a rapid development of brain-like tissue as a cerebral organoid. Organoids were grown for up to 14 weeks and were analyzed for GM2 ganglioside accumulation, cell proliferation and apoptosis, and gene expression. SD, Sandhoff disease.
Fig. 3.
Fig. 3.
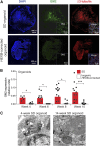
Sandhoff disease cerebral organoids accumulate GM2 ganglioside. A: Frozen sections of Sandhoff disease (SD; top panels) and isogenic HEXB-corrected organoids (bottom panels) at week 7 of culture were stained with DAPI (left), anti-GM2 ganglioside (center), and anti-β3 tubulin (right). Representative images of entire organoid sections are shown. The insets show higher magnification views of GM2 staining (center) and DAPI, GM2 and β3 tubulin merged staining (right). B: Quantification of GM2 ganglioside expression in SD organoids (red bars) and isogenic HEXB-corrected organoids (white bars) from week 4 up to week 10 of culture. GM2 expression was calculated as anti-GM2 ganglioside antibody fluorescence intensity normalized by DAPI intensity quantified by ImageJ software. Bars represent mean GM2 expression and each dot represents the value corresponding to an entire organoid section, with two sections per organoid. *P < 0.05, ***P < 0.001, t-test analysis between SD and the corrected clone at each time point. C: Electron microscopy of SD organoids after week 4 and week 14 of culture showing multilamellar bodies (arrows). Scale bar, 200 nm.
Fig. 4.
Fig. 4.
Expression of GD3 and GM1 in Sandhoff disease cerebral organoids. A: Frozen sections of Sandhoff disease (SD; top panels) and isogenic HEXB-corrected organoids (bottom panels) at week 4 of culture were stained with DAPI (left) and anti-GD3 ganglioside (right). Representative images of entire organoid sections are shown. B: Quantification of GD3 ganglioside expression in SD organoids (red bars) and isogenic HEXB-corrected organoids (white bars) at week 4 of culture. GD3 ganglioside expression was calculated as anti-GD3 ganglioside antibody fluorescence intensity normalized by DAPI intensity quantified by ImageJ software. Bars represent mean GD3 expression and each dot represents the value corresponding to an entire organoid section, with two sections per organoid. *P < 0.05, t-test analysis between SD and the corrected clone. C: Sections of Sandhoff disease (SD; top panels) and isogenic HEXB-corrected organoids (bottom panels) at week 4 of culture were stained with DAPI (left) and FITC-conjugated cholera toxin B subunit (CTB) (right). Representative images of entire organoid sections are shown. D: Quantification of CTB binding in SD organoids (red bars) and isogenic HEXB-corrected organoids (white bars) at week 4 of culture. CTB binding was calculated as CTB fluorescence intensity normalized by DAPI intensity quantified by ImageJ software. Bars represent mean CTB binding and each dot represents the value corresponding to an entire organoid section, with two sections per organoid. ns, not significant; t-test analysis between SD and the corrected clone.
Fig. 5.
Fig. 5.
Expression of galactosylceramide and myelin basic protein in Sandhoff disease cerebral organoids. A, B: Frozen sections of Sandhoff disease (SD; top panels) and isogenic HEXB-corrected organoids (bottom panels) at week 4 of culture were stained with DAPI (left), anti-galactosylceramide (GalCer) (center), and myelin basic protein (MBP) (right). Representative images of entire organoid sections are shown in A and higher magnification views in B. C, D: Quantification of GalCer and MBP expression in SD organoids (red bars) and isogenic HEXB-corrected organoids (white bars) at week 4 of culture. GalCer and MBP expression was calculated as antibody fluorescence intensities normalized by DAPI intensity quantified by ImageJ software. Bars represent mean GalCer and MBP expression and each dot represents the value corresponding to an entire organoid section, with two sections per organoid. ns, not significant, t-test analysis between SD and the corrected clone at each time point.
Fig. 6.
Fig. 6.
Sandhoff disease cerebral organoids are larger than isogenic HEXB-corrected cerebral organoids. A: Representative images of the cerebral organoids at weeks 4 and 10 of culture. Scale bar, 0.5 cm. B: Size comparison of Sandhoff disease (SD; red bars) and isogenic HEXB-corrected organoids (white bars) at week 4 and week 10 of culture performed by calculating the perimeter of each organoid using ImageJ software. The bars represent mean perimeter values and each dot represents one organoid. **P < 0.01, ***P < 0.001, t-test analysis between SD and corrected organoids.
Fig. 7.
Fig. 7.
AAV mediated β-hexosaminidase correction reduced GM2 storage and size of Sandhoff disease cerebral organoids. A: β-hexosaminidase activity of uninjected, control AAV-GFP-injected, and AAV-HEXA/B-injected Sandhoff disease cerebral organoids. The bars represent average β-hexosaminidase activity normalized by β-galactosidase activity per minute and each circle represents one individual organoid. *P < 0.05, t-test. B, C: Expression of GM2 in AAV-injected Sandhoff disease organoids. Representative images of entire organoid sections 11 days after injection of control AAV-GFP-injected (central panels), AAV-HEXA/B-injected (right panels), and uninjected organoids (left panels). GM2 ganglioside expression, bottom panels; DAPI staining, top panels. C: Quantification of GM2 ganglioside expression. The bars represent average GM2 ganglioside fluorescence intensity normalized by DAPI intensity and each circle represents one individual organoid. *P < 0.05, t-test. D: Quantification of organoid size as described in Fig. 6. The bars represent perimeter average values and each circle represents one individual organoid. *P < 0.05, ***P < 0.001, t-test.
Fig. 8.
Fig. 8.
Sandhoff disease cerebral organoids display increased proliferation. A: Proliferation of cells in organoids. Quantification of the percentages of BrdU+ DAPI+ cells in Sandhoff disease (SD; red bars) and HEXB-corrected organoids (white bars) at week 4 and week 6 of culture. The bars represent mean values corresponding to random fields (dots) taken from entire organoid sections (three organoids for SD and two organoids for HEXB-corrected at 4 weeks; six organoids for SD and four organoids for HEXB-corrected at 6 weeks). B: Proliferation of iPS cells. Quantification of the percentages of EdU+ DAPI+ SD and HEXB-corrected iPS cells. Ten random fields (dots) were counted per cell type. The bars represent mean values. C: Apoptosis of cells in organoids. SD and HEXB-corrected organoids at week 8. Quantification of the percentages of TUNEL+ DAPI+ cells. Ten random fields (dots) were counted per genotype. The bars represent mean values. Two organoids were analyzed for each genotype. *P < 0.05, ***P < 0.001, t-test analysis between SD and each corrected clone. ns, not significant.
Fig. 9.
Fig. 9.
Sandhoff disease cerebral organoids exhibit dysregulated expression of genes related to CNS development. A: Heat map of Pearson correlation analysis of RNA-Seq data for four Sandhoff disease (SD) and four isogenic HEXB-corrected individual organoids with a published transcriptome database of human dorsolateral prefrontal cortex across two developmental stages. B: Gene ontology analysis of the top 100 upregulated and top 100 downregulated genes that are differentially expressed in HEXB-corrected organoids compared with SD organoids at week 10 of culture. Biological processes category was plotted selecting the top 14 terms ranked by P value. C: Top 10 significantly upregulated genes in HEXB-corrected organoids compared with SD organoids at week 10 of culture, shown as fold change of the gene expression (RPKM).

References

    1. Bley A. E., Giannikopoulos O. A., Hayden D., Kubilus K., Tifft C. J., and Eichler F. S.. 2011. Natural history of infantile G(M2) gangliosidosis. Pediatrics. 128: e1233–e1241. - PMC - PubMed
    1. Schulze H., and Sandhoff K.. 2011. Lysosomal lipid storage diseases. Cold Spring Harb. Perspect. Biol. 3: a004804. - PMC - PubMed
    1. Baek R. C., Martin D. R., Cox N. R., and Seyfried T. N.. 2009. Comparative analysis of brain lipids in mice, cats, and humans with Sandhoff disease. Lipids. 44: 197–205. - PMC - PubMed
    1. Sango K., Yamanaka S., Hoffmann A., Okuda Y., Grinberg A., Westphal H., McDonald M. P., Crawley J. N., Sandhoff K., Suzuki K., et al. . 1995. Mouse models of Tay-Sachs and Sandhoff diseases differ in neurologic phenotype and ganglioside metabolism. Nat. Genet. 11: 170–176. - PubMed
    1. Huang J. Q., Trasler J. M., Igdoura S., Michaud J., Hanal N., and Gravel R. A.. 1997. Apoptotic cell death in mouse models of GM2 gangliosidosis and observations on human Tay-Sachs and Sandhoff diseases. Hum. Mol. Genet. 6: 1879–1885. - PubMed

Publication types

Substances