. 2018 Jul;27(7):557-566.
doi: 10.1136/bmjqs-2017-007032. Epub 2018 Jan 22.

Symptom-Disease Pair Analysis of Diagnostic Error (SPADE): a conceptual framework and methodological approach for unearthing misdiagnosis-related harms using big data

Affiliations

Symptom-Disease Pair Analysis of Diagnostic Error (SPADE): a conceptual framework and methodological approach for unearthing misdiagnosis-related harms using big data

Ava L Liberman et al. BMJ Qual Saf. 2018 Jul.

Abstract

Background: The public health burden associated with diagnostic errors is likely enormous, with some estimates suggesting millions of individuals are harmed each year in the USA, and presumably many more worldwide. According to the US National Academy of Medicine, improving diagnosis in healthcare is now considered 'a moral, professional, and public health imperative.' Unfortunately, well-established, valid and readily available operational measures of diagnostic performance and misdiagnosis-related harms are lacking, hampering progress. Existing methods often rely on judging errors through labour-intensive human reviews of medical records that are constrained by poor clinical documentation, low reliability and hindsight bias.

Methods: Key gaps in operational measurement might be filled via thoughtful statistical analysis of existing large clinical, billing, administrative claims or similar data sets. In this manuscript, we describe a method to quantify and monitor diagnostic errors using an approach we call 'Symptom-Disease Pair Analysis of Diagnostic Error' (SPADE).

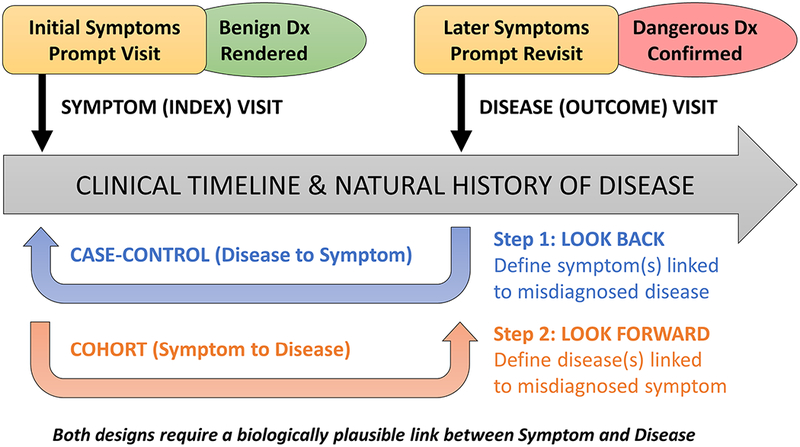
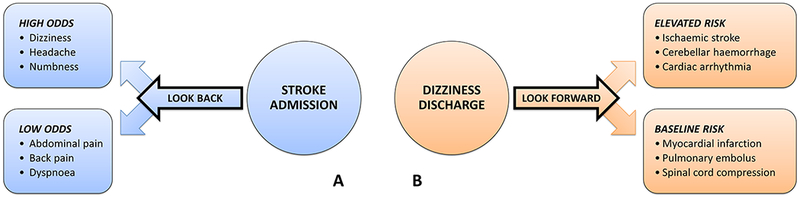
Results: We first offer a conceptual framework for establishing valid symptom-disease pairs illustrated using the well-known diagnostic error dyad of dizziness-stroke. We then describe analytical methods for both look-back (case-control) and look-forward (cohort) measures of diagnostic error and misdiagnosis-related harms using 'big data'. After discussing the strengths and limitations of the SPADE approach by comparing it to other strategies for detecting diagnostic errors, we identify the sources of validity and reliability that undergird our approach.

Conclusion: SPADE-derived metrics could eventually be used for operational diagnostic performance dashboards and national benchmarking. This approach has the potential to transform diagnostic quality and safety across a broad range of clinical problems and settings.

Keywords: diagnostic errors; epidemiology/diagnosis; outcome measures/methods; patient harm; process measures/methods; public health informatics/methods.


Conflict of interest statement

Competing interests: None declared.

Figures

Figure 1
Figure 1
Conceptual model for Symptom-Disease Pair Analysis of Diagnostic Error (SPADE). The SPADE conceptual framework for measuring diagnostic errors is based on the notion of change in diagnosis over time. Envisioned is a scenario in which an initial misdiagnosis is identified through a biologically plausible and clinically sensible temporal association between an initial symptomatic visit (that ended with a benign diagnosis rendered) and a subsequent revisit (that ended with a dangerous diagnosis confirmed); note that these ‘visits’ could also be non-encounter-type events (eg, a particular diagnostic test, treatment with a specific medication, or even death). The framework shown here illustrates differences in structure and goals of the ‘look back’ (disease to symptoms) and ‘look forward’ (symptoms to disease) analytical pathways. These pathways can be thought of as a deliberate sequence that begins with a target disease known to cause poor patient outcomes when a diagnostic error occurs: (1) the ‘look back’ approach defines the spectrum of high-risk presenting symptoms for which the target disease is likely to be missed or misdiagnosed; (2) the ‘look forward’ approach defines the frequency of diseases missed or misdiagnosed for a given high-risk symptom presentation. Dx, diagnosis.
Figure 2
Figure 2
Method for establishing a symptom-disease pair using dizziness-stroke as the exemplar. Envisioned is a ‘symptom’ and ‘disease’ visit occurring as clinical events unfold in the natural history of a disease, as illustrated in figure 1. (A) The ‘look-back’ approach is used to take a single disease known to cause harm (eg, stroke) and identify a number of high-risk symptoms that may be missed (eg, dizziness/vertigo). In this sense, the ‘look-back’ approach (case-control design) can be thought of as hypothesis generating. In the exemplar, stroke is chosen as the disease outcome. Various symptomatic clinical presentations at earlier visits are examined as exposure risk factors, some of which are found to occur with higher-than-expected odds in the period leading up to the stroke admission. (B) The ‘look-forward’ approach is used to take a single symptom known to be misdiagnosed (eg, dizziness/vertigo) and identify a number of dangerous diseases that may be missed (eg, stroke). In this sense, the ‘look-forward’ approach (cohort design) can be thought of as hypothesis testing. In the exemplar, dizziness is chosen as the exposure risk factor, and various diseases are examined as potential outcomes, some of which are found to occur with higher-than-expected risk in the period following the dizziness discharge.
Figure 3
Figure 3
Bidirectional Symptom-Disease Pair Analysis of Diagnostic Error (SPADE) analysis applied to the dizziness-stroke dyad. (A) Patients hospitalised for stroke (n~190 000) are more likely to have had a treat-and-release ED visit for so-called ‘benign’ dizziness within the prior 14 days. Using the ‘lookback’ approach, dizziness is an over-represented symptom (ie, among patients with inpatient stroke admissions, high odds of a recent ED discharge). Treat-and-release ED dizziness discharges occur disproportionately in the days and weeks immediately prior to stroke admission, in a biologically plausible and clinically sensible temporal profile (exponential curve before admission, shown in red) paralleling the natural history of major stroke following minor stroke or transient ischaemic attack (TIA). In contrast, abdominal and back pain discharges are under-represented (ie, among strokes, low odds of a recent ED discharge) and temporally unassociated to the stroke admission (Adapted from Newman-Toker et al). (B) ‘Benign’ dizziness treat-and-release discharges from the ED (n~30 000) are more likely to return for an inpatient stroke admission within the subsequent 30 days. Using the ‘look-forward’ approach, stroke turns out to be the disease with the most elevated short-term risk profile (ie, among patients discharged from the ED with supposedly benign dizziness, the greatest rate of subsequent stroke admission); these occur disproportionately in the days and weeks immediately following the dizziness discharge from the ED, again in a biologically plausible temporal profile (‘hump’ seen after discharge, shown as red hatched area) paralleling the natural history of major stroke following minor stroke or TIA. By contrast, heart attack risk remains at baseline (ie, among dizziness discharges, there is a low, stable rate of myocardial infarction admissions over time) and is temporally unassociated to the initial ED dizziness discharge (Adapted from Kim et al). ED, emergency department; HCUP, Healthcare Cost and Utilization Project; OSHPD, Office of Statewide Health Planning and Development; SEDD, State Emergency Department Databases; SID, State Inpatient Databases.
Figure 4
Figure 4
Linking multiple symptoms to multiple diseases using a Symptom-Disease Pair Analysis of Diagnostic Error (SPADE) framework. Sankey diagram (adapted from Obermeyer et al) demonstrating discharge diagnoses from index ED visit (left) and their association with documented causes of death (right) within 7 days of discharge in a subset of Medicare fee-for-service beneficiaries. These results were obtained using a SPADE-style analysis of over 10 million ED discharges and used multiple symptom-disease pairs to identify likely diagnostic errors. Each index and outcome diagnosis category represents an aggregation of related codes (coding details found in ref 42), and line thickness is proportional to the number of beneficiaries. Statistical analyses found excess, potentially preventable deaths based on hospital admission fraction from the ED. These results highlight the viability of using symptom and disease bundling and statistical analysis of visit patterns to track misdiagnosis-related harms—specifically, in this example, mortality associated with diagnostic errors. ED, emergency department.

Comment in

References

    1. National Academies of Sciences, Engineering, and Medicine. Improving diagnosis in health care. Washington, DC: The National Academies Press, 2015.
    1. Singh H, Meyer AN, Thomas EJ. The frequency of diagnostic errors in outpatient care: estimations from three large observational studies involving US adult populations. BMJ Qual Saf 2014;23:727–31. - PMC - PubMed
    1. Singh H, Giardina TD, Meyer AN, et al. Types and origins of diagnostic errors in primary care settings. JAMA Intern Med 2013;173:418–25. - PMC - PubMed
    1. Newman-Toker DE. Diagnostic value: the economics of high-quality diagnosis and a value-based perspective on diagnostic innovation [lecture]. Modern Healthcare 3rd Annual Patient Safety & Quality Virtual Conference;2015 June 17;online e-conference.
    1. Singh H, Schiff GD, Graber ML, et al. The global burden of diagnostic errors in primary care. BMJ Qual Saf 2017;26:484–94. - PMC - PubMed

Publication types