. 2018 Feb 14;38(7):1677-1698.
doi: 10.1523/JNEUROSCI.2363-17.2017. Epub 2018 Jan 22.

Cortical Connections Position Primate Area 25 as a Keystone for Interoception, Emotion, and Memory

Affiliations

Cortical Connections Position Primate Area 25 as a Keystone for Interoception, Emotion, and Memory

Mary Kate P Joyce et al. J Neurosci. .

Abstract

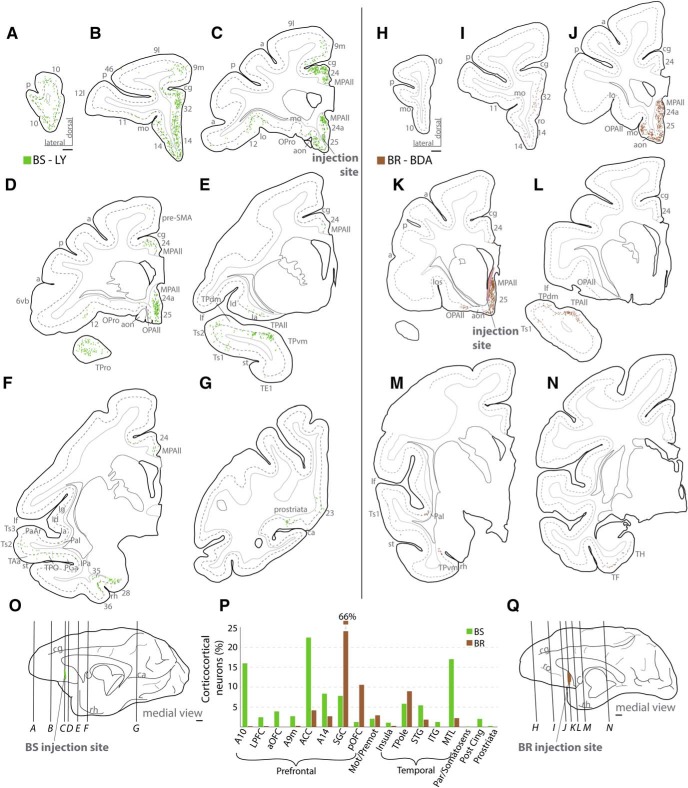
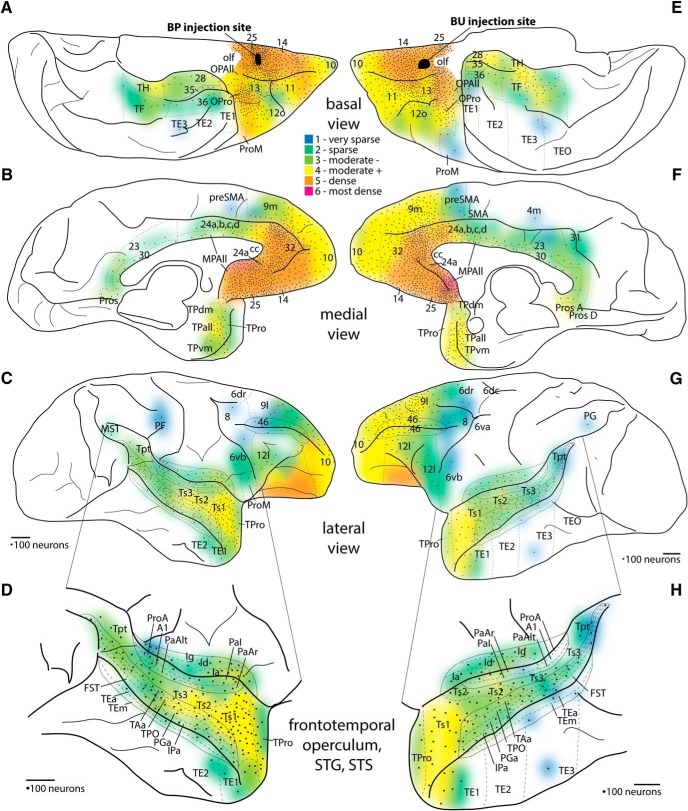
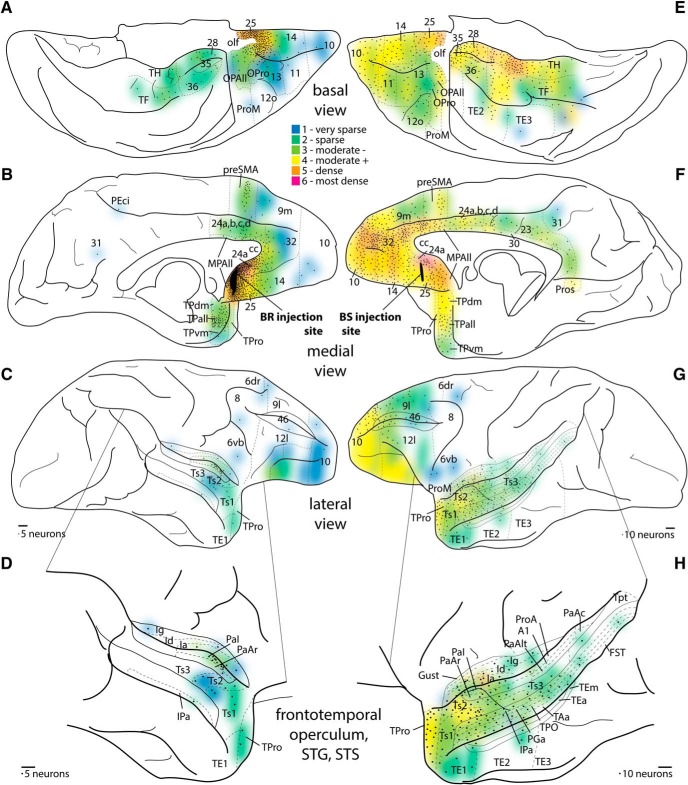
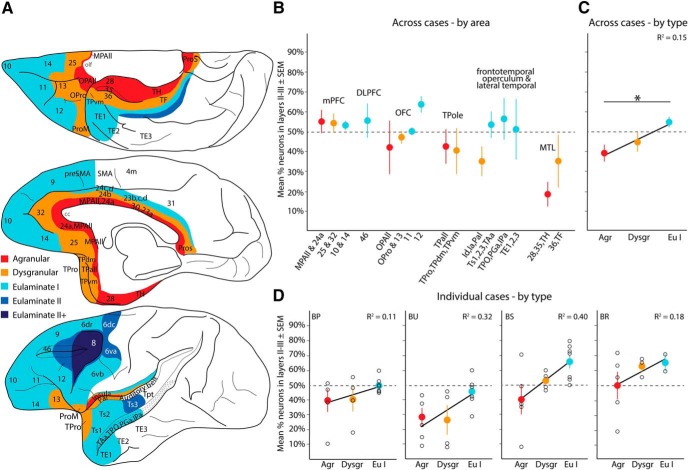
The structural and functional integrity of subgenual cingulate area 25 (A25) is crucial for emotional expression and equilibrium. A25 has a key role in affective networks, and its disruption has been linked to mood disorders, but its cortical connections have yet to be systematically or fully studied. Using neural tracers in rhesus monkeys, we found that A25 was densely connected with other ventromedial and posterior orbitofrontal areas associated with emotions and homeostasis. A moderate pathway linked A25 with frontopolar area 10, an area associated with complex cognition, which may regulate emotions and dampen negative affect. Beyond the frontal lobe, A25 was connected with auditory association areas and memory-related medial temporal cortices, and with the interoceptive-related anterior insula. A25 mostly targeted the superficial cortical layers of other areas, where broadly dispersed terminations comingled with modulatory inhibitory or disinhibitory microsystems, suggesting a dominant excitatory effect. The architecture and connections suggest that A25 is the consummate feedback system in the PFC. Conversely, in the entorhinal cortex, A25 pathways terminated in the middle-deep layers amid a strong local inhibitory microenvironment, suggesting gating of hippocampal output to other cortices and memory storage. The graded cortical architecture and associated laminar patterns of connections suggest how areas, layers, and functionally distinct classes of inhibitory neurons can be recruited dynamically to meet task demands. The complement of cortical connections of A25 with areas associated with memory, emotion, and somatic homeostasis provide the circuit basis to understand its vulnerability in psychiatric and neurologic disorders.SIGNIFICANCE STATEMENT Integrity of the prefrontal subgenual cingulate cortex is crucial for healthy emotional function. Subgenual area 25 (A25) is mostly linked with other prefrontal areas associated with emotion in a dense network positioned to recruit large fields of cortex. In healthy states, A25 is associated with internal states, autonomic function, and transient negative affect. Constant hyperactivity in A25 is a biomarker for depression in humans and may trigger extensive activation in its dominant connections with areas associated with emotions and internal balance. A pathway between A25 and frontopolar area 10 may provide a critical link to regulate emotions and dampen persistent negative affect, which may be explored for therapeutic intervention in depression.

Keywords: connectome; cortical systematic variation; inhibitory neurons; mood disorders; subgenual cingulate; tract-tracing.


Figures

Figure 1.
Figure 1.
Experimental design. A, Bidirectional tracer transport to study connections. B, Exhaustive mapping of tracer-labeled neurons in sections of cortex, a small portion of which is depicted by the thick black outline. Arrowhead indicates a BDA neuron visualized with DAB. Scale bar, 250 μm. C, Strategy for unbiased, systematic stereologic sampling in cortical areas of interest (thick black outline) to quantify density of tracer-labeled terminations (axon boutons) from A25. Terminations in blank squares are not counted. Arrowheads indicate BDA boutons visualized with DAB. Scale bar, 75 μm. D, Schematic depicts five different cortical types based on architectural differences. Agranular areas are three layered cortices with poorly defined lamination, whereas eulaminate II+ depicts areas with the highest level of laminar definition within areas with label in this study.
Figure 2.
Figure 2.
Architecture of A25. A, Nissl-stained coronal section through anterior A25 (Case BB). B, Higher-magnification inset of anterior medial A25. C, Nissl-stained coronal section through mid-level A25. D, Nissl-stained coronal section through posterior A25. E, Higher-magnification inset of posterior medial A25. F, Coronal section stained for SMI-32 through anterior A25 and area 13 (Case BB). Gray arrowhead indicates the transition from A25 to area 13. G, Higher-magnification inset of anterior orbital A25. H, Higher-magnification inset of area 13. Black arrowheads indicate the increase in SMI-32-labeled neurons and processes in layer III of area 13. I, Coronal section stained for myelin through anterior A25 and area 13 (Case AN). Gray arrowhead indicates the transition from A25 to area 13. J, Higher-magnification inset of anterior orbital A25. K, Higher-magnification inset of area 13. Black arrowheads indicate the increase in myelin labeling in area 13 layers III–VI. Scale bars: regional photomicrographs, 1 mm; column insets, 250 μm. All, Allocortex; aon, anterior olfactory nucleus; cc, corpus callosum; cd, caudate; gr, gyrus rectus; lot, lateral olfactory tract; mo, medial orbital sulcus; OPAll, orbital periallocortex (agranular); OPro, orbital proisocortex (dysgranular); o, olfactory sulcus; WM, white matter; 25m, medial A25; 25o, orbital A25.
Figure 3.
Figure 3.
Injection sites. A, Normalized coordinates of the injection sites in A25 on medial surface of the rhesus monkey PFC. B, Coronal sections show deposit of BDA in deep layers of MPAll and all layers of posterior medial A25 (Case BR). C, Coronal sections show deposit of LY in deep and upper layers of anterior medial A25 (Case BS). D, Normalized coordinates of the injection sites in A25 on the orbital (basal) surface of the rhesus monkey PFC. E, Coronal sections show deposit of FE in all layers of anterior orbital A25 (Case BU). F, Coronal sections show deposit of FB in all layers of anterior orbital A25 (Case BP). G, There was no relationship between the size of the injection site and the number of labeled neurons in cortex. Scale bars, 1 mm. Arrowheads indicate injection sites. ac, Anterior commissure; All, allocortex; cd, caudate; cg, cingulate sulcus; gr, gyrus rectus; lot, lateral olfactory tract; mo, medial orbital sulcus; olf, olfactory nuclei; o, olfactory sulcus; ro, rostral sulcus.
Figure 4.
Figure 4.
Distribution of cortical labeled neurons directed to orbital A25. A–N, Coronal sections from rostral (A, H) through caudal (G, N) levels show distribution of retrogradely labeled neurons across cortical areas in 2 cases (A–G: Case BP; H–N: Case BU). Dotted lines on coronal sections indicate boundary between superficial and deep layers as delimited by the bottom of layer III. Most labeled projection neurons were found along the orbital and medial surfaces (B–D, I–K). O, Q, Injection sites on the basal surface of the brain and the level of the coronal sections depicted above. Scale bars, 2 mm. P, Proportion of labeled neurons found by cortical region (grouping of areas is shown below). There is striking similarity of the 2 A25 cases by injection site and distribution of labeled neurons. Grouped areas are as follows: LPFC, areas 46, 9l, 8, 12l; aOFC, 11, 12o; ACC, 32, perigenual 24a and MPAll; SGC, 25, subgenual 24a and MPAll; pOFC, 13, OPro, OPAll; Mot/Premot, 6, preSMA, SMA, 4; Insula, Ia, Id; TPole, TPro, TPAll, TPdm, TPvm; STG, PaI, PaAr, PaAlt, Ts3, Ts2, Ts1, Tpt, MST, TAa, TPO, PGa, IPa, FST; ITG, TEa, TEm, TE1, TE2, TE3, TEO; MTL, areas 28, 35, 36, TH, TF; Post Cing, 23, 30; Prostriata, agranular and dysgranular prostriata. a, Arcuate sulcus; aon, anterior olfactory nucleus; ca, calcarine sulcus; cg, cingulate sulcus; FPole, frontal pole; Ia, agranular insula; Id, dysgranular insula; ITG, inferior temporal gyrus; lf, lateral fissure; lo, lateral orbital sulcus; lot, lateral olfactory tract; mo, medial orbital sulcus; OPAll, orbital periallocortex; OPro, orbital proisocortex; p, principal sulcus; ProM, motor proisocortex; rh, rhinal sulcus; ro, rostral sulcus; st, superior temporal sulcus; TPAll, temporal periallocortex; TPdm, temporal proisocortex dorsomedial; TPvm, temporal proisocortex ventromedial.
Figure 5.
Figure 5.
Distribution of labeled cortical neurons directed to medial A25. A–N, Coronal sections from rostral (A, H) to caudal (G, N) levels show distribution of retrogradely labeled neurons across cortical areas in 2 cases (A–G: Case BS; H–N: Case BR). Dotted lines on coronal sections indicate boundary between superficial and deep layers as delimited by the bottom of layer III. Most labeled projection neurons were found along the orbital and medial surfaces (B–D, J–K). O, Q, Injection sites on the medial surface of the brain and the level of the coronal sections depicted above. Scale bars, 2 mm. P, Proportion of labeled neurons by cortical region. Grouped areas are as follows: LPFC, areas 46, 9l, 8, 12l; aOFC, 11, 12o; ACC, 32, perigenual 24a, MPAll; SGC, 25, subgenual 24a, MPAll; pOFC, 13, OPro, OPAll; Mot/Premot, 6, preSMA; Insula, Ia, Id, Ig; TPole, TPro, TPAll, TPdm, TPvm; STG, PaI, PaAr, Ts3, Ts2, Ts1, Tpt, MST, TAa, TPO, PGa, IPa; ITG, TEa, TEm, TE1, TE2, TE3; MTL, areas 28, 35, 36, TH, TF; Par/Somatosens, 31, PEci; Post Cing, 23, 30; Prostriata, agranular and dysgranular area prostriata. a, Arcuate sulcus; aon, anterior olfactory nucleus; ca, calcarine sulcus; cg, cingulate sulcus; FPole, frontal pole; Ia, agranular insula; Id, dysgranular insula; ITG, inferior temporal gyrus; lf, lateral fissure; lo, lateral orbital sulcus; lot, lateral olfactory tract; mo, medial orbital sulcus; OPAll, orbital periallocortex; OPro, orbital proisocortex; p, principal sulcus; ProM, motor proisocortex; rh, rhinal sulcus; ro, rostral sulcus; st, superior temporal sulcus; TPAll, temporal periallocortex; TPdm, temporal proisocortex dorsomedial; TPvm, temporal proisocortex ventromedial.
Figure 6.
Figure 6.
Density maps of projection neuron populations directed to orbital A25. A–C, Density of cortical connections to A25. Black represents injection site, Case BP. A, Basal surface. B, Medial surface. C, Lateral surface. D, Enlargement of lateral temporal cortex and surrounding areas. E–G, Density of cortical connections to orbital A25. Black represents injection site, Case BU. E, Basal surface. F, Medial surface. G, Lateral surface. H, Enlargement of lateral temporal cortex and surrounding areas. Colors represent the binned normalized density of neurons projecting to A25 from each cortical area, from least dense (1 indicates dark blue) to the most dense (6 indicates red). Dotted lines indicate areal parcellation. Black dots represent every 100 labeled neurons counted from coronal sections depicted as a topographic histogram of projection neurons directed to A25. For each area on a section, one dot was placed for the first bin of 1–100 neurons, and another dot for the next bin of 101–200, and so forth. Dots were placed only once if the area was represented on multiple surfaces, but colors were placed on every surface on which a cortical area appeared (e.g., ventrolateral 10 contains colors in A and C, but dots were placed only in A). Scale bars, 2 mm.
Figure 7.
Figure 7.
Density maps of projection neuron populations directed to medial A25. A–C, Density of cortical connections to A25. Black represents injection site, Case BR. A, Basal surface. B, Medial surface. C, Lateral surface. D, Enlargement of lateral temporal cortex and surrounding areas. E–G, Density of cortical connections to medial A25. Black represents injection site, Case BS. E, Basal surface. F, Medial surface. G, Lateral surface. H, Enlargement of lateral temporal cortex and surrounding areas. Colors represent the binned normalized density of neurons projecting to A25 from each cortical area, with the least dense (1 indicates dark blue) to the most dense (6 indicates red). Dotted lines indicate areal parcellation. Each black dot represents a scaled number of labeled neurons (5 neurons for Case BR; 10 neurons for Case BS) counted in coronal sections, and depicted as a topographic histogram of projection neurons directed to A25. For each area on a section, one dot was placed for the first bin of 1–5 neurons for Case BR and 1–10 neurons for Case BS, and another dot for the next bin of 6–10 neurons (11–20, Case BS), and so forth. Dots were placed only once if the area was represented on multiple surfaces, but colors were placed on every surface on which a cortical area appeared (e.g., ventrolateral 10 contains colors in A and C, but dots were placed only in A). Scale bars, 2 mm.
Figure 8.
Figure 8.
Examples of laminar patterns of labeled projection neurons directed to A25. A, Wide column through area 28 shows darkly labeled neurons in the deep layers (arrowheads, Case BU). B, Higher-magnification inset from layer V shows labeled neurons (arrowheads). C, Higher-magnification inset from B shows labeled axon terminations in layer V (e.g., arrowheads). D, Grayscale epifluorescence shows wide column through area 14 with brightly labeled neurons in layers III and V–VI (e.g., arrowheads, Case BP). E, Wide column through area 12 shows darkly labeled neurons in the superficial layers (arrowheads, Case BU). F, Higher-magnification inset of layer III shows labeled neuron (arrowhead). G, Higher-magnification inset of labeled axon terminations in layer III (e.g., arrowhead). Dotted lines indicate laminar boundaries. ld, Lamina dissecans; WM, white matter.
Figure 9.
Figure 9.
Laminar patterns of A25 pathways vary by cortical type: projection neurons. A, Map of cortical areas projecting to A25 are color-coded by cortical type: agranular (red) to eulaminate II+ (darkest blue). Areas outside the PFC with no A25 connections were left blank. B, Average percentage neurons (±SEM) across cases originating in superficial layers II–III, organized by system and then by laminar structure (indicated by colors that represent cortical types) within each system. Data from some similar architectonic areas within systems were combined (e.g., areas MPAll and 24a). C, Cortical areas in B were pooled across cases and regressed by cortical type. This analysis showed that the proportion of labeled neurons in the superficial layers increased as cortical structure (type) was more elaborate. Average percentage (±SEM) shown (colors) with linear fit from the regression and corresponding adjusted R2. D, Individual cases with average percentage of labeled neurons in superficial layers (±SEM) and linear fit from regression show a consistent upward trend. Black circles represent individual cortical areas and convey variability. olf, Olfactory cortex and nuclei. *significant difference.
Figure 10.
Figure 10.
Laminar patterns of A25 pathways vary by cortical type: axon terminations. A, Map of cortical areas connected with A25 are color-coded by cortical type: agranular (red) to eulaminate II+ (darkest blue). Areas outside the PFC with no A25 connections were left blank. B, Average percentage boutons across cases from A25 (±SEM) found in superficial layers (Cases BU, BS, BR; Case BP had only a retrograde tracer). C, Cortical areas from B were pooled across cases and regressed by cortical type. This analysis showed that the proportion of labeled boutons in the superficial layers increased as cortical structure (type) became more elaborate. D, Individual cases with average percentage of labeled boutons in superficial layers (±SEM) and linear fit from regression show a consistent upward trend. Black circles represent individual cortical areas and convey variability. olf, Olfactory cortex and nuclei. *significant difference.
Figure 11.
Figure 11.
Examples of A25 axon terminations within distinct inhibitory microenvironments. A–C, High magnification of layer V in medial entorhinal area 28 shows A25 terminations (green) comingling with PV neurons and their processes (yellow) and with deeply situated CR neurons (blue). A, Inset from F. D, High magnification of layer III in area 32 shows A25 terminations comingling with CB (red) and CR (blue) neurons (inset from G). E, High magnification of layer III in area 12o shows A25 terminations comingling with CB (red) and CR (blue) neurons (inset from H). F, Low magnification of column through the entire depth of medial entorhinal area 28 shows A25 terminations (green) seen mostly in layer V where PV (yellow) and CR (blue) inhibitory neurons are found (Case BU). G, Low-magnification column through the cortical depth of area 32 shows A25 terminations in the superficial layers, where CB (red) and CR (blue) neurons are prominent (Case BR). H, Low magnification of column through the cortical depth of orbital area 12 shows terminations from A25 mostly in the upper layers, where CB (red) and CR (blue) neurons are found (Case BU). I, High magnification of layer I in area 32 shows A25 terminations coursing through layer I, which contains the apical dendrites from pyramidal neurons below (inset from G). Layer I contains almost no cell bodies, with the exception of CR neurons. Empty arrowheads indicate A25 terminations (green) or color-coded processes of inhibitory neurons. Filled green arrowheads indicate labeled projection neurons directed to A25. Scale bars: A, D, E, I, 100 μm; B, C, 50 μm; F–H, 200 μm. ld, Lamina dissecans.
Figure 12.
Figure 12.
Summary of the cortical connectome of A25. Pathways are color-coded as predominantly feedback or feedforward. A25 is a preferential feedback system to most other areas. Summary schematic of strength (arrow thickness) and connectional type (color) for pathways from A25 projecting to other areas. The thickest arrows fall in the lateral-feedback category. The pattern of label in cortical areas with very sparse connections with A25 is shown with dashed lines. Data from a cortical area's projections to A25 were used in complement with terminations from A25. cc, Corpus callosum; pros, prostriata; retrospl, retrosplenial; TPole, temporal pole.

References

    1. An X, Bandler R, Ongür D, Price JL (1998) Prefrontal cortical projections to longitudinal columns in the midbrain periaqueductal gray in macaque monkeys. J Comp Neurol 401:455–479. 10.1002/(SICI)1096-9861(19981130)401:4<455::AID-CNE3>3.0.CO;2-6 - DOI - PubMed
    1. Anderson MC, Bunce JG, Barbas H (2016) Prefrontal-hippocampal pathways underlying inhibitory control over memory. Neurobiol Learn Mem 134:145–161. 10.1016/j.nlm.2015.11.008 - DOI - PMC - PubMed
    1. Barbas H. (1986) Pattern in the laminar origin of corticocortical connections. J Comp Neurol 252:415–422. 10.1002/cne.902520310 - DOI - PubMed
    1. Barbas H. (1993) Organization of cortical afferent input to orbitofrontal areas in the rhesus monkey. Neuroscience 56:841–864. 10.1016/0306-4522(93)90132-Y - DOI - PubMed
    1. Barbas H. (1995) Anatomic basis of cognitive-emotional interactions in the primate prefrontal cortex. Neurosci Biobehav Rev 19:499–510. 10.1016/0149-7634(94)00053-4 - DOI - PubMed

Publication types