. 2018 Feb 13;115(7):1646-1651.
doi: 10.1073/pnas.1714760115. Epub 2018 Jan 22.

Centipedes subdue giant prey by blocking KCNQ channels

Affiliations

Centipedes subdue giant prey by blocking KCNQ channels

Lei Luo et al. Proc Natl Acad Sci U S A. .

Abstract

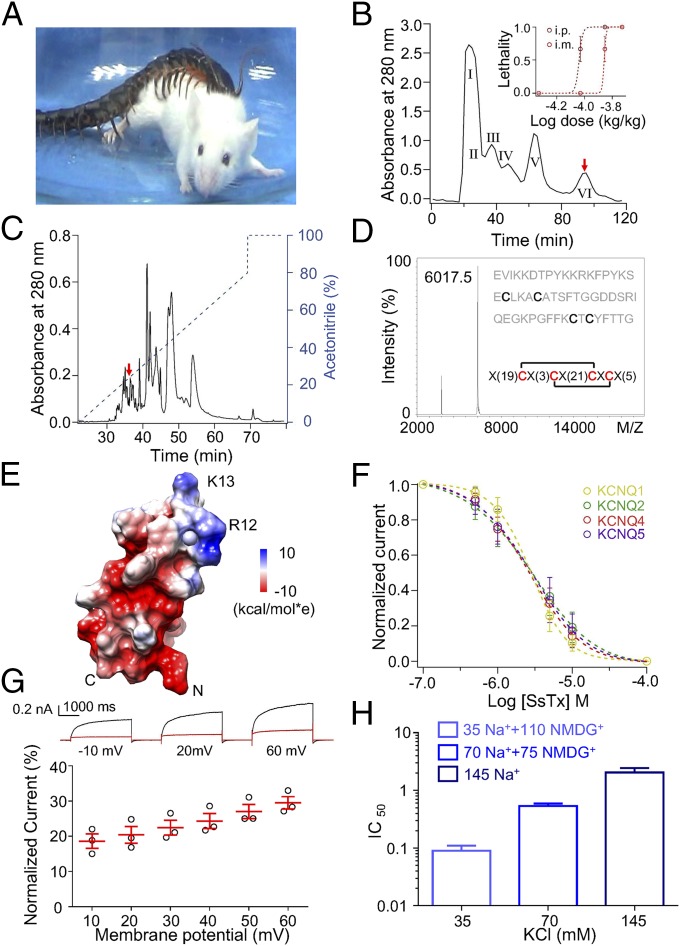
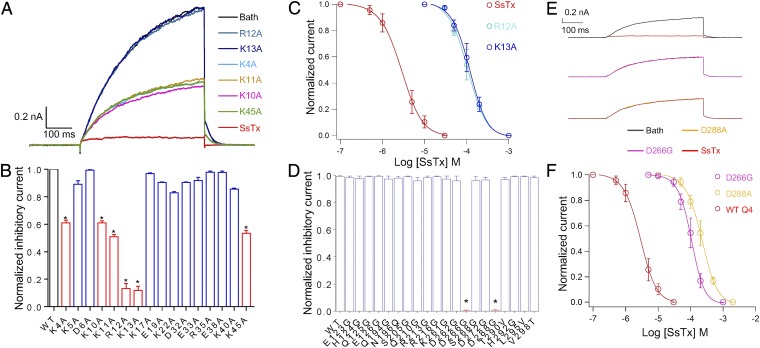
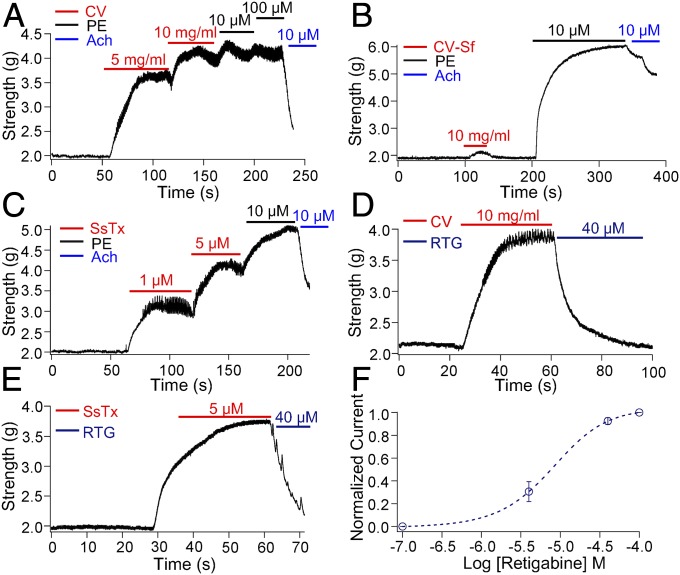
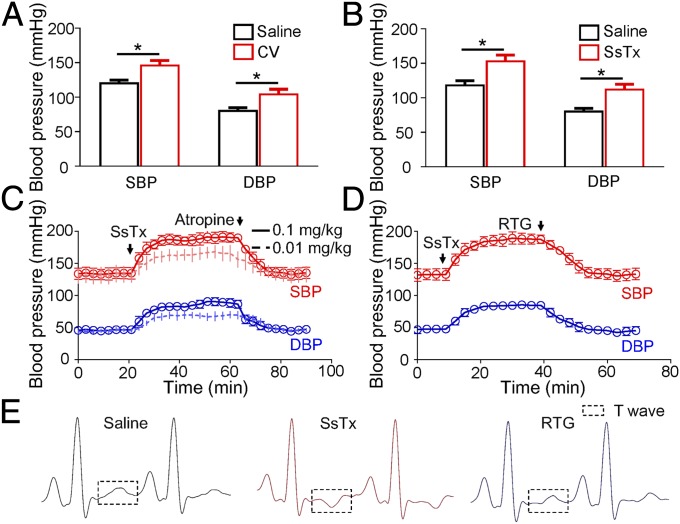
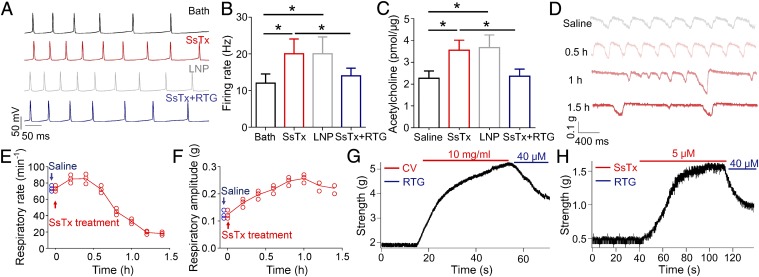
Centipedes can subdue giant prey by using venom, which is metabolically expensive to synthesize and thus used frugally through efficiently disrupting essential physiological systems. Here, we show that a centipede (Scolopendra subspinipes mutilans, ∼3 g) can subdue a mouse (∼45 g) within 30 seconds. We found that this observation is largely due to a peptide toxin in the venom, SsTx, and further established that SsTx blocks KCNQ potassium channels to exert the lethal toxicity. We also demonstrated that a KCNQ opener, retigabine, neutralizes the toxicity of a centipede's venom. The study indicates that centipedes' venom has evolved to simultaneously disrupt cardiovascular, respiratory, muscular, and nervous systems by targeting the broadly distributed KCNQ channels, thus providing a therapeutic strategy for centipede envenomation.

Keywords: KCNQ; SsTx; centipede; toxicity.


Conflict of interest statement

The authors declare no conflict of interest.

Figures

Fig. 1.
Fig. 1.
Identification of a KCNQ blocker, SsTx, from the venom of S. subspinipes mutilans. (A) Image of a S. subspinipes mutilans preying on a Kunming mouse. (B) Diluted crude venom of golden head centipedes was subjected to Sephadex G-50 gel filtration. The protein fraction containing SsTx is marked as a red arrow. (Inset) Lethalty rate of mice recorded after i.p. and i.m. injection of crude venom and then fitted to a Hill equation (n = 3 animals per group, n = 3 groups per point). (C) Isolation of native SsTx (red arrow) from the pooled protein fraction by a C18 RP-HPLC column. (D) MALDI-TOF analysis and sequencing of SsTx, indicated by the 20-to-46 and 24-to-48 assignments. (E) NMR structural model of SsTx, with the electrostatic potential distribution shown in color (red = negative, blue = positive) on the right. The negatively charged surface and the location of R12 and K13 are shown on the NMR structure of SsTx. (F) Dose–response curves displaying the SsTx inhibition of KCNQ1, 2, 4, and 5. Data were fit with a Hill equation. The IC50 and slope factor values are 2.8 ± 0.5 μM and 1.74 ± 0.04 (n = 5 cells) for KCNQ1, 2.7 ± 0.4 μM and 0.99 ± 0.06 (n = 5 cells) for KCNQ2, 2.5 ± 0.4 μM and 1.18 ± 0.03 (n = 5 cells) for KCNQ4, and 2.7 ± 0.5 μM and 1.12 ± 0.06 (n = 5 cells) for KCNQ5, respectively. (G) The inhibitory percentage of KCNQ4 currents in the presence of 10 μM SsTx, recorded with increases in test pulses from a resting membrane potential of −80 mV (n = 3). (H) The half-maximum response of SsTx in different K+ concentrations recorded from KCNQ4-expressing HEK293T cells (n = 5 cells per bar). Average values represent means ± SEMs.
Fig. 2.
Fig. 2.
Key residues involved in the interaction between SsTx and KCNQ4. (A) Representative whole-cell KCNQ4 currents from the same HEK293T cell recorded in the presence of 10 μM of WT SsTx and single point mutants (K4A, K10A, K11A, R12A, K13A, and K45A) sequentially. Before applications of each compound, the cells were perfused by bath solution for 30 s to ensure that the currents return to the same level. (B) Normalized inhibitory currents of 50 μM WT SsTx (n = 3) and 50-μM toxin mutants (n = 10). *P < 0.05 compared with WT group. (C) Inhibition of KCNQ4 by various concentrations of WT SsTx, R12A, and K13A. The data were fit to a Hill equation, and the IC50 and slope factor values are 2.5 ± 0.4 μM and 1.18 ± 0.05 (n = 5 cells) for WT SsTx, 104.7 ± 5.4 μM and 2.05 ± 0.09 (n = 5 cells) for R12A mutants, and 117.5 ± 6.1 μM and 1.93 ± 0.08 (n = 5 cells) for K13A mutants. (D) The normalized inhibitory currents of WT KCNQ4 (n = 3) and point mutants (n = 5) at extracellular domains in the presence of 31.6 μM SsTx. *P < 0.05 compared with the WT group. (E) Representative whole-cell WT KCNQ4 (Top), D266G (Middle), and D288A (Bottom) currents recorded in the presence of 10 μM SsTx. (F) Dose–response relationships of SsTx against WT KCNQ4, D266G, and D288A. Smooth curves are fit of data points to the Hill equation. The IC50 and slope factor values are 2.5 ± 0.4 μM and 1.18 ± 0.05 (n = 5 cells) for WT SsTx, 108.2 ± 6.3 μM and 2.11 ± 0.09 (n = 5 cells) for D266G mutants, and 218.8 ± 7.6 μM and 1.76 ± 0.08 (n = 5 cells) for D288A mutants. Average values represent means ± SEMs.
Fig. 3.
Fig. 3.
Mutant cycle analysis for pairwise coupling of R12/D288 and K13/D266 (A, Top) schematic diagram of the mutant cycle analysis (Top; IC50_1 indicates IC50 value measured from the condition where WT channels are inhibited by SsTx). (A, Bottom) Representative concentration–response curves for determining the interaction Ln(Ω) value between R12 and D266 [n = 10, SsTx (WT):KCNQ4(WT); n = 5, SsTx(WT):KCNQ4(D266G); n = 4, SsTx(R12A):KCNQ4(WT); n = 6, SsTx(R12A):KCNQ4(D266G)]. (B) Representative dose–response curves for the SsTx 45K and KCNQ4 D266 pair [n = 10, SsTx(WT):KCNQ4(WT); n = 5, SsTx(WT):KCNQ4(D266G); n = 5, SsTx(K45A):KCNQ4(WT); n = 6, SsTx(K45A):KCNQ4(D266G)]. (C) Summary of interaction Ln(Ω) values (n = 6 for K13/D266 pair, n = 3 for other pairs). (D) Dose–response curves for determining the interaction Ln(Ω) value between the SsTx K13 and KCNQ4 D266 pair [n = 10, SsTx(WT):KCNQ4(WT); n = 5, SsTx(WT):KCNQ4(D266G); n = 4, SsTx(K13A):KCNQ4(WT); n = 8, SsTx(K13A):KCNQ4(D266G)]. (E) Molecular docking of SsTx onto KCNQ4. The side chains of R12/K13 in SsTx and D266/D288 in KCNQ4 are shown. (F) Dose–response curves for determining the interaction Ln(Ω) value between the SsTx R12 and KCNQ4 D288 pair [n = 10, SsTx(WT):KCNQ4(WT); n = 5, SsTx(WT):KCNQ4(D288A); n = 4, SsTx(R12A):KCNQ4(WT); n = 6, SsTx(R12A):KCNQ4(D288A)]. mut, mutant.
Fig. 4.
Fig. 4.
Effects of SsTx on vascular contractility of thoracic aortas. Representative vascular contractility of thoracic aorta when challenged sequentially with (A) CV, PE, and ACh; (B) CV-Sf, PE, and ACh; (C) 1 and 5 μM SsTx, PE, and ACh; (D) 10 mg/mL CV and 40 μM RTG; and (E) 5 μM SsTx and 40 μM RTG. (F) Concentration–response curves of current increases at different concentrations of RTG in the presence of 5 μM SsTx. The smooth curve was a fitting of data points to the Hill equation. The average EC50 value is 7.83 ± 0.12 μM (n = 6 cells per data point). Increased currents from that in the presence of 5 μM SsTx were normalized by the increased currents in the presence of saturated RTG. CV, crude venom; PE, phenylephrine; RTG, retigabine.
Fig. 5.
Fig. 5.
SsTx causes disorders in the cardiovascular system. (A) Blood pressure of mice, including SBP and DBP recorded 10 min after i.v. injection of saline (n = 6 animals per bar) or CV (30 mg/kg, n = 6 animals per bar). *P < 0.05. (B) Blood pressure of mice, including SBP and DBP recorded 10 min after i.v. injection of saline (n = 10 animals per bar) or SsTx (0.5 mg/kg, n = 10 animals per bar). *P < 0.05. (C) Blood pressure of monkeys, including SBP (in red) and DBP (in blue) recorded every 3 min before and after i.v. injection of SsTx (n = 3, 0.1 mg/kg, solid line; n = 3, 0.01 mg/kg, dotted line) and atropine. (D) Blood pressure of monkeys, including SBP (in red) and DBP (in blue) recorded every 3 min before and after i.v. injection of SsTx (n = 3, 0.1 mg/kg; solid line) and RTG (1 mg/kg). (E) Representative three-lead surface ECG of a monkey recorded 10 min after i.v. injection of saline (n = 3) or SsTx (n = 3, 0.01 mg/kg) and followed by a rescue with RTG (1 mg/kg) after SsTx (0.01 mg/kg) injection (n = 3). CV, crude venom; DBP, diastolic blood pressure; RTG, retigabine; SBP, systolic blood pressure.
Fig. 6.
Fig. 6.
SsTx interrupts nervous and respiratory systems. (A) Response of CA1 pyramidal neurons after application of 40 pA depolarizing current injected into the cell when challenged sequentially with 10 μM SsTx, 100 μM LNP, and the mixture of 10 μM SsTx and 40 μM RTG. Before applications of each compound, the brain slices were perfused by bath solution for 10 min to ensure that the firing rates return to the level before compound administration. (B) Summary of spiking frequency in the presence of bath solution (n = 7), 10 μM SsTx (n = 7), 100 μM LNP (n = 7), and the mixture of 10 μM SsTx and 40 μM RTG (n = 4). *P < 0.05. (C) Acetylcholine concentrations quantified 30 min after microinjection of 1 μL of saline (n = 6), 20 μM SsTx (n = 6), 100 μM LNP (n = 6), or the mixture of 10 μM SsTx and 40 μM RTG (n = 3) into the hippocampus of mice. *P < 0.05. (D) Representative respiratory traces on rats were recorded before and after 2 mg/kg SsTx administration by i.v. injection. The changes in rats’ respiratory rates (E) and amplitudes (F) when challenged with i.v.-injected SsTx (n = 3 animals per point, 2 mg/kg). Representative vascular contractility of bronchial ring contraction when challenged sequentially with (G) CV and RTG (n = 3 rats) and (H) SsTx and RTG (n = 3 rats). CV, crude venom; LNP, linopirdine; RTG, retigabine.

References

    1. Balgooyen TC. Behaviour and ecology of the American kestrel (Falco sparverius L.) in the Sierra Nevada of California. Univ Calif Publ Zool. 1976;103:1–84.
    1. Griffiths D. Foraging costs and relative prey size. Am Nat. 1980;116:743–752.
    1. Dufton MJ. Venomous mammals. Pharmacol Ther. 1992;53:199–215. - PubMed
    1. Undheim EAB, King GF. On the venom system of centipedes (Chilopoda), a neglected group of venomous animals. Toxicon. 2011;57:512–524. - PubMed
    1. McCue MD. Enzyme activities and biological functions of snake venoms. Appl Herpetol. 2005;2:109–123.

Publication types

MeSH terms

Associated data