. 2018 Feb 6;115(6):1192-1197.
doi: 10.1073/pnas.1710653115. Epub 2018 Jan 22.

Molecular clutch drives cell response to surface viscosity

Affiliations

Molecular clutch drives cell response to surface viscosity

Mark Bennett et al. Proc Natl Acad Sci U S A. .

Abstract

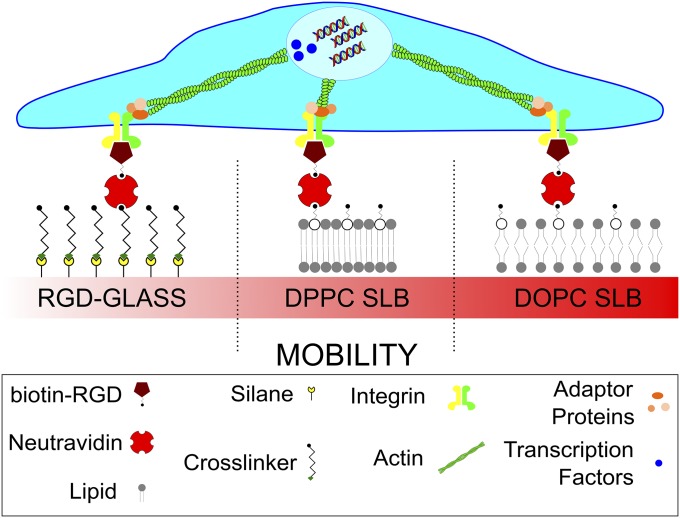
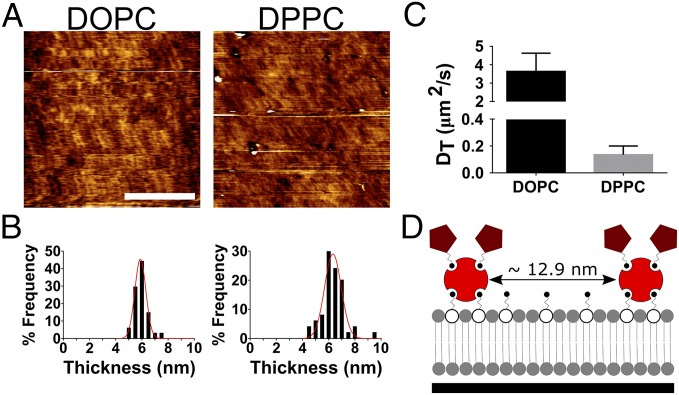
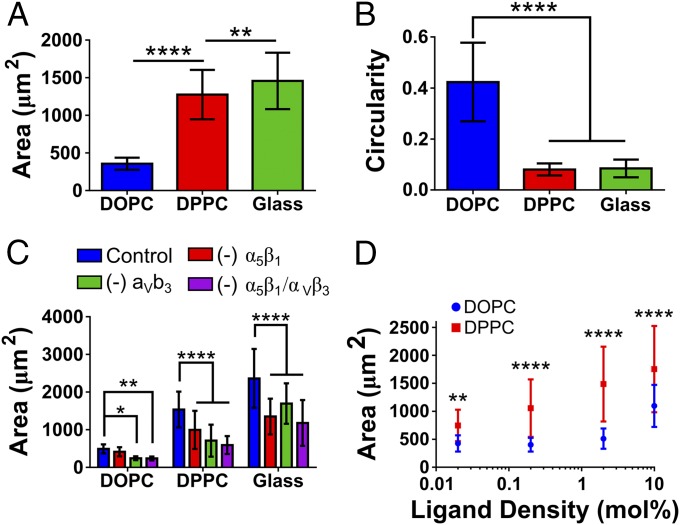
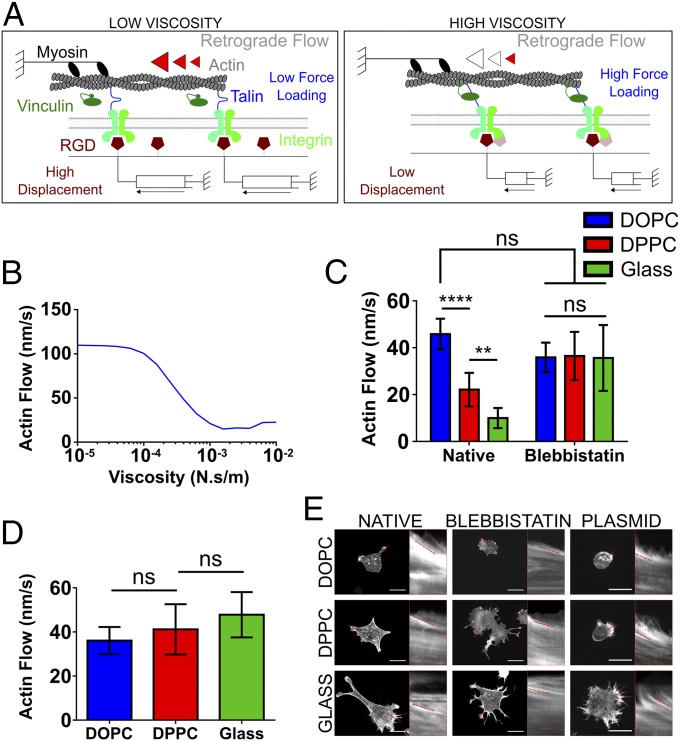
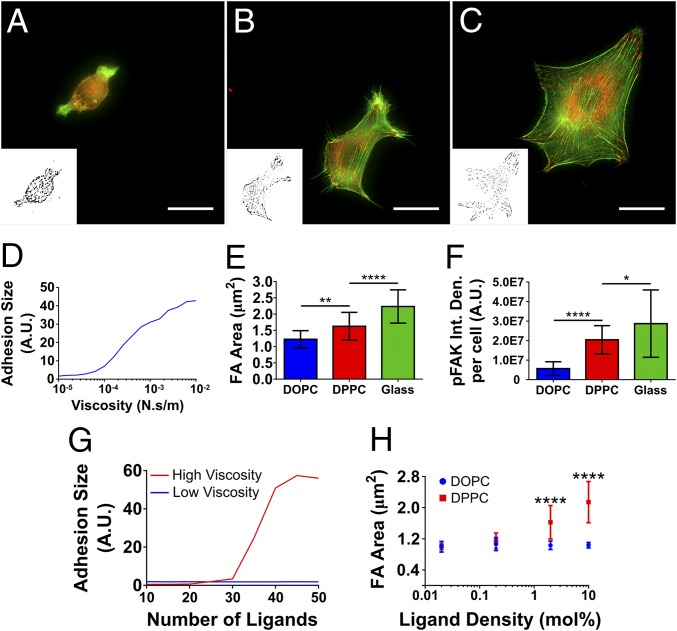
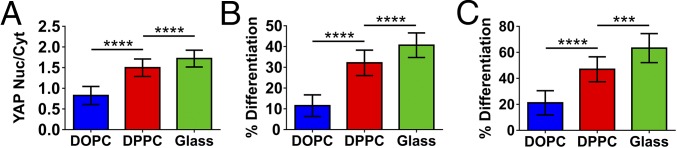
Cell response to matrix rigidity has been explained by the mechanical properties of the actin-talin-integrin-fibronectin clutch. Here the molecular clutch model is extended to account for cell interactions with purely viscous surfaces (i.e., without an elastic component). Supported lipid bilayers present an idealized and controllable system through which to study this concept. Using lipids of different diffusion coefficients, the mobility (i.e., surface viscosity) of the presented ligands (in this case RGD) was altered by an order of magnitude. Cell size and cytoskeletal organization were proportional to viscosity. Furthermore, there was a higher number of focal adhesions and a higher phosphorylation of FAK on less-mobile (more-viscous) surfaces. Actin retrograde flow, an indicator of the force exerted on surfaces, was also seen to be faster on more mobile surfaces. This has consequential effects on downstream molecules; the mechanosensitive YAP protein localized to the nucleus more on less-mobile (more-viscous) surfaces and differentiation of myoblast cells was enhanced on higher viscosity. This behavior was explained within the framework of the molecular clutch model, with lower viscosity leading to a low force loading rate, preventing the exposure of mechanosensitive proteins, and with a higher viscosity causing a higher force loading rate exposing these sites, activating downstream pathways. Consequently, the understanding of how viscosity (regardless of matrix stiffness) influences cell response adds a further tool to engineer materials that control cell behavior.

Keywords: cell differentiation; matrix rigidity; mechanotransduction; molecular clutch; surface viscosity.


Conflict of interest statement

The authors declare no conflict of interest.

Figures

Fig. 1.
Fig. 1.
Sketch of the systems used to control surface viscosity. DOPC and DPPC lipid bilayers were functionalized with same surface density of RGD. Functionalized glass was used as a control. The mobility of the ligands presented on the surface is driven by the viscosity of the bilayer. The proteins and processes cells use to detect this mobility, such as the nature of the FAs, actin flow, and protein translocation are determined. The consequence of these effects on cell differentiation is also evaluated.
Fig. 2.
Fig. 2.
Characterization of SLBs. (A) The AFM (contact mode) images of both the DOPC (fluid phase) and DPPC (gel phase) bilayers. (Scale bar: 2 µm.) (B) The histograms of the thickness of both SLBs fitted to Gaussian distributions as measured via force mapping (DOPC n = 64, DPPC n = 50). (C) The diffusion coefficients of lipid bilayers as measured by fluorescence correlation spectroscopy (DOPC n = 10, DPPC n = 8). (D) A schematic representation of both the average interparticle distance (as calculated by 1/√n, where n is the particle density) and inferred average number of RGD groups per neutravidin (approximately two) molecule as determined by quantitative fluorescence microscopy.
Fig. 3.
Fig. 3.
Physical characteristics of cells on differentially mobile SLBs. (A) The increase in the average area of C2C12 cells as viscosity increases. For all samples n = 64. (B) The concomitant decrease of circularity; from left to right n = 22, 22, and 25. In both cases statistical differences were determined by one-way ANOVA. (C) The reduction in the cell area upon incubation of cells with BMB5 and Gpen, inhibtiors of α5 and α3, respectively, both independently and simultaneously. For DOPC/DPPC/RGD-glass n (control) = 56/53/45; (- α5β1) = 60/59/62; (- αVβ3) = 45/61/60; (- α5β1 & αVβ3) = 58/60/65. (D) The changes in the cell area upon both DOPC and DPPC as the mole percent RGD-containing lipid is increases. For DOPC/DPPC in each ligand n = 21/23, 17/28, 19/27, and 19/29 on 0.02, 0.2, 2, and 10 mol % respectively. Statistical differences in C and D were determined via two-way ANOVA. In D the only the differences between DOPC and DPPC are shown. In DOPC statistical differences noted were only seen between 10 mol % on all other ligand densities. In DPPC a statistical difference between all ligand densities of at least P = 0.01 is seen. Representative images of both C and D are displayed in Figs. S3 and S5, respectively. *P ≤ 0.05, **P ≤ 0.01, ****P ≤ 0.0001.
Fig. 4.
Fig. 4.
Viscosity-dependent actin flow. (A) Schematic representation of the inferred impact of viscosity of the molecular clutch. Myosin contractility pulls on actin filaments, leading to retrograde flow and movement of RGD ligands bound to lipids. On low-viscosity substrates (Left), ligand movement generates low forces, which don’t significantly slow actin flow. On high-viscosity substrates (Right), ligand movement generates high forces, slowing retrograde flow and triggering talin-mediated reinforcement and adhesion growth. (B) The clutch model prediction concerning the actin flow substituting stiffness for viscosity; this shows that as the viscosity of the surface increases there is a concomitant decrease in actin flow. The retrograde flow of actin in LifeAct-RFP transfected C2C12 cells is shown in C with and without blebbistatin, an inhibitor of mechanotransduction. In the native samples from left to right n = 11, 12, and 17, and in the blebbistatin-containing samples n = 9, 9, and 18. (D) The average actin flow after transfection with the VD1 plasmid, which produces the vinculin head domain capable of dominantly binding talin over endogenous vinculin. From left to right n = 10, 12, and 13. (E) Representative images and kymographs for all surfaces. (Scale bars: 25 µm.) ns, P > 0.05, **P ≤ 0.01, ****P ≤ 0.0001.
Fig. 5.
Fig. 5.
Properties and activity of FAs. (AC) The presence of FAs in cells on DOPC, DPPC, and RGD-glass, respectively (red, vinculin; green, actin). Insets show the binary images used to quantify FAs. (Scale bars: 25 µm.) (D) The model prediction of the increase in adhesion size as the viscosity increases. (E) The FAs size in the cells on each of the surfaces. From left to right n = 19, 20, and 20. (F) The activity of the FAs on each surface, a represented by the amount of pFAK. From left to right n = 26, 26, and 15. In both cases (E and F) one-way ANOVA was used to determine statistical differences, which are given as P values, indicated as *P < 0.05, **P < 0.01, and ****P < 0.0001. (G) Model predictions regarding ligand density at high and low viscosity, demonstrating that when viscosity is high (e.g., DPPC) the adhesion size will decrease as the number of ligands, or clutches, decreases. This is in contrast to low viscosity (e.g., DOPC), where no difference is seen. (H) The change in FA size as the ligand density on the fluid-phase (DOPC) and gel-phase (DPPC) SLBs is increased as mole percent of functionalized lipid over three orders of magnitude. For DOPC/DPPC in each ligand n = 21/23, 17/28, 19/27, and 19/29 on 0.02, 0.2, 2, and 10 mol %, respectively. The numbers below each point show the estimated interligand distance between RGD molecules at each ligand density, with the asterisk at 12.9 nm indicating that this is has been measured (as shown in Fig. 2D) and has been used to estimate the remaining distances. Statistical differences were determined via two-way ANOVA, with P values indicated as previous stated. Only the statistical differences between DOPC and DPPC are shown. On DOPC there was no statistical difference between ligand densities. On DPPC 0.02 mol % and 0.2 mol % showed no statistical difference, with differences noted between all other surfaces. Figs. S4 and S5 show representative images of E and F, respectively.
Fig. 6.
Fig. 6.
Downstream effects of viscosity. The cell response is controlled by the force exerted on the surface by the cell, which is in turn defined by the surface’s physical properties; further to this, the signals are then transduced via transcription factors such as YAP and myogenin, driving further cell behaviors, such as differentiation. (A) Shows the increased ratio of the mechnanosensitive YAP in the nucleus as the viscosity is increased (from left to right n = 21, 30, and 55). (B) The further downstream effects of viscosity by increased in the number of nuclei expressing myogenin, as transcription factor involved in the early stages of differentiation of C2C12 cells (from left to right n = 16, 27, and 27). (C) Terminal differentiation of C2C12 cells, through the expression of sarcomeric myosin (from left to right n = 18, 15, and 12). In all cases statistical significance was determined by one-way ANOVA. ***P ≤ 0.001, ****P ≤ 0.0001.

References

    1. Chen CS, Mrksich M, Huang S, Whitesides GM, Ingber DE. Geometric control of cell life and death. Science. 1997;276:1425–1428. - PubMed
    1. Engler AJ, Sen S, Sweeney HL, Discher DE. Matrix elasticity directs stem cell lineage specification. Cell. 2006;126:677–689. - PubMed
    1. Dalby MJ, et al. The control of human mesenchymal cell differentiation using nanoscale symmetry and disorder. Nat Mater. 2007;6:997–1003. - PubMed
    1. Benoit DS, Schwartz MP, Durney AR, Anseth KS. Small functional groups for controlled differentiation of hydrogel-encapsulated human mesenchymal stem cells. Nat Mater. 2008;7:816–823. - PMC - PubMed
    1. McBeath R, Pirone DM, Nelson CM, Bhadriraju K, Chen CS. Cell shape, cytoskeletal tension, and RhoA regulate stem cell lineage commitment. Dev Cell. 2004;6:483–495. - PubMed

Publication types

MeSH terms