. 2018 Feb 6;115(6):E1269-E1278.
doi: 10.1073/pnas.1715724115. Epub 2018 Jan 22.

Sporadic on/off switching of HTLV-1 Tax expression is crucial to maintain the whole population of virus-induced leukemic cells

Affiliations

Sporadic on/off switching of HTLV-1 Tax expression is crucial to maintain the whole population of virus-induced leukemic cells

Mohamed Mahgoub et al. Proc Natl Acad Sci U S A. .

Abstract

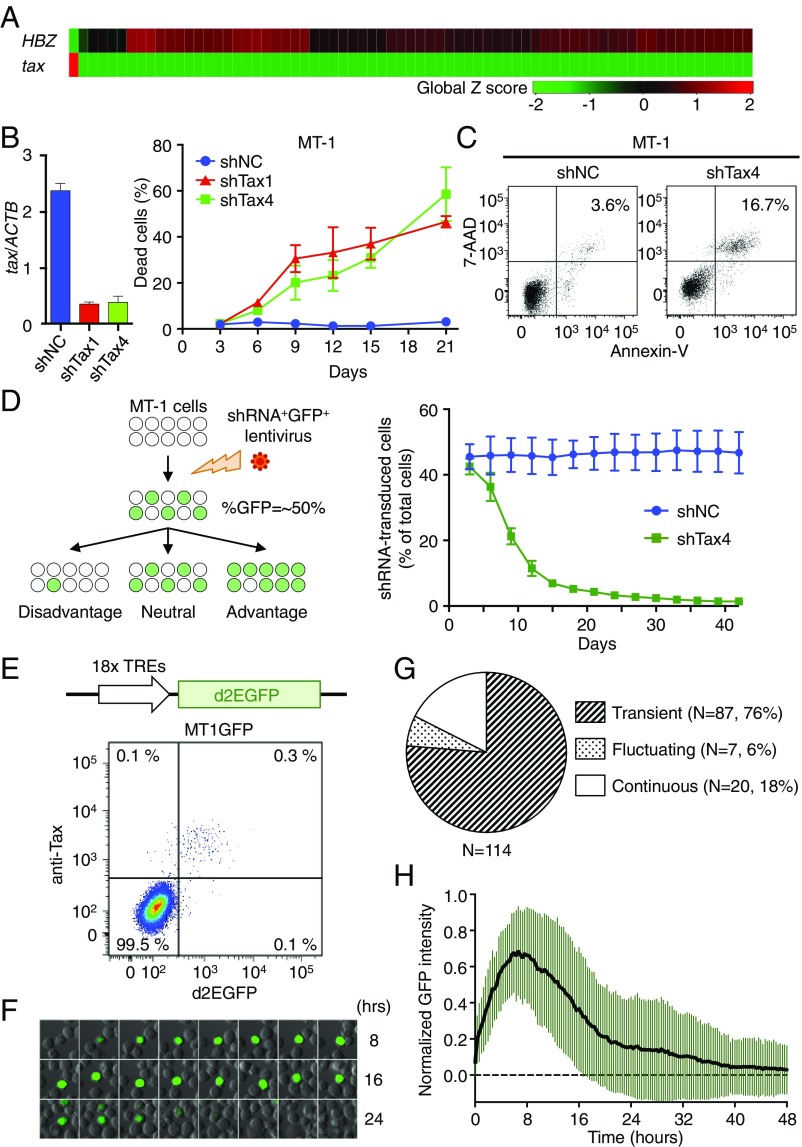
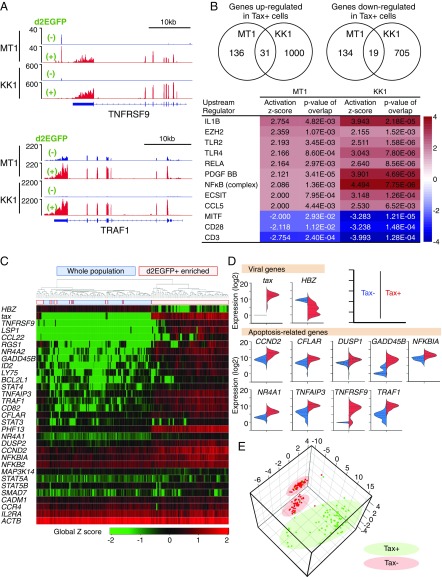
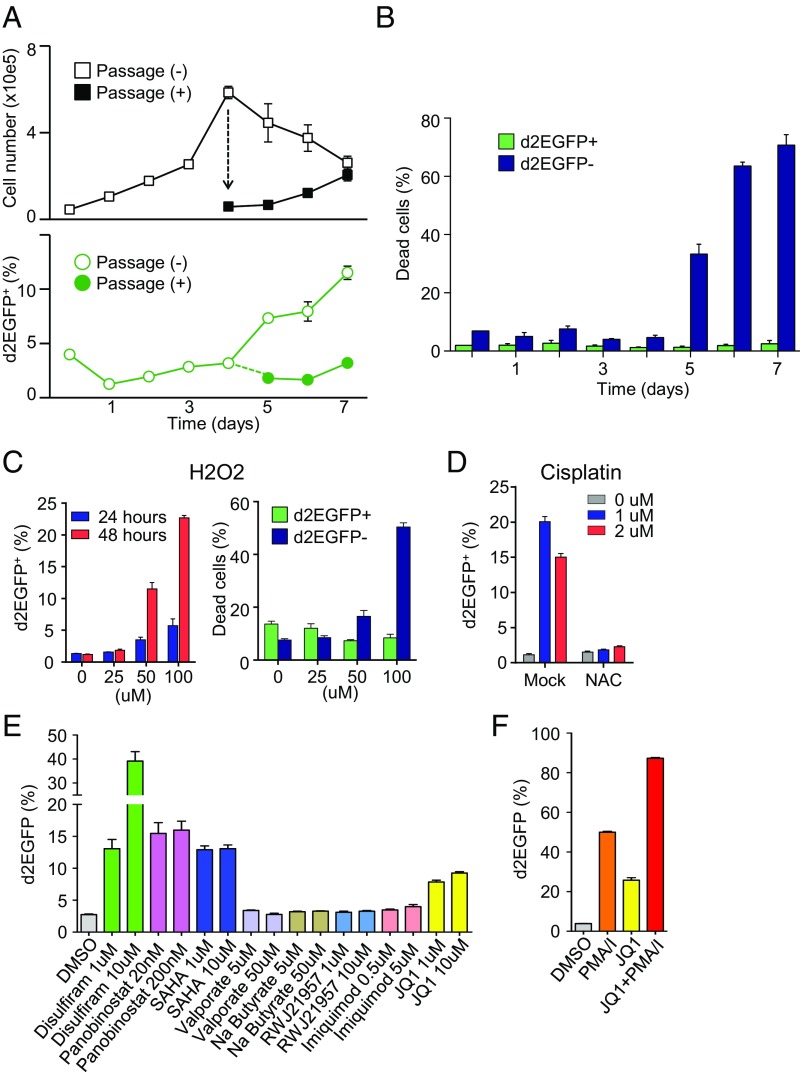
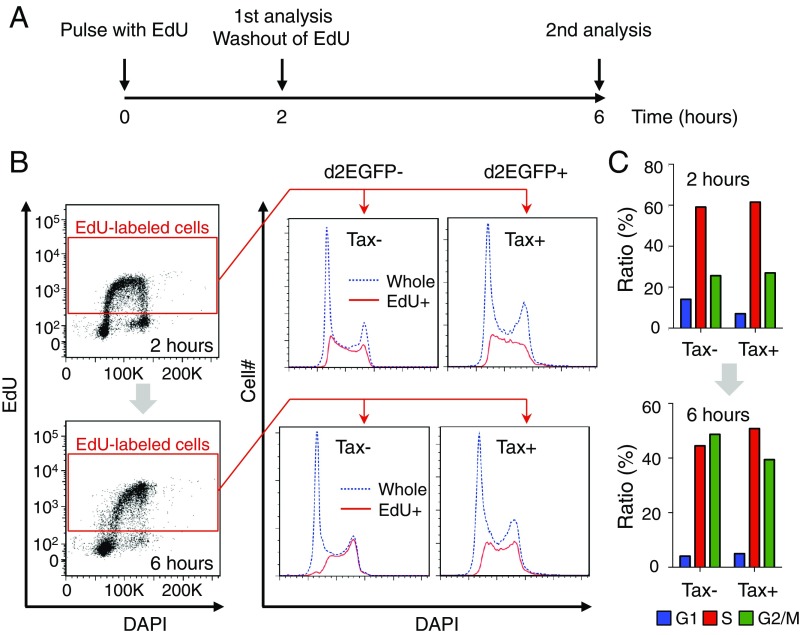
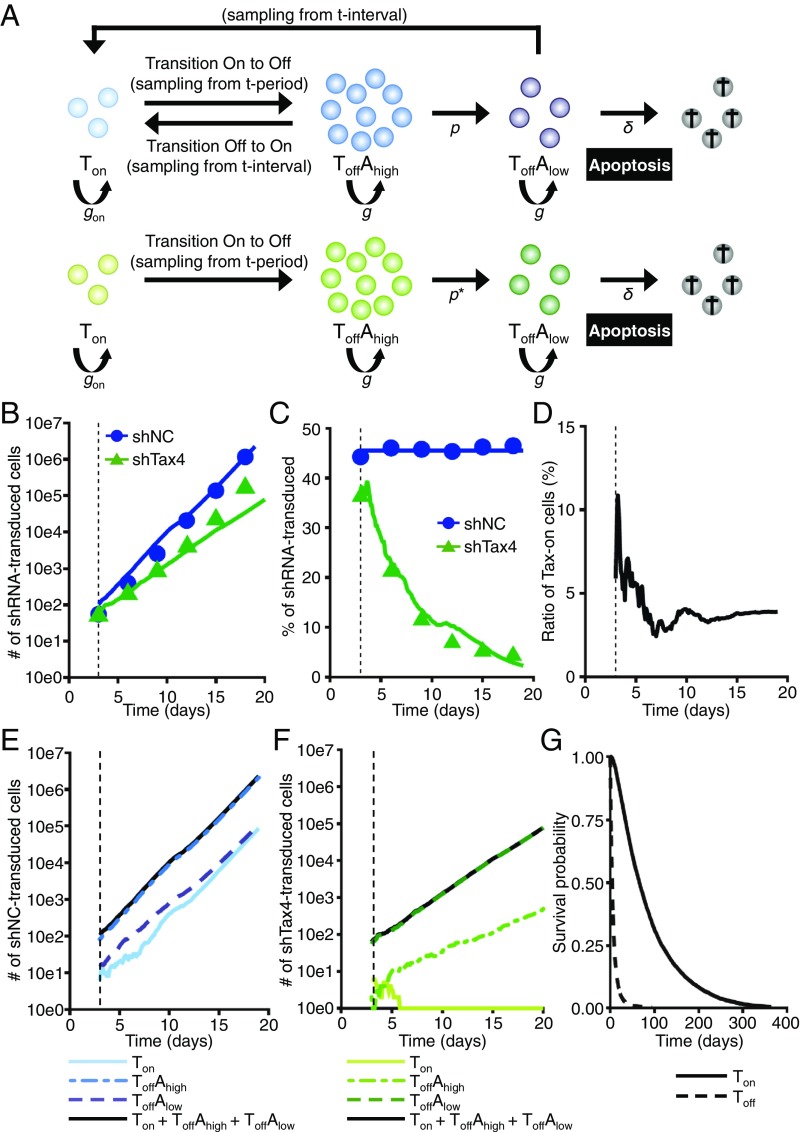
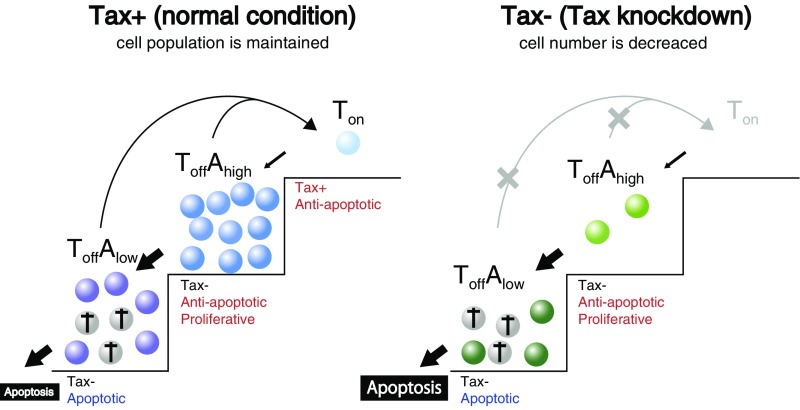
Viruses causing chronic infection artfully manipulate infected cells to enable viral persistence in vivo under the pressure of immunity. Human T-cell leukemia virus type 1 (HTLV-1) establishes persistent infection mainly in CD4+ T cells in vivo and induces leukemia in this subset. HTLV-1-encoded Tax is a critical transactivator of viral replication and a potent oncoprotein, but its significance in pathogenesis remains obscure due to its very low level of expression in vivo. Here, we show that Tax is expressed in a minor fraction of leukemic cells at any given time, and importantly, its expression spontaneously switches between on and off states. Live cell imaging revealed that the average duration of one episode of Tax expression is ∼19 hours. Knockdown of Tax rapidly induced apoptosis in most cells, indicating that Tax is critical for maintaining the population, even if its short-term expression is limited to a small subpopulation. Single-cell analysis and computational simulation suggest that transient Tax expression triggers antiapoptotic machinery, and this effect continues even after Tax expression is diminished; this activation of the antiapoptotic machinery is the critical event for maintaining the population. In addition, Tax is induced by various cytotoxic stresses and also promotes HTLV-1 replication. Thus, it seems that Tax protects infected cells from apoptosis and increases the chance of viral transmission at a critical moment. Keeping the expression of Tax minimal but inducible on demand is, therefore, a fundamental strategy of HTLV-1 to promote persistent infection and leukemogenesis.

Keywords: HBZ; HTLV-1; Tax; adult T-cell leukemia–lymphoma; computational simulation.


Conflict of interest statement

The authors declare no conflict of interest.

Figures

Fig. 1.
Fig. 1.
Significance and dynamics of Tax expression at a single-cell level in MT-1 cells. (A) Single-cell qPCR for tax and HBZ expression in MT-1 cells (n = 71). (B, Left) Efficiency of Tax-KD by shRNA. (B, Right) The percentage of cells that are dead after Tax-KD. MT-1 cells were infected with a bicistronic lentivirus vector expressing GFP and shRNA (shTax1, shTax4, or shNC). Cells were stained with LIVE/DEAD reagent, and the ratio of dead cells to shRNA-transduced (GFP+) cells was measured by flow cytometry. (C) AnnexinV/7-AAD double staining in shRNA-transduced MT-1 cells at day 15 posttransduction. (D, Left) Schematic depicting the concept behind the GFP competition assay. The ratio of GFP+ cells changes over time depending on the effect of shRNA on transduced cells. (D, Right) Serial measurements of the percentage of GFP+ cells among the whole MT-1 cell population after shNC or shTax4 transduction. For B and D, error bars show SDs for three experiments. (E, Upper) Scheme of Tax reporter cassette that expresses d2EGFP. MT1GFP is a stable subline of MT-1 transduced with this cassette. (E, Lower) Intracellular Tax staining of MT1GFP. (F) Live cell imaging of Tax expression in MT1GFP cells. This montage of time-lapse images shows changes in d2EGFP expression. (G) Expression pattern of Tax in MT1GFP. Cells were categorized based on their pattern of d2EGFP expression during the observation period. Continuous, cell continuously expressed d2EGFP until the end of observation period; fluctuating, cell has multiple episodes; transient, cell has a single spontaneous episode. (H) Single-cell dynamics of d2EGFP expression for 87 cells with transient expression. Mean ± SD is shown.
Fig. 2.
Fig. 2.
Differences in gene expression between Tax-expressing and -nonexpressing MT1GFP cells. (A) RNA-Seq analysis comparing Tax+ and Tax− MT1GFP and KK1GFP cells. Read coverage plots for two Tax-associated genes: TNFRSF9 (Upper) and TRAF1 (Lower). (B) Ingenuity pathway analysis for dysregulated genes. Inclusion criteria are fragments per kilobase of transcript per million mapped reads (FPKM) ≥ 1 and greater than or equal to twofold expression change. (Upper) The number of dysregulated genes common to both MT1GFP and KK1GFP. (Lower) Top-scoring activated or inactivated upstream regulators. (C) Heat map of single-cell gene expression for viral and cellular genes in single MT1GFP cells. Two experiments were performed; either d2EGFP+-enriched or -unenriched (whole) populations were subjected to single-cell analysis. Ninety-four cells from each experiment were analyzed. (D) Violin plots comparing expression of viral- and apoptosis-related genes in the Tax+ vs. Tax− populations. Based on the apoptotic process gene list (GO:0006915; Gene Ontology database), nine apoptosis-related genes with expression levels that were significantly correlated with that of tax (r value > 0.5 by Pearson’s correlation test) were identified. (E) 3D PCA plot showing single-cell data clustering based on expression of apoptosis-related genes from D.
Fig. 3.
Fig. 3.
Induction of Tax in MT1GFP cells by cytotoxic stresses and HIV-reactivating reagents. (A) Effect of cellular overgrowth on Tax expression. On day 4, cells were either passaged or allowed to overgrow. Upper shows cell count, and Lower shows percentage of cells that are d2EGFP+ (Tax+). (B) Effect of cellular overgrowth on cell viability in d2EGFP+ (Tax+) and d2EGFP− (Tax−) cells. Viability is measured by LIVE/DEAD staining. (C) Induction of Tax expression by H2O2 treatment. (Left) Percentage of cells that are d2EGFP+ (Tax+); (Right) viability (LIVE/DEAD staining) of d2EGFP+ (Tax+) and d2EGFP− (Tax−) cells after 48 h. (D) Induction of Tax expression by cisplatin treatment is reversed by the antioxidant NAC. (E and F) Effect of HIV-reactivating reagents on Tax expression in MT1GFP cells. (E) The effect of HIV-reactivating reagents on Tax expression. MT1GFP cells were treated for 18 h with the indicated drugs that have been previously reported to reactivate HIV expression. (F) The effect of a combination of JQ-1 and PMA/I on Tax expression. The percentage of cells that are d2EGFP+ was measured by flow cytometry. Each figure is a representative of two independent experiments. Error bars show SDs for three replicates in one experiment.
Fig. 4.
Fig. 4.
Cell cycle transition in d2EGFP+ (Tax+) and d2EGFP− (Tax−) cells. (A) Scheme for analysis of cell cycle transition without cell synchronization. (B and C) Cell cycle phase distributions for EdU+ cells among d2EGFP+ (Tax+) and d2EGFP− (Tax−) cells at 2 and 6 h. (B, Left) Gating strategy for EdU+ cells; (B, Right) linear flow cytometric analysis of cell cycle with DAPI staining. Distribution of EdU+ cells is shown in red, and that of whole cells is blue. (C) Bar charts showing the percentage of EdU+ cells in the indicated phase.
Fig. 5.
Fig. 5.
Agent-based simulations of cell population dynamics under normal and Tax-KD conditions. (A) Scheme for modeling of cell population dynamics as a birth–death (Poisson) process with a stage transition. The ABM simulates the population dynamics of MT-1 cells transduced with shNC or shTax4. (Upper) Normal conditions; (Lower) Tax-KD conditions. (B and C) The time course of the absolute number (B) and fraction (C) of shNC (control) and shTax4 (Tax-KD) cells in a simulation resembling the experiment in Fig. 1D. In this simulated experiment, some MT-1 cells are shRNA+, and some are shRNA−. The simulated population dynamics of the shRNA+ cells in the mixed population are shown. The blue and green lines give the best fit solutions for the agent-based simulations based on Tax period sampling from experimental values (i.e., gray bars in Fig. S3C) and Tax interval sampling from simulated values (i.e., Fig. S3G). All data were fitted simultaneously. (D) The simulated dynamics of the frequency of Tax-expressing cells in the normal MT-1 cell population. A steady state is reached, in which about 3% of cells are Tax+. (E and F) The simulated dynamics of subpopulations of cells transduced with shNC (E, blue lines) or shTax4 (F, green lines). (G) The survival probabilities for subpopulations of shNC cells that have expressed Tax at least once and that have never expressed Tax are described by solid and dashed lines, respectively.
Fig. 6.
Fig. 6.
Proposed model of the dynamics and significance of Tax expression. (Left) Under normal conditions; (Right) under Tax-KD conditions.

References

    1. Virgin HW, Wherry EJ, Ahmed R. Redefining chronic viral infection. Cell. 2009;138:30–50. - PubMed
    1. Traylen CM, et al. Virus reactivation: A panoramic view in human infections. Future Virol. 2011;6:451–463. - PMC - PubMed
    1. Mesri EA, Feitelson MA, Munger K. Human viral oncogenesis: A cancer hallmarks analysis. Cell Host Microbe. 2014;15:266–282. - PMC - PubMed
    1. Tagaya Y, Gallo RC. The exceptional oncogenicity of HTLV-1. Front Microbiol. 2017;8:1425. - PMC - PubMed
    1. Matsuoka M, Jeang KT. Human T-cell leukaemia virus type 1 (HTLV-1) infectivity and cellular transformation. Nat Rev Cancer. 2007;7:270–280. - PubMed

Publication types

MeSH terms

Substances